

Characteristics, Outcomes, and Severity Risk Factors Associated With SARS-CoV-2 Infection Among Children in the US National COVID Cohort Collaborative
- PMID: 35133437
- PMCID: PMC8826172
- DOI: 10.1001/jamanetworkopen.2021.43151
Characteristics, Outcomes, and Severity Risk Factors Associated With SARS-CoV-2 Infection Among Children in the US National COVID Cohort Collaborative
Abstract
Importance: Understanding of SARS-CoV-2 infection in US children has been limited by the lack of large, multicenter studies with granular data.
Objective: To examine the characteristics, changes over time, outcomes, and severity risk factors of children with SARS-CoV-2 within the National COVID Cohort Collaborative (N3C).
Design, setting, and participants: A prospective cohort study of encounters with end dates before September 24, 2021, was conducted at 56 N3C facilities throughout the US. Participants included children younger than 19 years at initial SARS-CoV-2 testing.
Main outcomes and measures: Case incidence and severity over time, demographic and comorbidity severity risk factors, vital sign and laboratory trajectories, clinical outcomes, and acute COVID-19 vs multisystem inflammatory syndrome in children (MIS-C), and Delta vs pre-Delta variant differences for children with SARS-CoV-2.
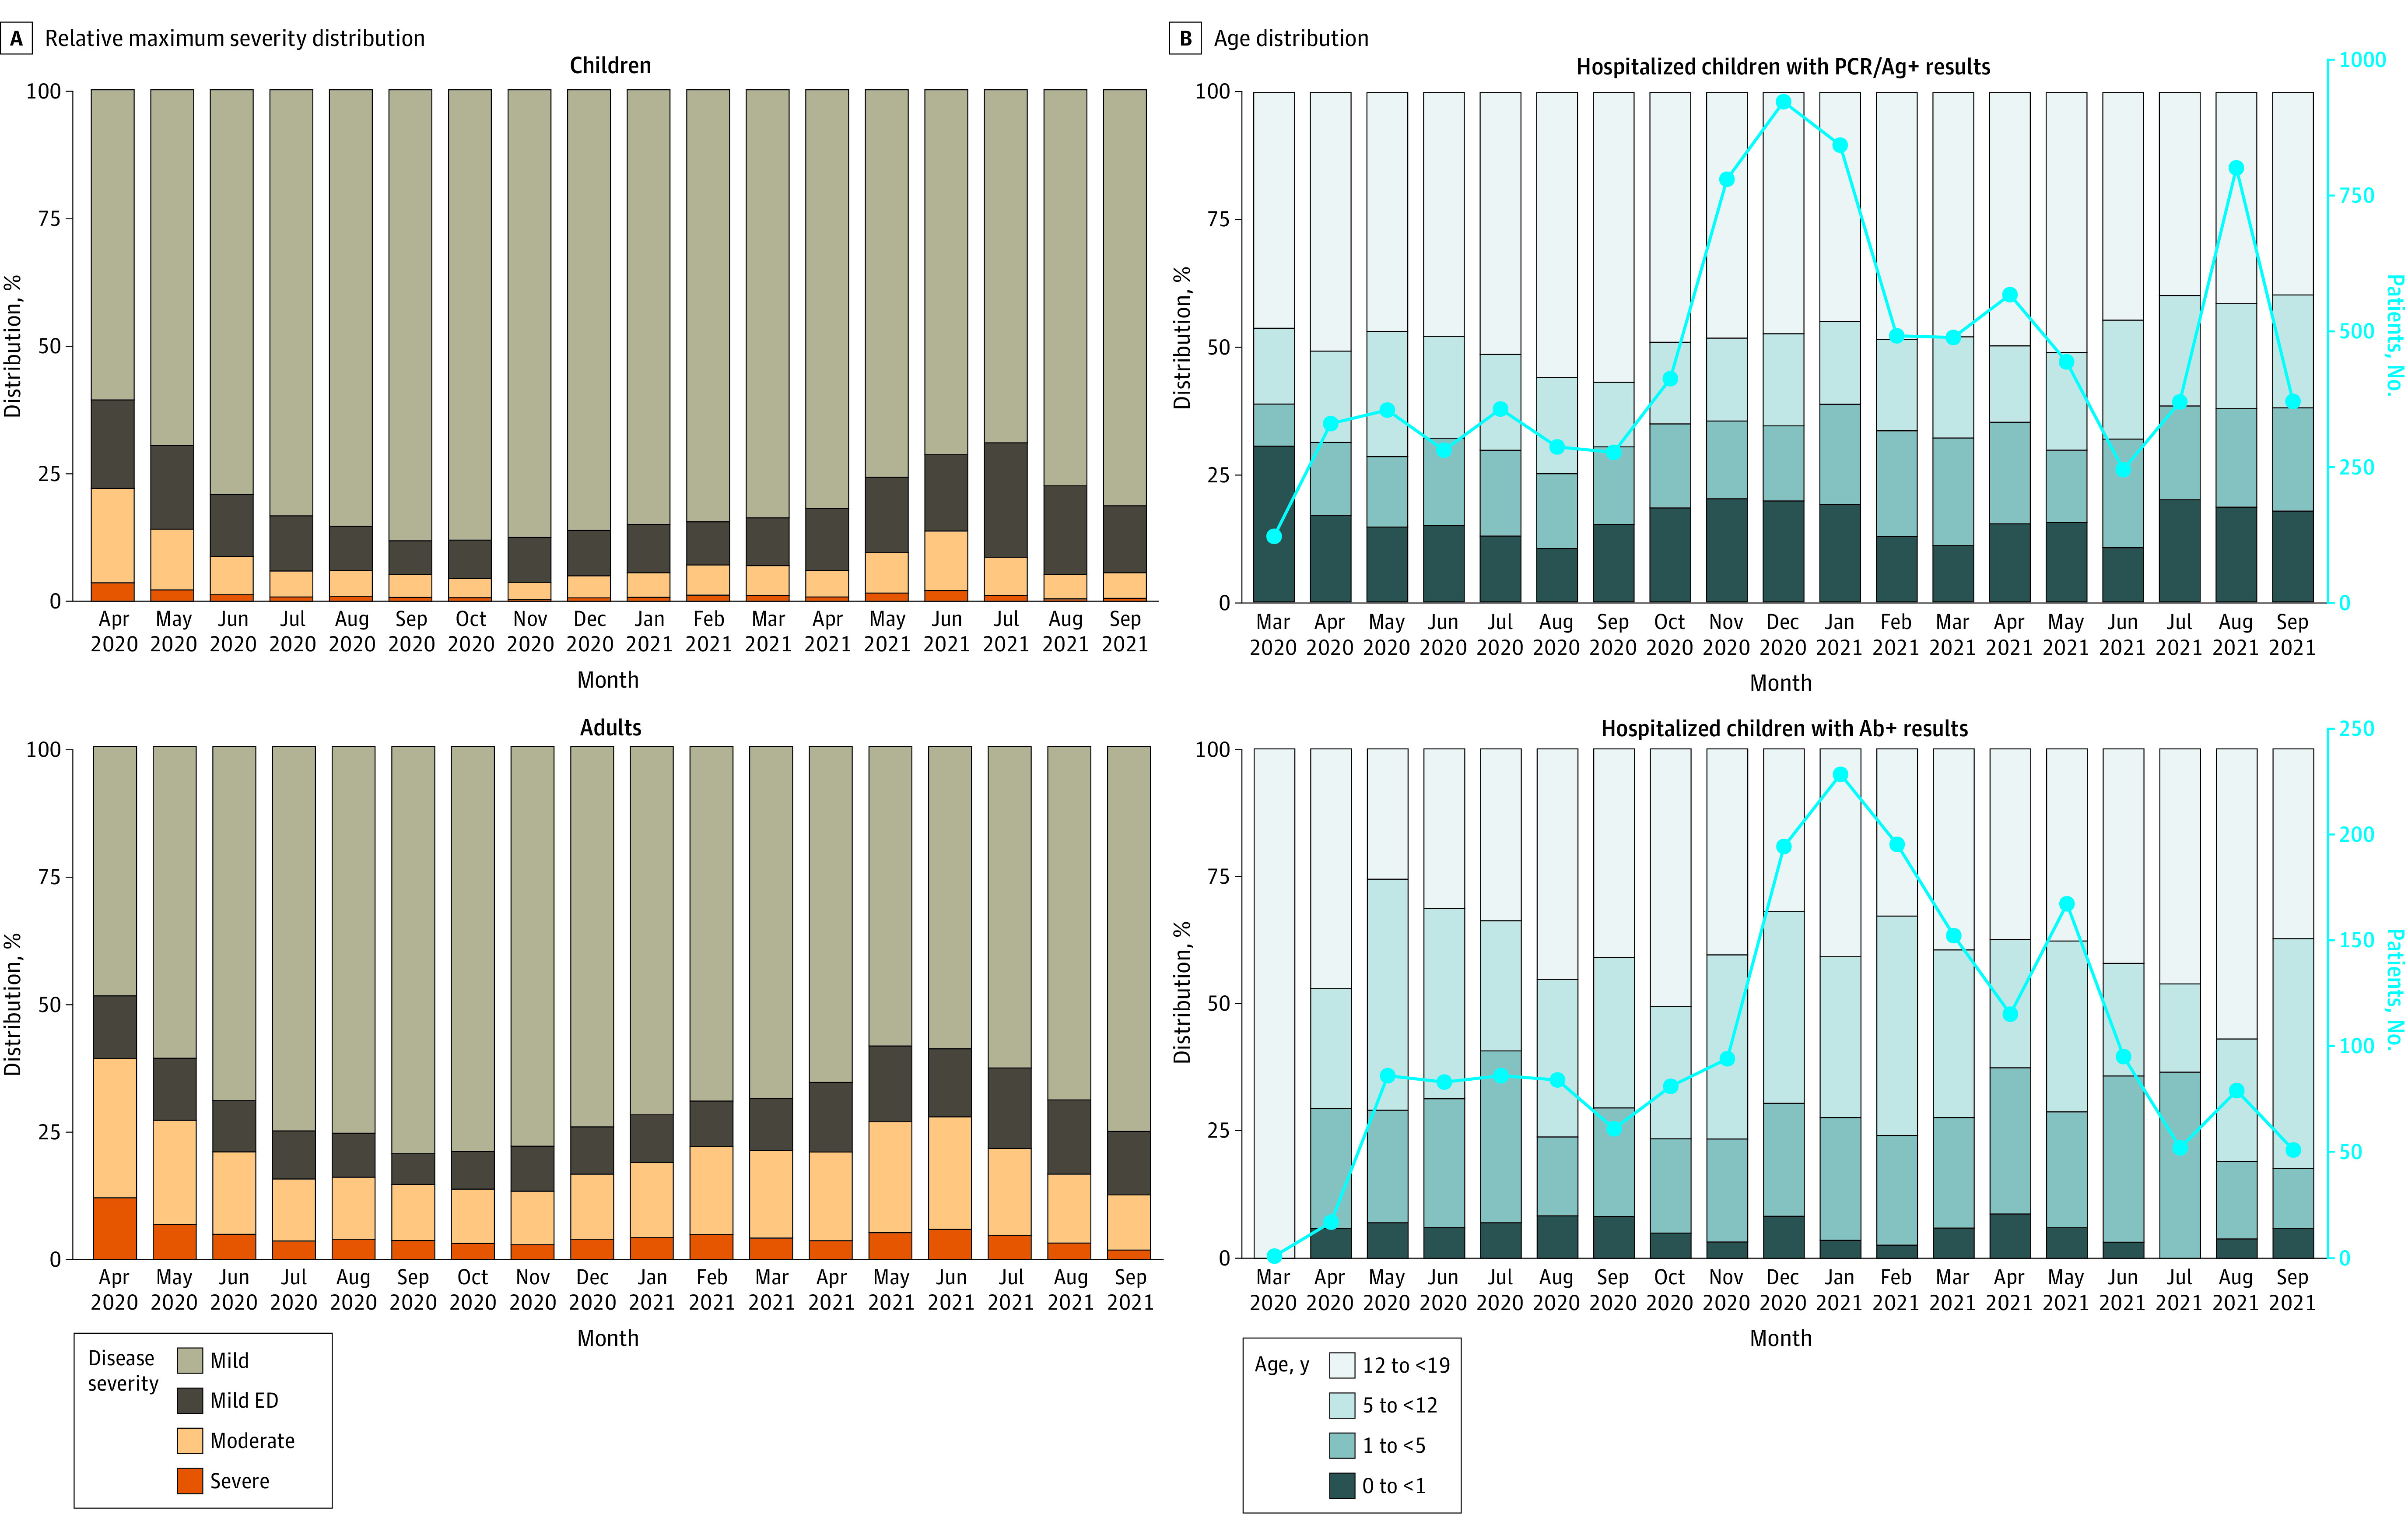
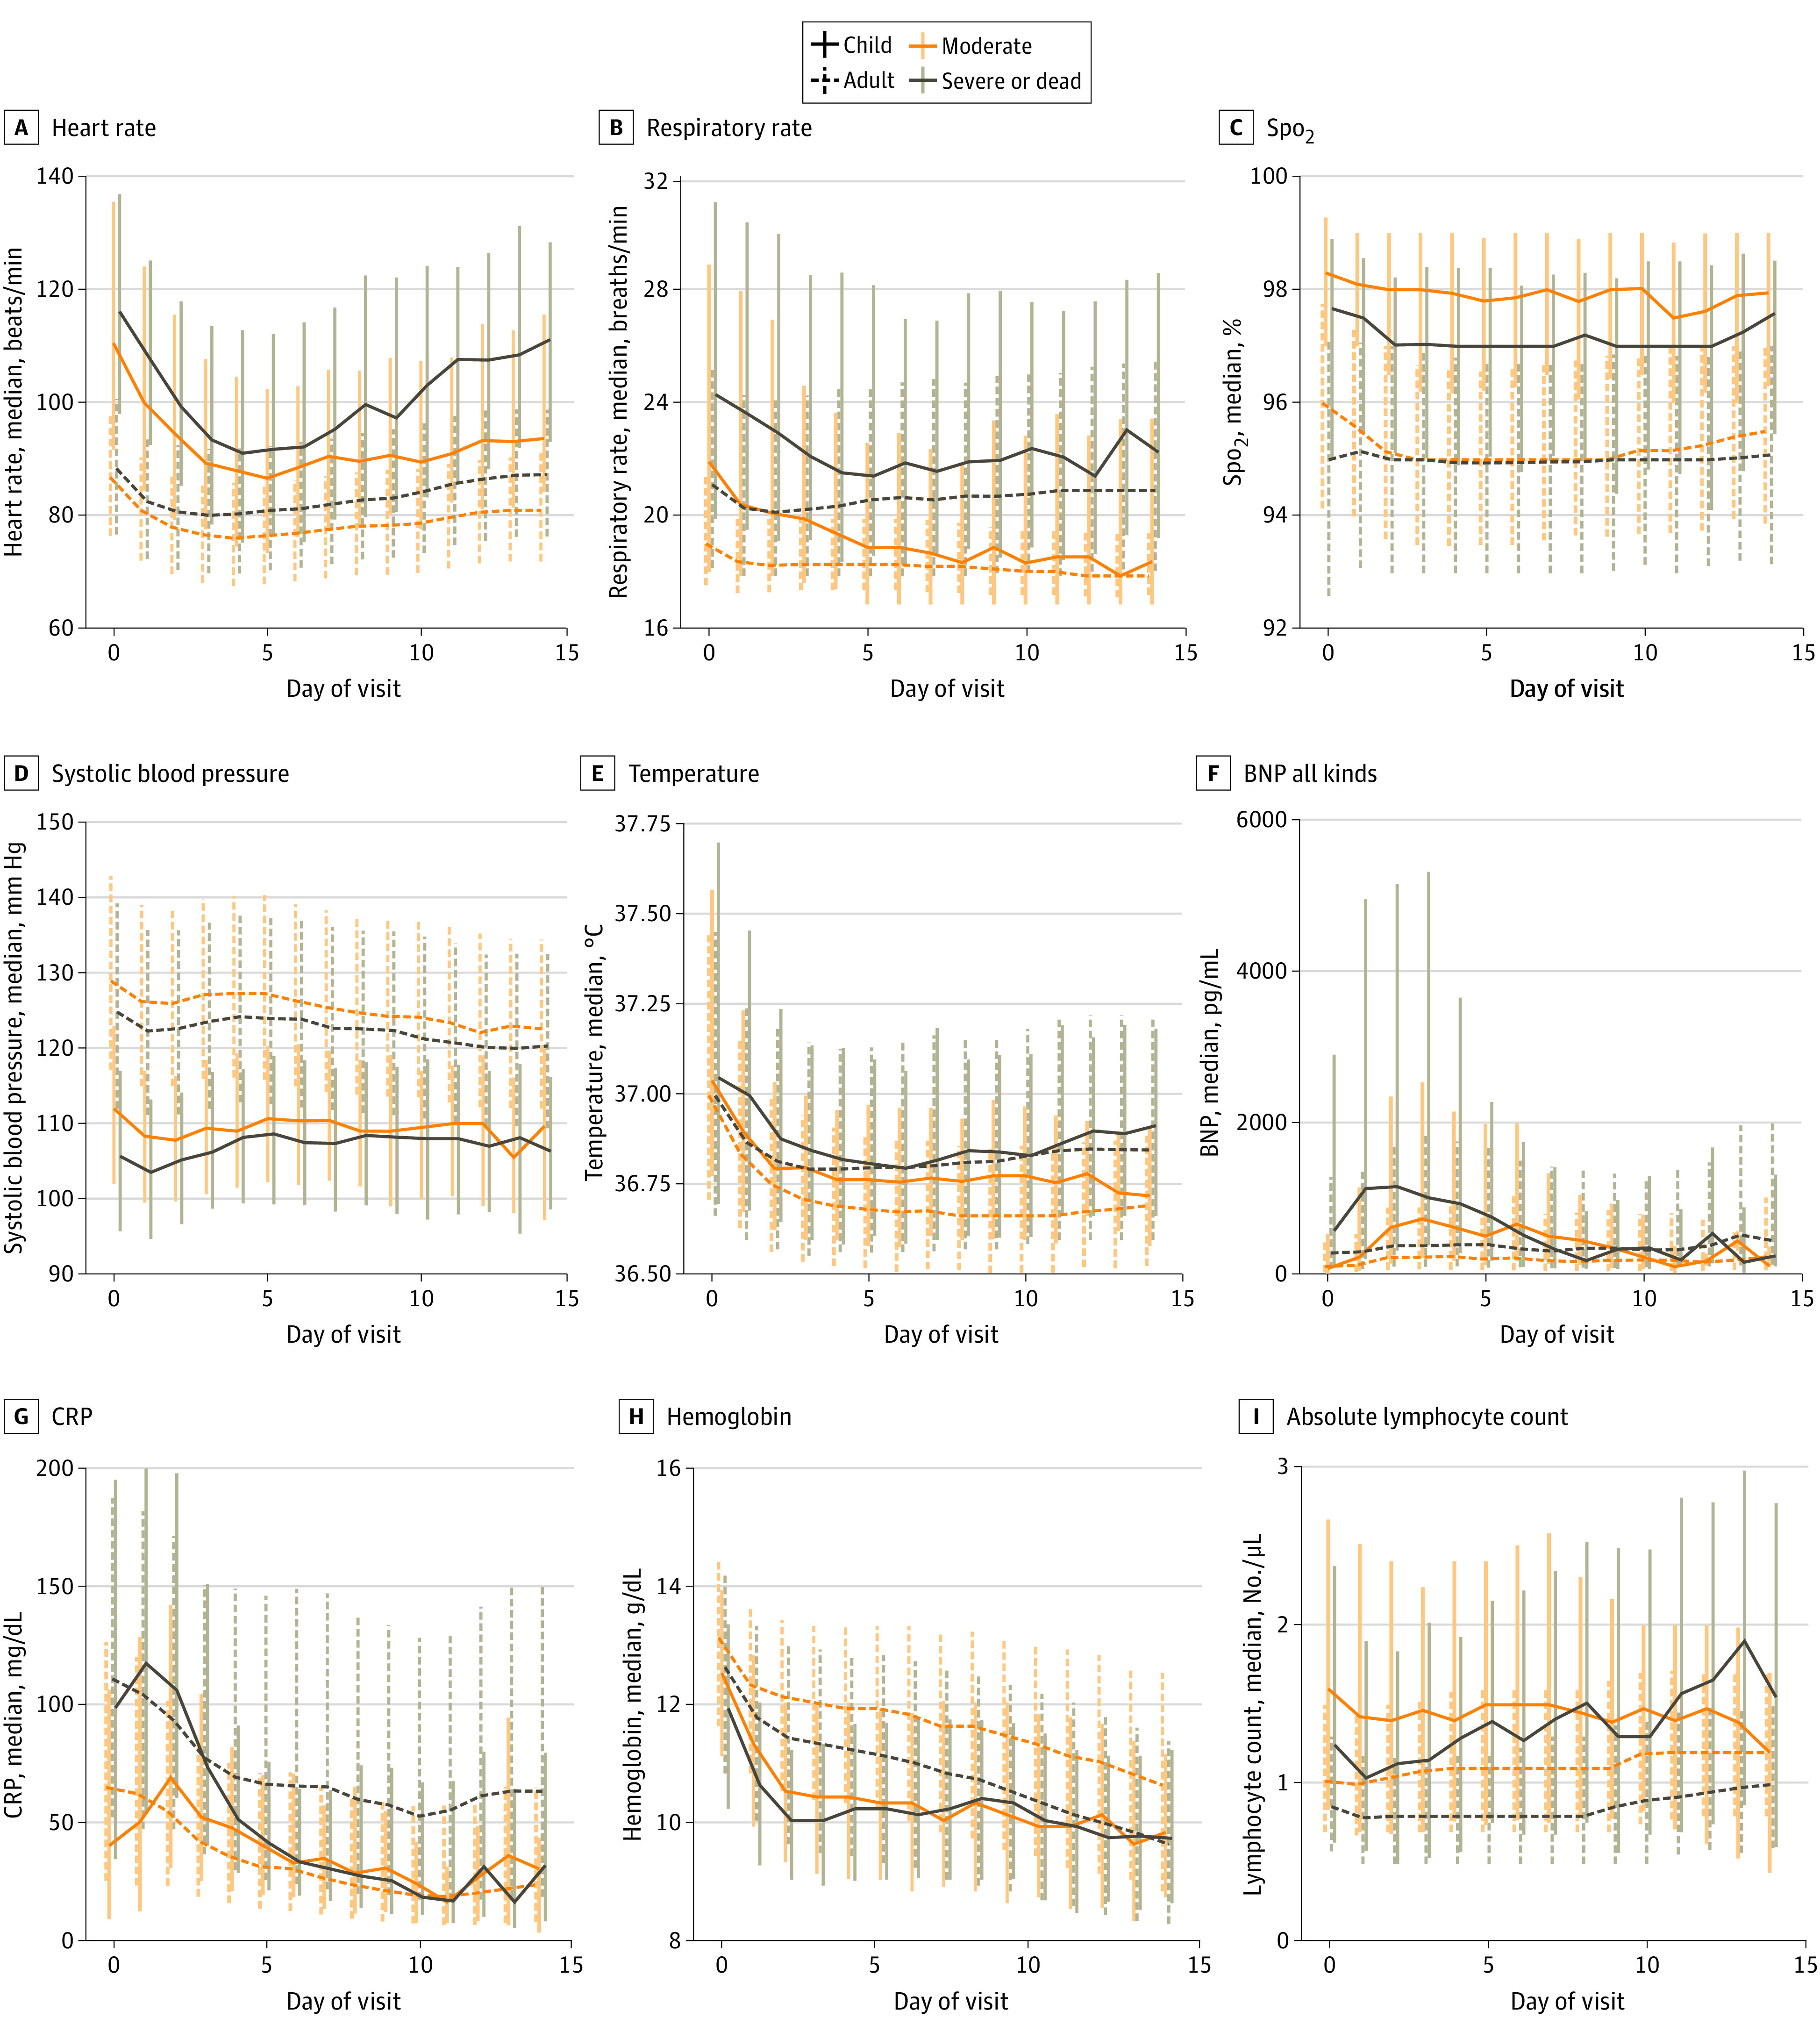
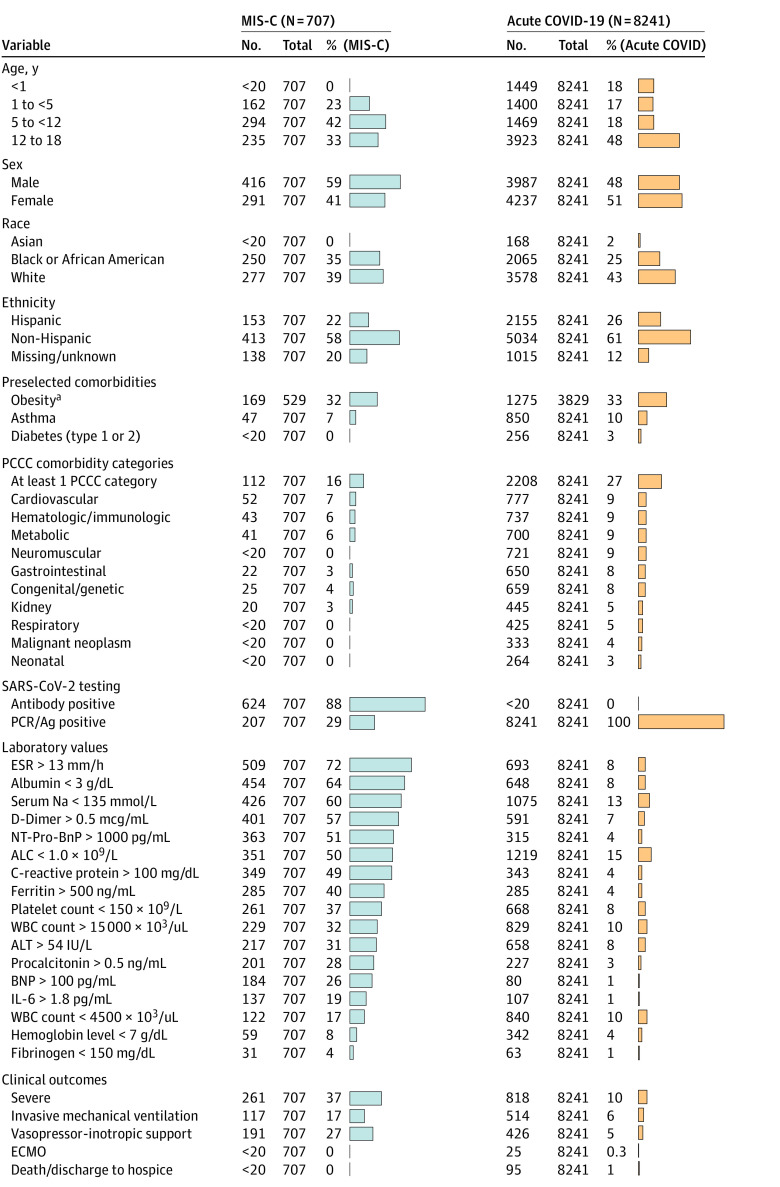
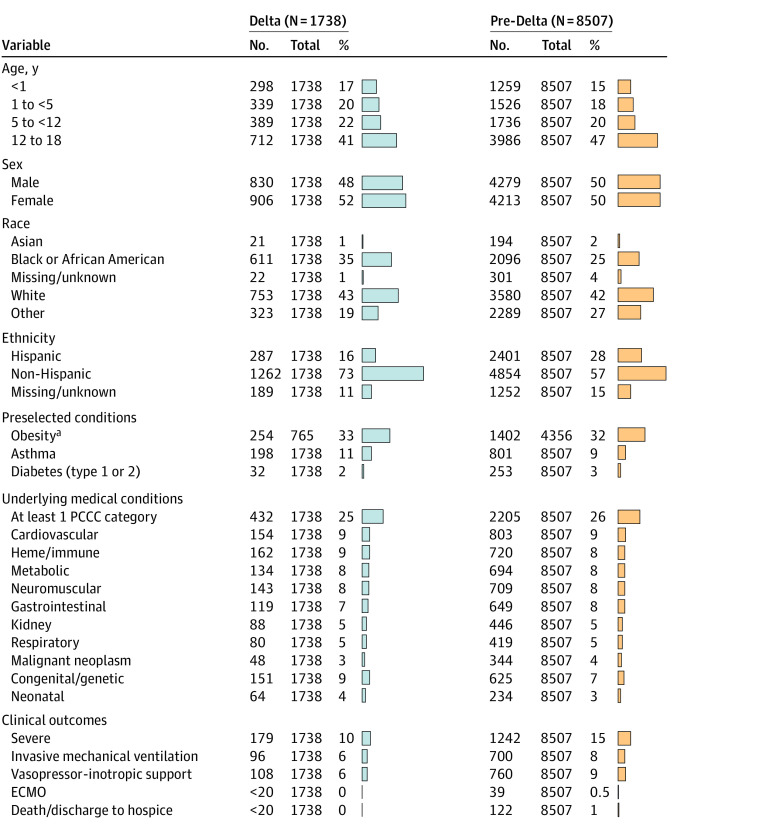
Results: A total of 1 068 410 children were tested for SARS-CoV-2 and 167 262 test results (15.6%) were positive (82 882 [49.6%] girls; median age, 11.9 [IQR, 6.0-16.1] years). Among the 10 245 children (6.1%) who were hospitalized, 1423 (13.9%) met the criteria for severe disease: mechanical ventilation (796 [7.8%]), vasopressor-inotropic support (868 [8.5%]), extracorporeal membrane oxygenation (42 [0.4%]), or death (131 [1.3%]). Male sex (odds ratio [OR], 1.37; 95% CI, 1.21-1.56), Black/African American race (OR, 1.25; 95% CI, 1.06-1.47), obesity (OR, 1.19; 95% CI, 1.01-1.41), and several pediatric complex chronic condition (PCCC) subcategories were associated with higher severity disease. Vital signs and many laboratory test values from the day of admission were predictive of peak disease severity. Variables associated with increased odds for MIS-C vs acute COVID-19 included male sex (OR, 1.59; 95% CI, 1.33-1.90), Black/African American race (OR, 1.44; 95% CI, 1.17-1.77), younger than 12 years (OR, 1.81; 95% CI, 1.51-2.18), obesity (OR, 1.76; 95% CI, 1.40-2.22), and not having a pediatric complex chronic condition (OR, 0.72; 95% CI, 0.65-0.80). The children with MIS-C had a more inflammatory laboratory profile and severe clinical phenotype, with higher rates of invasive ventilation (117 of 707 [16.5%] vs 514 of 8241 [6.2%]; P < .001) and need for vasoactive-inotropic support (191 of 707 [27.0%] vs 426 of 8241 [5.2%]; P < .001) compared with those who had acute COVID-19. Comparing children during the Delta vs pre-Delta eras, there was no significant change in hospitalization rate (1738 [6.0%] vs 8507 [6.2%]; P = .18) and lower odds for severe disease (179 [10.3%] vs 1242 [14.6%]) (decreased by a factor of 0.67; 95% CI, 0.57-0.79; P < .001).
Conclusions and relevance: In this cohort study of US children with SARS-CoV-2, there were observed differences in demographic characteristics, preexisting comorbidities, and initial vital sign and laboratory values between severity subgroups. Taken together, these results suggest that early identification of children likely to progress to severe disease could be achieved using readily available data elements from the day of admission. Further work is needed to translate this knowledge into improved outcomes.
Conflict of interest statement
Figures
Update of
-
Children with SARS-CoV-2 in the National COVID Cohort Collaborative (N3C).medRxiv [Preprint]. 2021 Jul 23:2021.07.19.21260767. doi: 10.1101/2021.07.19.21260767. medRxiv. 2021. Update in: JAMA Netw Open. 2022 Feb 1;5(2):e2143151. doi: 10.1001/jamanetworkopen.2021.43151. PMID: 34341796 Free PMC article. Updated. Preprint.
References
-
- Johns Hopkins University & Medicine. Coronavirus Research Center. COVID-19 dashboard. Johns Hopkins University. 2021. Accessed January 3, 2022. https://coronavirus.jhu.edu/map.html
Publication types
MeSH terms
Supplementary concepts
Grants and funding
- UL1 TR001998/TR/NCATS NIH HHS/United States
- UL1 TR002649/TR/NCATS NIH HHS/United States
- UL1 TR001420/TR/NCATS NIH HHS/United States
- UL1 TR003017/TR/NCATS NIH HHS/United States
- UL1 TR002736/TR/NCATS NIH HHS/United States
- UL1 TR002556/TR/NCATS NIH HHS/United States
- UL1 TR002553/TR/NCATS NIH HHS/United States
- UL1 TR001878/TR/NCATS NIH HHS/United States
- UL1 TR001872/TR/NCATS NIH HHS/United States
- UL1 TR001412/TR/NCATS NIH HHS/United States
- UL1 TR001449/TR/NCATS NIH HHS/United States
- UL1 TR002369/TR/NCATS NIH HHS/United States
- UL1 TR002537/TR/NCATS NIH HHS/United States
- UL1 TR002014/TR/NCATS NIH HHS/United States
- UL1 TR001425/TR/NCATS NIH HHS/United States
- UL1 TR002544/TR/NCATS NIH HHS/United States
- U54 GM115516/GM/NIGMS NIH HHS/United States
- UL1 TR002003/TR/NCATS NIH HHS/United States
- UL1 TR001876/TR/NCATS NIH HHS/United States
- UL1 TR002538/TR/NCATS NIH HHS/United States
- UL1 TR001430/TR/NCATS NIH HHS/United States
- UL1 TR001881/TR/NCATS NIH HHS/United States
- U54 GM115677/GM/NIGMS NIH HHS/United States
- UL1 TR003107/TR/NCATS NIH HHS/United States
- U54 GM115428/GM/NIGMS NIH HHS/United States
- UL1 TR003098/TR/NCATS NIH HHS/United States
- UL1 TR002378/TR/NCATS NIH HHS/United States
- UL1 TR002494/TR/NCATS NIH HHS/United States
- UL1 TR002645/TR/NCATS NIH HHS/United States
- UL1 TR002366/TR/NCATS NIH HHS/United States
- UL1 TR002377/TR/NCATS NIH HHS/United States
- U54 GM115458/GM/NIGMS NIH HHS/United States
- UL1 TR002733/TR/NCATS NIH HHS/United States
- UL1 TR002550/TR/NCATS NIH HHS/United States
- UL1 TR001439/TR/NCATS NIH HHS/United States
- UL1 TR003096/TR/NCATS NIH HHS/United States
- UL1 TR002529/TR/NCATS NIH HHS/United States
- UL1 TR001855/TR/NCATS NIH HHS/United States
- UL1 TR002319/TR/NCATS NIH HHS/United States
- U54 GM104941/GM/NIGMS NIH HHS/United States
- UL1 TR002389/TR/NCATS NIH HHS/United States
- UL1 TR002384/TR/NCATS NIH HHS/United States
- UL1 TR001866/TR/NCATS NIH HHS/United States
- UL1 TR003015/TR/NCATS NIH HHS/United States
- UL1 TR001450/TR/NCATS NIH HHS/United States
- UL1 TR003167/TR/NCATS NIH HHS/United States
- UL1 TR002243/TR/NCATS NIH HHS/United States
LinkOut - more resources
Full Text Sources
Medical
Miscellaneous
