

Adapting to the algorithm: how accuracy comparisons promote the use of a decision aid
- PMID: 35133521
- PMCID: PMC8825899
- DOI: 10.1186/s41235-022-00364-y
Adapting to the algorithm: how accuracy comparisons promote the use of a decision aid
Abstract
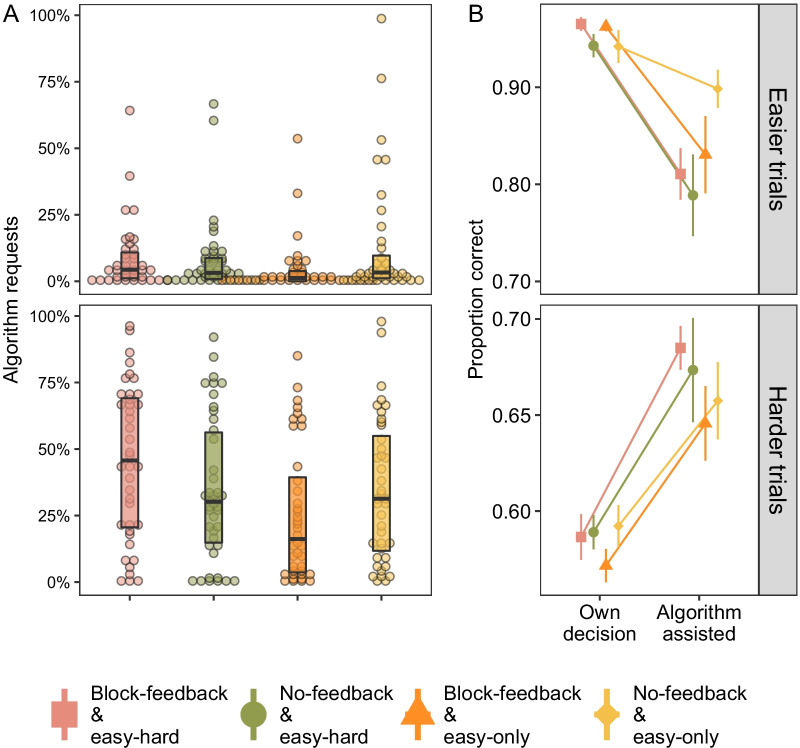
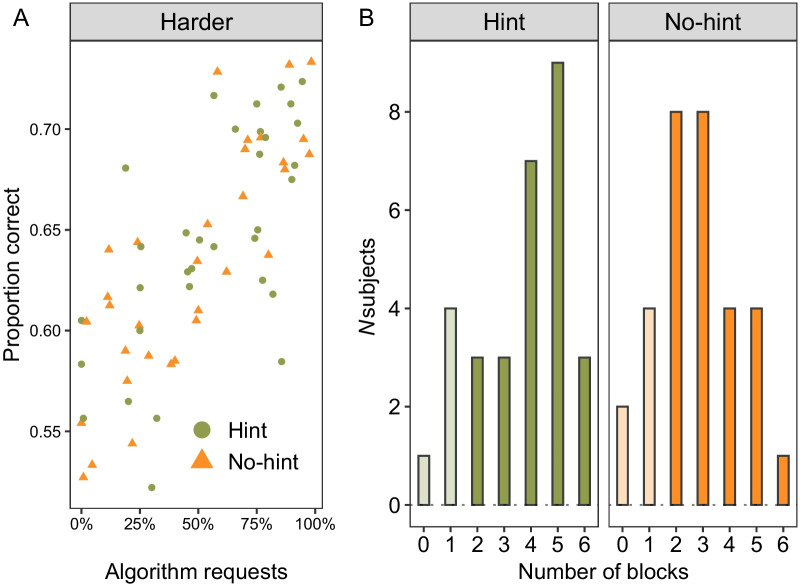
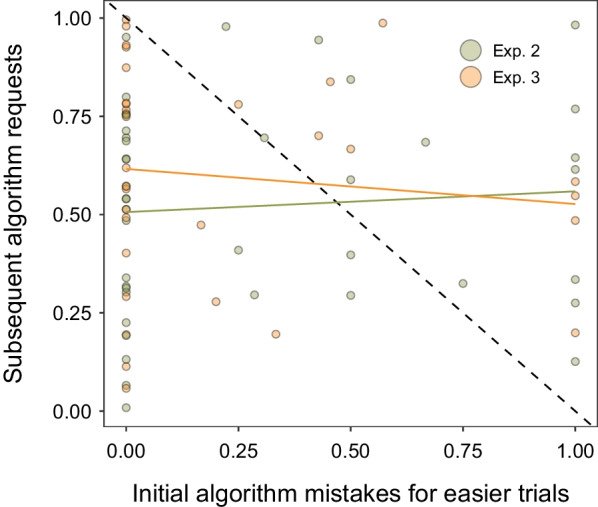
In three experiments, we sought to understand when and why people use an algorithm decision aid. Distinct from recent approaches, we explicitly enumerate the algorithm's accuracy while also providing summary feedback and training that allowed participants to assess their own skills. Our results highlight that such direct performance comparisons between the algorithm and the individual encourages a strategy of selective reliance on the decision aid; individuals ignored the algorithm when the task was easier and relied on the algorithm when the task was harder. Our systematic investigation of summary feedback, training experience, and strategy hint manipulations shows that further opportunities to learn about the algorithm encourage not only increased reliance on the algorithm but also engagement in experimentation and verification of its recommendations. Together, our findings emphasize the decision-maker's capacity to learn about the algorithm providing insights for how we can improve the use of decision aids.
Keywords: Algorithm; Decision aid; Feedback.
© 2022. The Author(s).
Conflict of interest statement
The authors have no competing interests to declare.
Figures


Similar articles
-
Age-related differences in reliance behavior attributable to costs within a human-decision aid system.Hum Factors. 2008 Dec;50(6):853-63. doi: 10.1518/001872008X375018. Hum Factors. 2008. PMID: 19292009
-
Decision manifolds--a supervised learning algorithm based on self-organization.IEEE Trans Neural Netw. 2008 Sep;19(9):1518-30. doi: 10.1109/TNN.2008.2000449. IEEE Trans Neural Netw. 2008. PMID: 18779085
-
Learning of a Decision-Maker's Preference Zone With an Evolutionary Approach.IEEE Trans Neural Netw Learn Syst. 2019 Mar;30(3):670-682. doi: 10.1109/TNNLS.2018.2847412. Epub 2018 Jul 24. IEEE Trans Neural Netw Learn Syst. 2019. PMID: 30047902
-
Student and educator experiences of maternal-child simulation-based learning: a systematic review of qualitative evidence protocol.JBI Database System Rev Implement Rep. 2015 Jan;13(1):14-26. doi: 10.11124/jbisrir-2015-1694. JBI Database System Rev Implement Rep. 2015. PMID: 26447004
-
Teaching Autistic Adolescents and Young Adults to Drive: Perspectives of Specialized Driving Instructors.Autism Adulthood. 2019 Sep 1;1(3):202-209. doi: 10.1089/aut.2018.0054. Epub 2019 Sep 11. Autism Adulthood. 2019. PMID: 32292888 Free PMC article.
Cited by
-
How human-AI feedback loops alter human perceptual, emotional and social judgements.Nat Hum Behav. 2025 Feb;9(2):345-359. doi: 10.1038/s41562-024-02077-2. Epub 2024 Dec 18. Nat Hum Behav. 2025. PMID: 39695250 Free PMC article.
-
Assessment and management of chronic insomnia disorder: an algorithm for primary care physicians.BMC Prim Care. 2024 Apr 26;25(1):138. doi: 10.1186/s12875-024-02381-w. BMC Prim Care. 2024. PMID: 38671358 Free PMC article.
-
When combinations of humans and AI are useful: A systematic review and meta-analysis.Nat Hum Behav. 2024 Dec;8(12):2293-2303. doi: 10.1038/s41562-024-02024-1. Epub 2024 Oct 28. Nat Hum Behav. 2024. PMID: 39468277 Free PMC article.
-
Evaluation of the Impact of ChatGPT on the Selection of Surgical Technique in Bariatric Surgery.Obes Surg. 2025 Jan;35(1):19-24. doi: 10.1007/s11695-024-07279-1. Epub 2024 May 17. Obes Surg. 2025. PMID: 38760650
-
Three Challenges for AI-Assisted Decision-Making.Perspect Psychol Sci. 2024 Sep;19(5):722-734. doi: 10.1177/17456916231181102. Epub 2023 Jul 13. Perspect Psychol Sci. 2024. PMID: 37439761 Free PMC article.
References
-
- Arkes HR, Blumer C. The psychology of sunk cost. Organizational Behavior and Human Decision Processes. 1985;35:124–140. doi: 10.1016/0749-5978(85)90049-4. - DOI
-
- Arkes HR, Christensen C, Lai C, Blumer C. Two methods of reducing overconfidence. Organizational Behavior and Human Decision Processes. 1987;39:133–144. doi: 10.1016/0749-5978(87)90049-5. - DOI
-
- Arkes HR, Dawes RM, Christensen C. Factors influencing the use of a decision rule in a probabilistic task. Organizational Behavior and Human Decision Processes. 1986;37:93–110. doi: 10.1016/0749-5978(86)90046-4. - DOI
Publication types
MeSH terms
LinkOut - more resources
Full Text Sources