

Emerging Vaccine-Breakthrough SARS-CoV-2 Variants
- PMID: 35133792
- PMCID: PMC8848511
- DOI: 10.1021/acsinfecdis.1c00557
Emerging Vaccine-Breakthrough SARS-CoV-2 Variants
Abstract
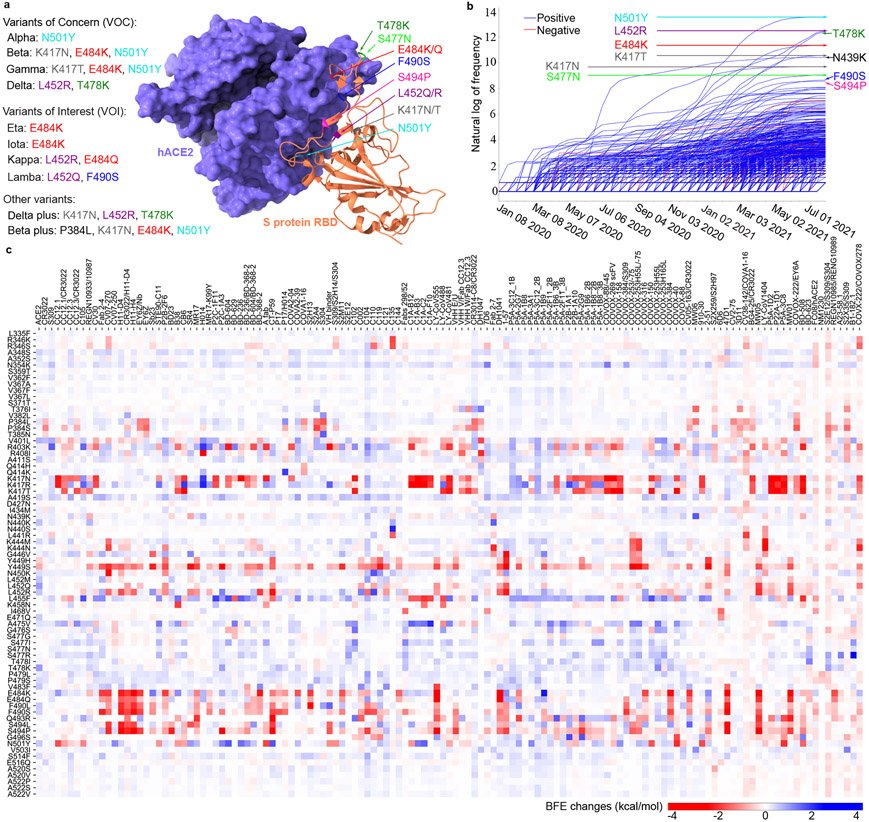
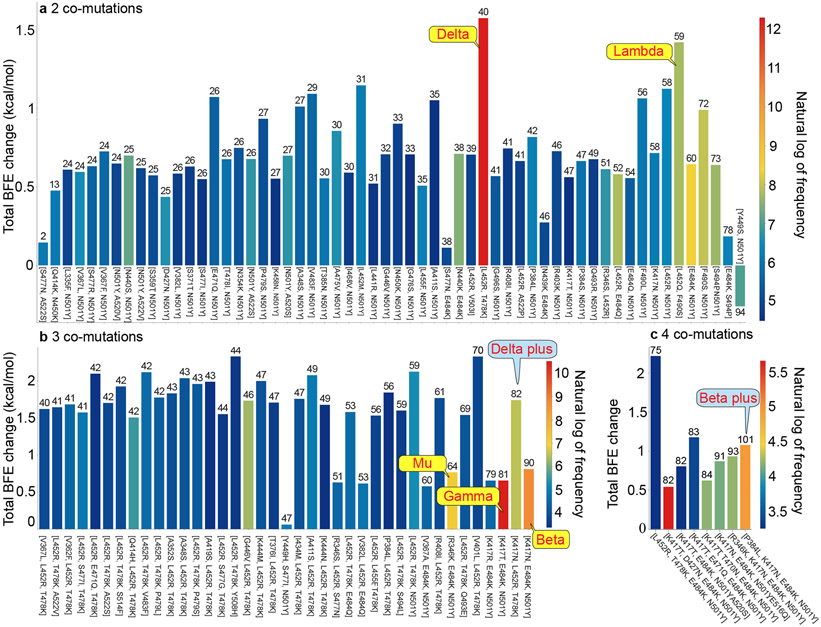
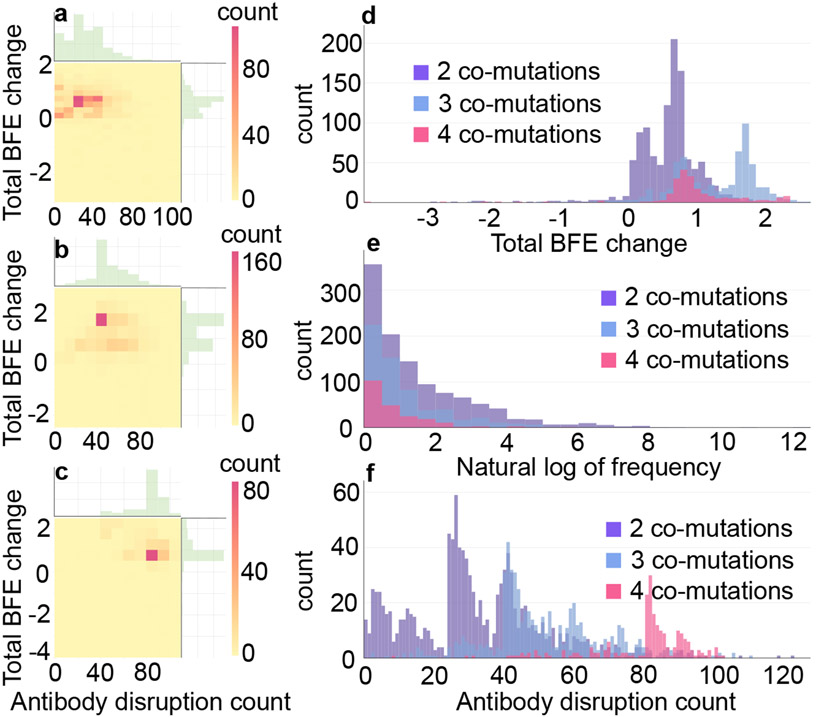
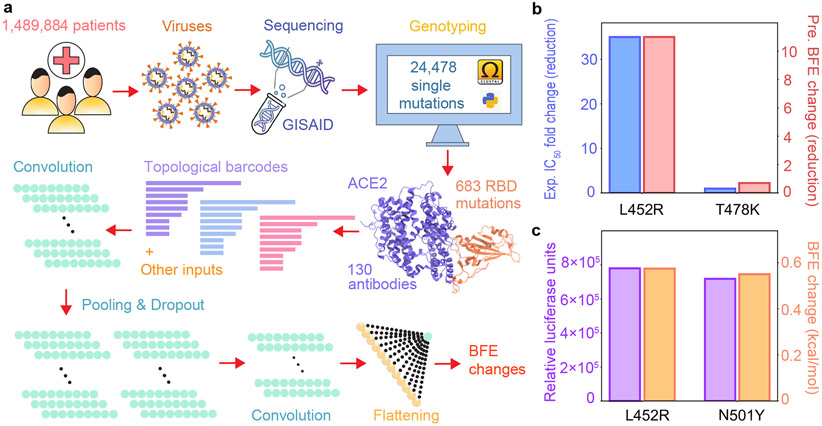
The surge of COVID-19 infections has been fueled by new SARS-CoV-2 variants, namely Alpha, Beta, Gamma, Delta, and so forth. The molecular mechanism underlying such surge is elusive due to the existence of 28 554 unique mutations, including 4 653 non-degenerate mutations on the spike protein. Understanding the molecular mechanism of SARS-CoV-2 transmission and evolution is a prerequisite to foresee the trend of emerging vaccine-breakthrough variants and the design of mutation-proof vaccines and monoclonal antibodies. We integrate the genotyping of 1 489 884 SARS-CoV-2 genomes, a library of 130 human antibodies, tens of thousands of mutational data, topological data analysis, and deep learning to reveal SARS-CoV-2 evolution mechanism and forecast emerging vaccine-breakthrough variants. We show that prevailing variants can be quantitatively explained by infectivity-strengthening and vaccine-escape (co-)mutations on the spike protein RBD due to natural selection and/or vaccination-induced evolutionary pressure. We illustrate that infectivity strengthening mutations were the main mechanism for viral evolution, while vaccine-escape mutations become a dominating viral evolutionary mechanism among highly vaccinated populations. We demonstrate that Lambda is as infectious as Delta but is more vaccine-resistant. We analyze emerging vaccine-breakthrough comutations in highly vaccinated countries, including the United Kingdom, the United States, Denmark, and so forth. Finally, we identify sets of comutations that have a high likelihood of massive growth: [A411S, L452R, T478K], [L452R, T478K, N501Y], [V401L, L452R, T478K], [K417N, L452R, T478K], [L452R, T478K, E484K, N501Y], and [P384L, K417N, E484K, N501Y]. We predict they can escape existing vaccines. We foresee an urgent need to develop new virus combating strategies.
Keywords: COVID-19; SARS-CoV-2; comutations; infectivity; vaccine-breakthrough; vaccine-resistant.
Figures
Update of
-
Emerging vaccine-breakthrough SARS-CoV-2 variants.ArXiv [Preprint]. 2021 Sep 9:arXiv:2109.04509v1. ArXiv. 2021. Update in: ACS Infect Dis. 2022 Mar 11;8(3):546-556. doi: 10.1021/acsinfecdis.1c00557. PMID: 34518803 Free PMC article. Updated. Preprint.
Similar articles
-
Emerging vaccine-breakthrough SARS-CoV-2 variants.ArXiv [Preprint]. 2021 Sep 9:arXiv:2109.04509v1. ArXiv. 2021. Update in: ACS Infect Dis. 2022 Mar 11;8(3):546-556. doi: 10.1021/acsinfecdis.1c00557. PMID: 34518803 Free PMC article. Updated. Preprint.
-
Review of the mechanisms of SARS-CoV-2 evolution and transmission.ArXiv [Preprint]. 2021 Sep 15:arXiv:2109.08148v1. ArXiv. 2021. PMID: 34545334 Free PMC article. Preprint.
-
Vaccine-escape and fast-growing mutations in the United Kingdom, the United States, Singapore, Spain, India, and other COVID-19-devastated countries.Genomics. 2021 Jul;113(4):2158-2170. doi: 10.1016/j.ygeno.2021.05.006. Epub 2021 May 15. Genomics. 2021. PMID: 34004284 Free PMC article.
-
Physicochemical effect of the N501Y, E484K/Q, K417N/T, L452R and T478K mutations on the SARS-CoV-2 spike protein RBD and its influence on agent fitness and on attributes developed by emerging variants of concern.Virology. 2022 Jul;572:44-54. doi: 10.1016/j.virol.2022.05.003. Epub 2022 May 12. Virology. 2022. PMID: 35580380 Free PMC article. Review.
-
The Development of SARS-CoV-2 Variants: The Gene Makes the Disease.J Dev Biol. 2021 Dec 15;9(4):58. doi: 10.3390/jdb9040058. J Dev Biol. 2021. PMID: 34940505 Free PMC article. Review.
Cited by
-
Control and challenge of COVID-19: lessons from China's experience.Am J Physiol Lung Cell Mol Physiol. 2021 Nov 1;321(5):L958-L959. doi: 10.1152/ajplung.00412.2021. Epub 2021 Oct 13. Am J Physiol Lung Cell Mol Physiol. 2021. PMID: 34643094 Free PMC article. No abstract available.
-
SARS2Mutant: SARS-CoV-2 amino-acid mutation atlas database.NAR Genom Bioinform. 2023 Apr 24;5(2):lqad037. doi: 10.1093/nargab/lqad037. eCollection 2023 Jun. NAR Genom Bioinform. 2023. PMID: 37101659 Free PMC article.
-
Preventing future zoonosis: SARS-CoV-2 mutations enhance human-animal cross-transmission.Comput Biol Med. 2024 Nov;182:109101. doi: 10.1016/j.compbiomed.2024.109101. Epub 2024 Sep 6. Comput Biol Med. 2024. PMID: 39243518
-
The global succinylation of SARS-CoV-2-infected host cells reveals drug targets.Proc Natl Acad Sci U S A. 2022 Jul 26;119(30):e2123065119. doi: 10.1073/pnas.2123065119. Epub 2022 Jul 12. Proc Natl Acad Sci U S A. 2022. PMID: 35858407 Free PMC article.
-
SARS-CoV-2 protein structure and sequence mutations: Evolutionary analysis and effects on virus variants.PLoS One. 2023 Jul 20;18(7):e0283400. doi: 10.1371/journal.pone.0283400. eCollection 2023. PLoS One. 2023. PMID: 37471335 Free PMC article.
References
-
- Li W; Shi Z; Yu M; Ren W; Smith C; Epstein JH; Wang H; Crameri G; Hu Z; Zhang H Bats are natural reservoirs of SARS-like coronaviruses. Science 2005, 310, 676–679. - PubMed
-
- Qu X-X; Hao P; Song X-J; Jiang S-M; Liu Y-X; Wang P-G; Rao X; Song H-D; Wang S-Y; Zuo Y Identification of two critical amino acid residues of the severe acute respiratory syndrome coronavirus spike protein for its variation in zoonotic tropism transition via a double substitution strategy. Journal of Biological Chemistry 2005, 280, 29588–29595. - PMC - PubMed
Grants and funding
LinkOut - more resources
Full Text Sources
Other Literature Sources
Miscellaneous
