. 2022 Apr 1;132(7):e147719.
doi: 10.1172/JCI147719.

Single-cell RNA sequencing reveals induction of distinct trained-immunity programs in human monocytes

Affiliations

Single-cell RNA sequencing reveals induction of distinct trained-immunity programs in human monocytes

Bowen Zhang et al. J Clin Invest. .

Abstract

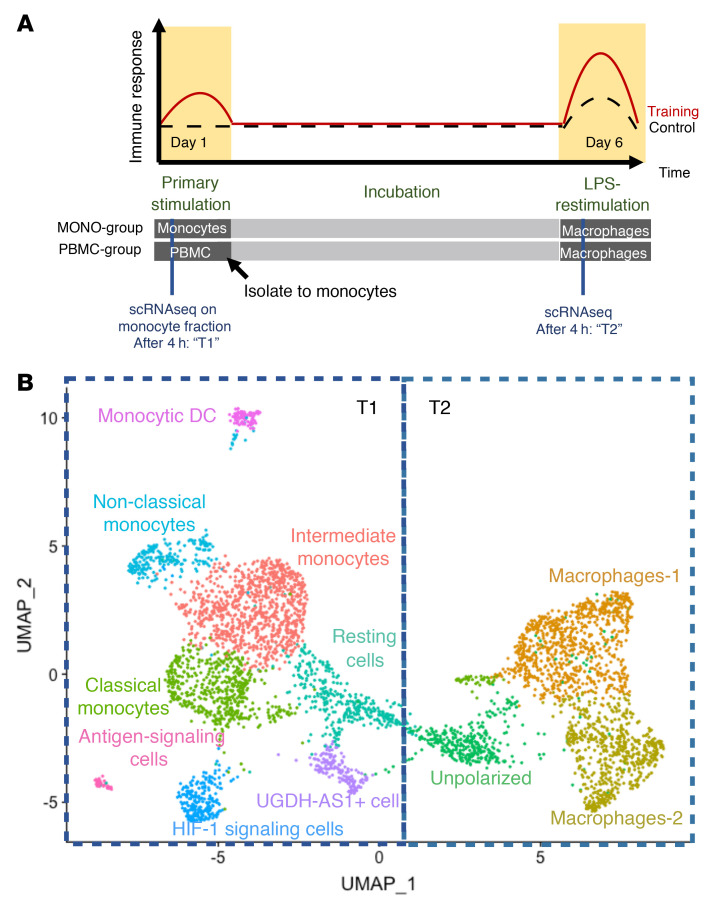
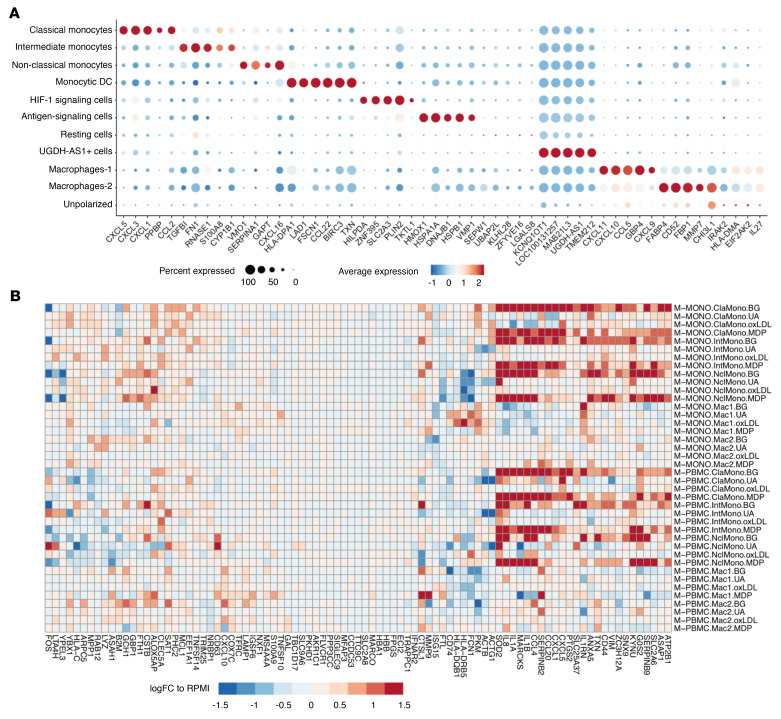
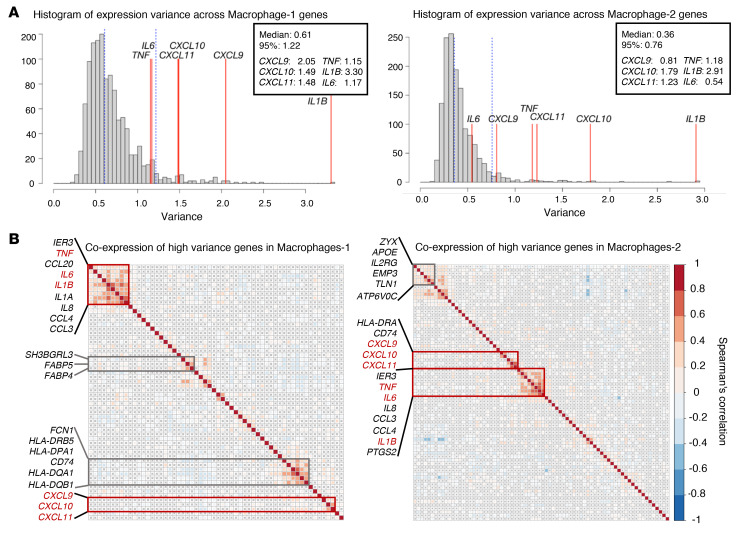
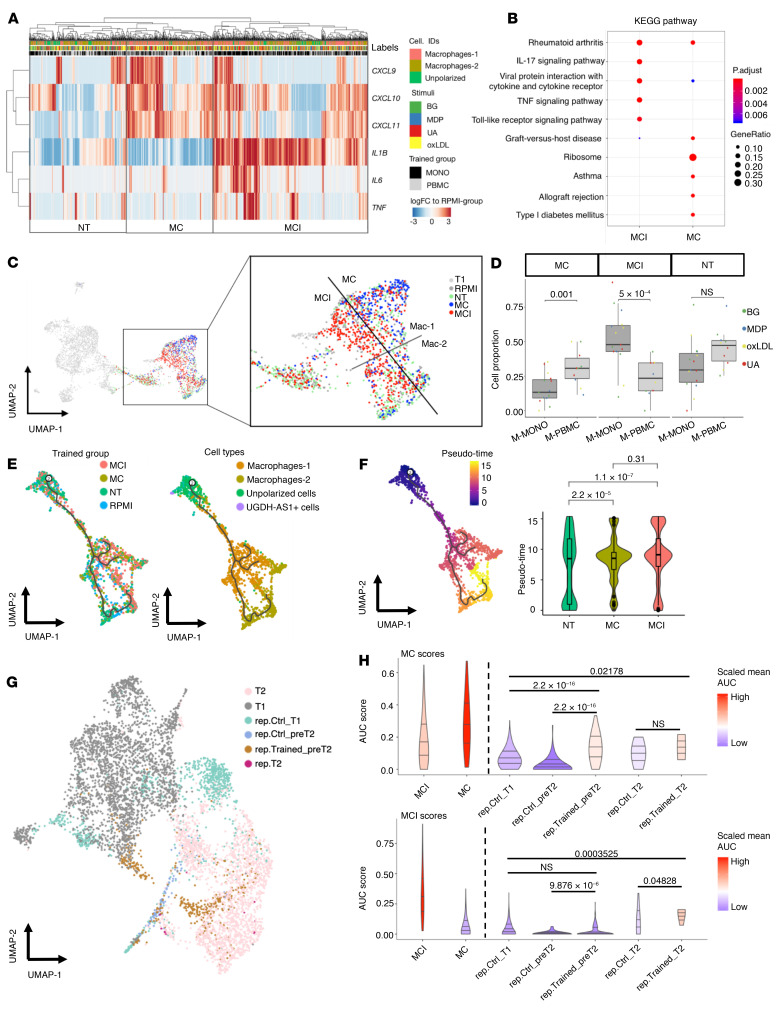
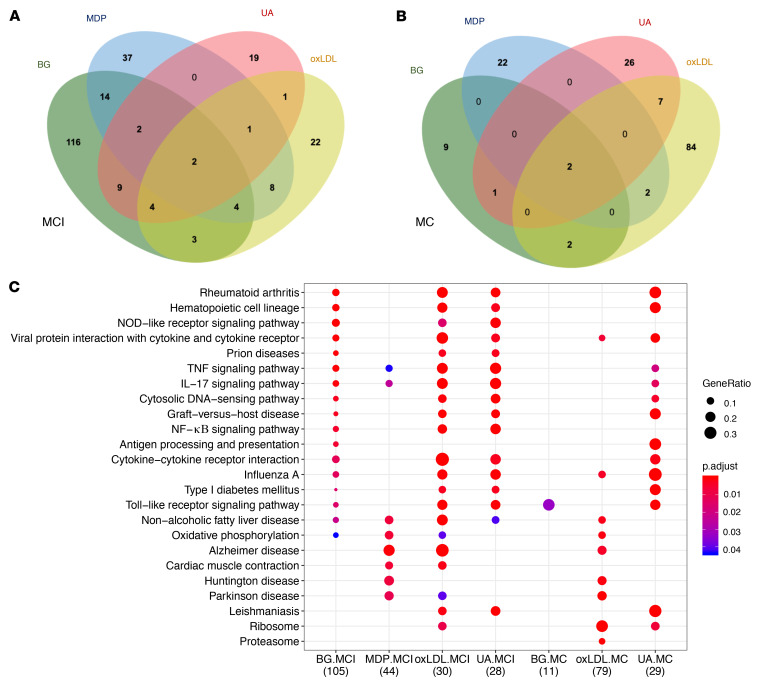
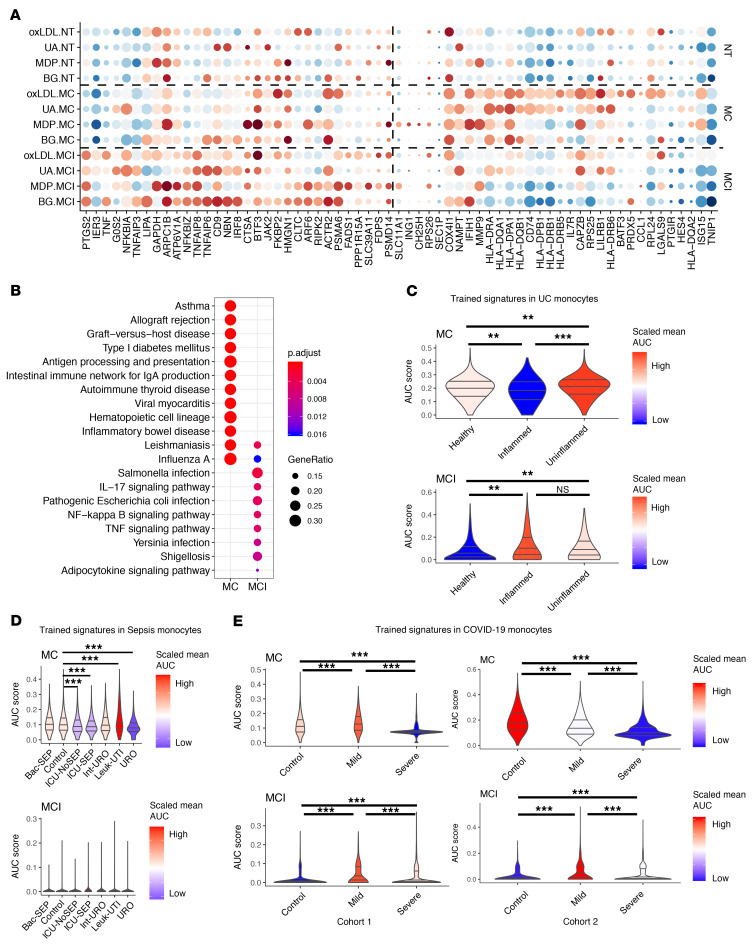
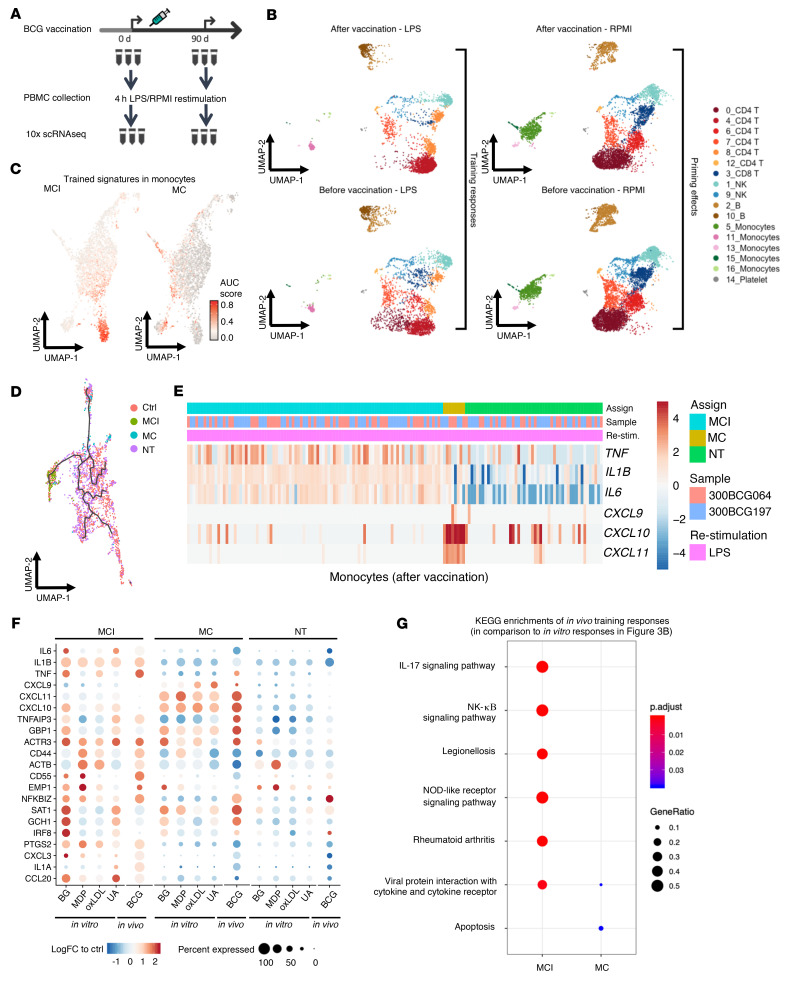
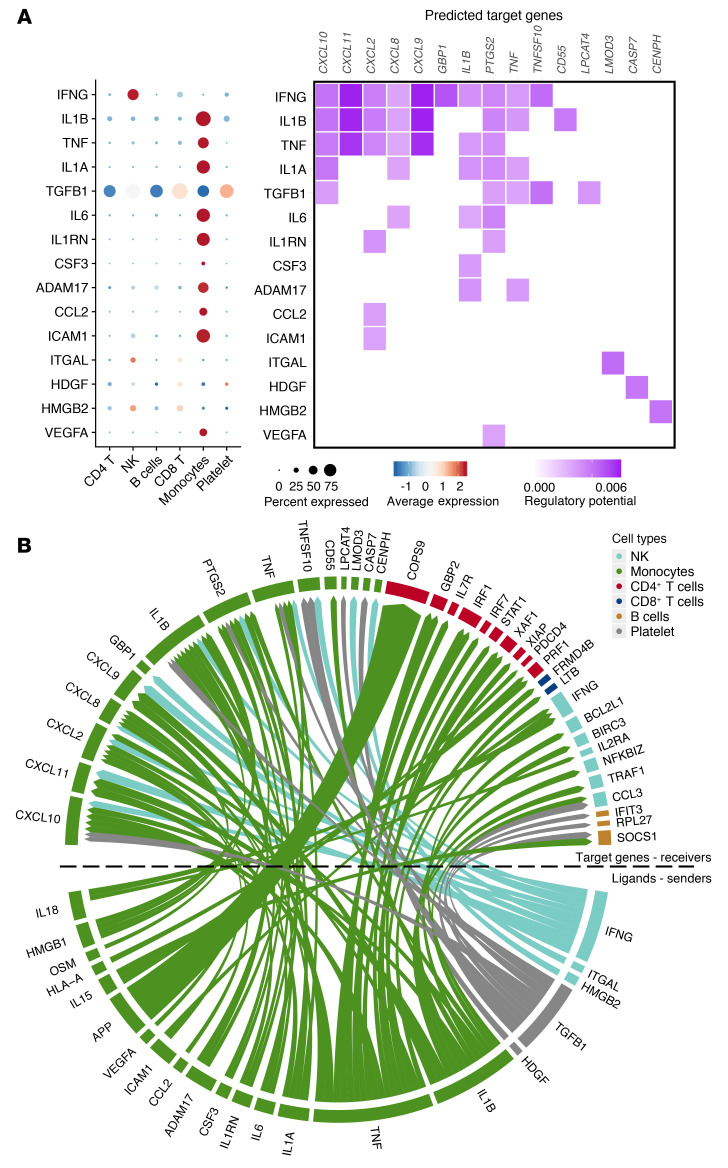
Trained immunity refers to the long-lasting memory traits of innate immunity. Recent studies have shown that trained immunity is orchestrated by sustained changes in epigenetic marks and metabolic pathways, leading to an altered transcriptional response to a second challenge. However, the potential heterogeneity of trained-immunity induction in innate immune cells has not been explored. In this study, we demonstrate cellular transcriptional programs in response to 4 different inducers of trained immunity in monocyte populations at single-cell resolution. Specifically, we identified 3 monocyte subpopulations upon the induction of trained immunity, and replicated these findings in an in vivo study. In addition, we found gene signatures consistent with these functional programs in patients with ulcerative colitis, sepsis, and COVID-19, suggesting the impact of trained-immunity programs in immune-mediated diseases.

Keywords: Immunology; Infectious disease; Innate immunity; Macrophages; Monocytes.


Figures

Figure 1
Figure 1. Single-cell expression atlas and cluster annotations in monocytes and macrophages of training and control samples.
(A) Study design. Monocytes (M-MONO) and PBMCs (M-PBMC) were isolated and incubated in vitro with culture medium (RPMI, negative control), β-glucan (BG), uric acid (UA), oxidized low-density lipoprotein (oxLDL), and muramyl dipeptide (MDP) for 24 hours. After a 4-hour stimulation, cells were isolated for scRNA-seq (T1). On day 6, cells were restimulated with LPS for 4 hours and then isolated for scRNA-seq (T2). M-MONO, monocytes trained in the absence of lymphocytes; M-PBMC, monocytes trained in the presence of lymphocytes. (B) UMAP of cells from RPMI control and training conditions. Cells are colored by unsupervised clusters, with corresponding cell type annotated based on known cell-type-specific marker genes.
Figure 2
Figure 2. Differentially expressed genes identified in monocytes and macrophages of training and control samples.
(A) Dot heatmap shows the top 5 differentially expressed genes (DEGs) in each cluster. DEGs were obtained by comparing expression level in cells of one cluster to that in the rest of cells. (B) Average log(fold change) relative to RPMI controls of each group across 3 monocytes and 2 macrophages. ClaMono, classical monocytes; IntMono, intermediate monocytes; NclMono, nonclassical monocytes; Mac1, Macrophages-1; Mac2, Macrophages-2.
Figure 3
Figure 3. Heterogeneous trained-immunity effect in terms of expression of marker genes among macrophages at T2.
(A) Distribution of the variation of trained immunity (TI) marker gene expression across macrophages with that of other genes (with expression level log[TP10K + 1] > 0.5). (B) Coexpression correlation of TI marker genes and other top 5% high-variance genes in 2 macrophage clusters. TI marker genes are highlighted in red. Red and blue squares in heatmap correspond to significant (Spearman’s P < 0.05) positive and negative correlation, respectively; gray cross indicates not significant.
Figure 4
Figure 4. Subgroups of trained cells reveal diverse trained-immunity phenotypes.
(A) Heatmap showing log(fold change) of 6 marker genes (rows) in trained macrophages relative to the average expression in control macrophages (columns). Red and blue colors correspond to upregulation and downregulation, respectively. (B) KEGG enrichment of training response (TR) genes (comparing trained conditions with RPMI controls) in each subgroup of trained cells. (C) Annotation of the subgroups of trained cells in UMAP plots. (D) Comparison of the cell frequency of subgroups between trained tissues. M-MONO, monocytes trained in the absence of lymphocytes; M-PBMC, monocytes trained in the presence of lymphocytes. Dirichlet’s regression model was applied to test the differences in cell frequency between groups; P values are shown on the box-and-whisker plot. (E) UMAP of cellular trajectories inferred by Monocle 3 with trained subgroups or original clusters. (F) UMAP and violin plot of pseudo-time state of trained cells estimated by Monocle 3. P values from Wilcoxon’s rank-sum test are shown on the violin plot. (G) Integrated UMAP of cells from the initial and replicate in vitro experiments showing the distribution of cells sampled at different time points. (H) Violin plots showing AUCell-based scores (R/AUCell package) of trained-immunity signatures from MCI and MC subgroups in trained cells and nontrained controls sampled from the replicate experiment. The lines in the violin plots represent the median of the AUC scores and the 0.25 and 0.75 quantiles, and colors represent the average scores centered on zero. Wilcoxon’s rank-sum test was applied to ascertain whether the AUC scores in trained cells were larger than in nontrained controls. T1, 4 hours after training (or RPMI) stimulation; pre-T2, 5 days after training (or RPMI) stimulation and before LPS restimulation; T2, 4 hours after LPS restimulation. P values are shown at the top in D, F, and H.
Figure 5
Figure 5. Gene signatures found in trained subgroups.
(A) Venn diagram showing the number of training response (TR) genes found in MCI (A) and MC (B) across the different inducers of trained immunity. (B) Dot plot showing the KEGG enrichment of TR genes found in MCI/MC across the different inducers of trained immunity.
Figure 6
Figure 6. Expression of trained-immunity signatures in infectious diseases.
(A) Dot heatmap of training response (TR) genes around GWAS-risk loci of inflammatory bowel disease (IBD). DEGs found in MCI/MC across different stimuli were enriched in genes 250 kbp around GWAS-risk loci of IBD in comparison to genes 250 kbp around height-associated loci (Fisher’s exact test, P = 0.0025). (B) KEGG enrichment of TR genes around GWAS-risk loci of IBD/ulcerative colitis (UC). (C–E) Trained-immunity signatures in monocyte clusters of patients with UC (C), sepsis (D), and COVID-19 (E). The scRNA-seq data sets used for panels C–E are from Smillie et al. (25), Reyes et al. (26), and Schulte-Schrepping et al. (27), respectively. The lines in the violin plots represent the median of the respective AUC scores (R/AUCell package) and the 0.25 and 0.75 quantiles, while colors in the violin plots represent the average AUC scores centered on zero. Wilcoxon’s rank-sum test was applied to compare the AUC scores between clinical conditions recorded in each study. **P < 1 × 10⁻⁵; ***P < 1 × 10⁻¹⁰.
Figure 7
Figure 7. In vivo validation of trained-immunity signatures.
(A) Study design. Healthy human volunteers (n = 3) were vaccinated with BCG. Before vaccination and 90 days later, PBMCs were isolated and restimulated ex vivo with RPMI culture medium (control) or LPS. (B) UMAP of PBMCs showing cells before and after BCG vaccination, with or without LPS restimulation from the in vivo study. (C) UMAP of AUC scores in monocytes after BCG vaccination. (D) UMAP of cell trajectory of monocytes after BCG vaccination, annotated by assigned trained subgroups. (E) Heatmap showing log(fold change) of 6 marker genes (rows) in monocytes 90 days after BCG vaccination (column) relative to the average expression before vaccination. Red and blue colors correspond to upregulation and downregulation, respectively. (F) Dot heatmap of expression of shared training response (TR) genes detected in LPS-restimulated cells from trained subgroups in both in vivo and in vitro training experiments. Gene expression is shown as log(fold change) relative to the average of RPMI control groups in the in vitro study, and relative to time point before vaccination for the in vivo study. (G) KEGG enrichment of TR genes of the in vivo study in each subgroup of trained cells.
Figure 8
Figure 8. Cell-cell interaction in inducing the trained-immunity transcriptional responses.
(A) Dot heatmap of the top 15 predicted ligands and heatmap of respective target genes regulated by top-ranked ligands. (B) A circos plot shows the predicted top ligands from sender cells and their target genes from different receiver cells.

Comment in

Similar articles

Cited by

References

    1. Netea MG, et al. Trained immunity: a program of innate immune memory in health and disease. Science. 2016;352(6284):aaf1098. doi: 10.1126/science.aaf1098. - DOI - PMC - PubMed
    1. Gonzalez-Perez M, et al. The BCG vaccine for COVID-19: first verdict and future directions. Front Immunol. 2021;12:632478. doi: 10.3389/fimmu.2021.632478. - DOI - PMC - PubMed
    1. Arts RJ, et al. Immunometabolic pathways in BCG-induced trained immunity. Cell Rep. 2016;17(10):2562–2571. doi: 10.1016/j.celrep.2016.11.011. - DOI - PMC - PubMed
    1. Cheng SC, et al. mTOR-and HIF-1α–mediated aerobic glycolysis as metabolic basis for trained immunity. Science. 2014;345(6204):1250684. doi: 10.1126/science.1250684. - DOI - PMC - PubMed
    1. Kar UK, Joosten LA. Training the trainable cells of the immune system and beyond. Nat Immunol. 2020;21(2):115–119. doi: 10.1038/s41590-019-0583-y. - DOI - PubMed

Publication types