Observational Study
. 2022 Mar 22;7(6):e154395.
doi: 10.1172/jci.insight.154395.

Neurofilament proteins as a potential biomarker in chemotherapy-induced polyneuropathy

Affiliations
Observational Study

Neurofilament proteins as a potential biomarker in chemotherapy-induced polyneuropathy

Petra Huehnchen et al. JCI Insight. .

Abstract

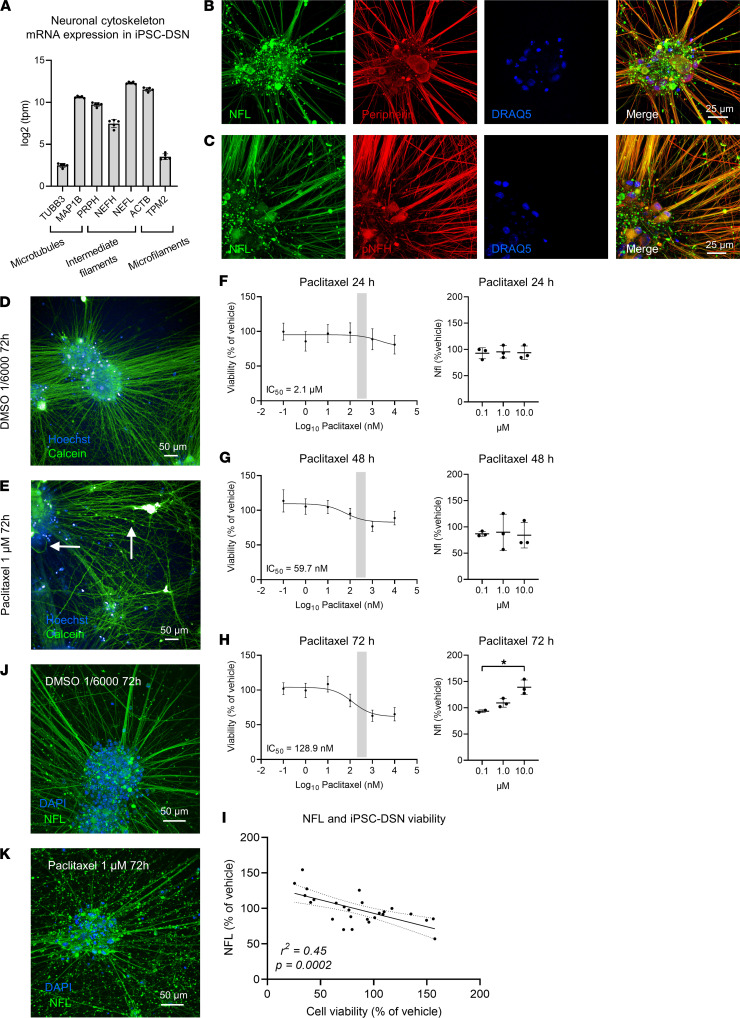
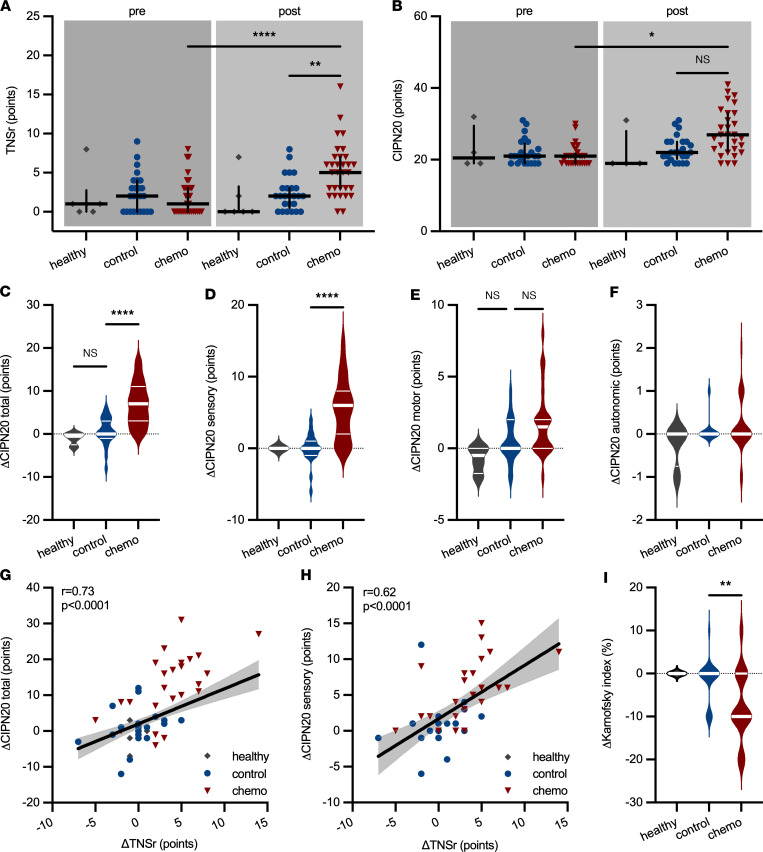
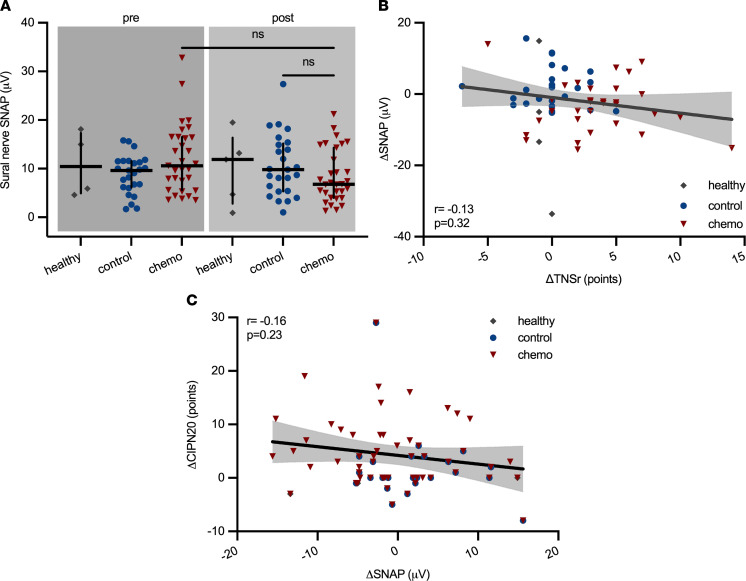
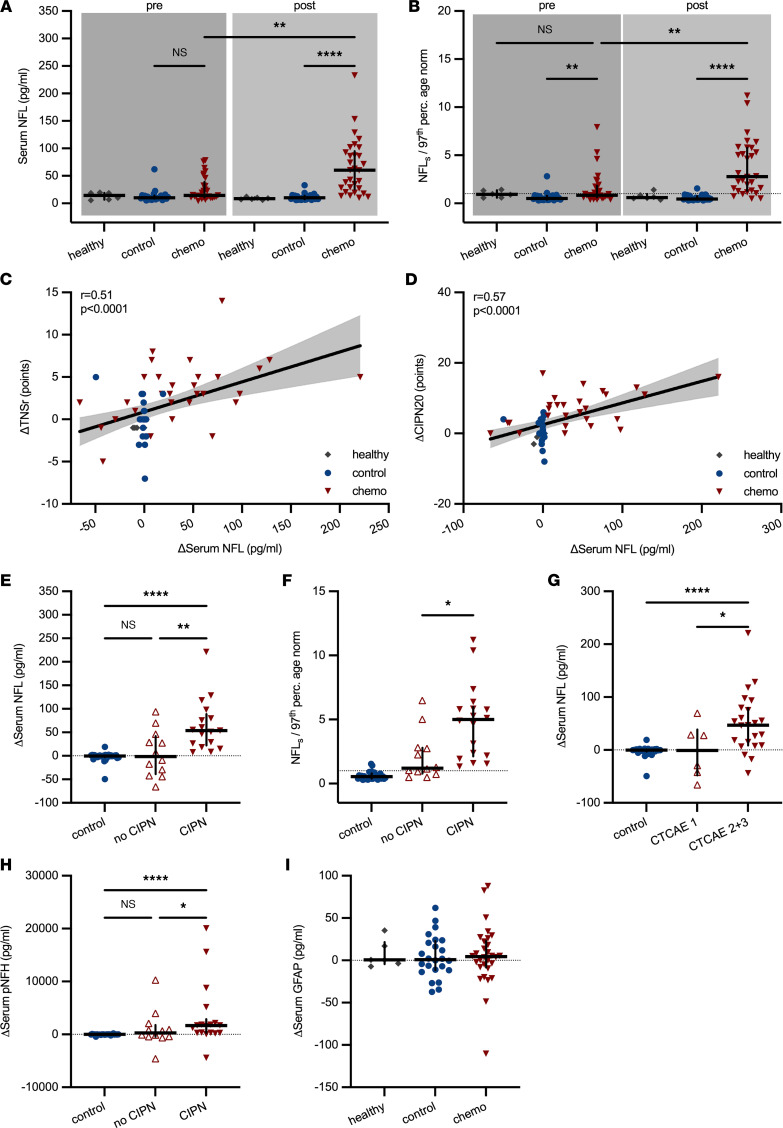
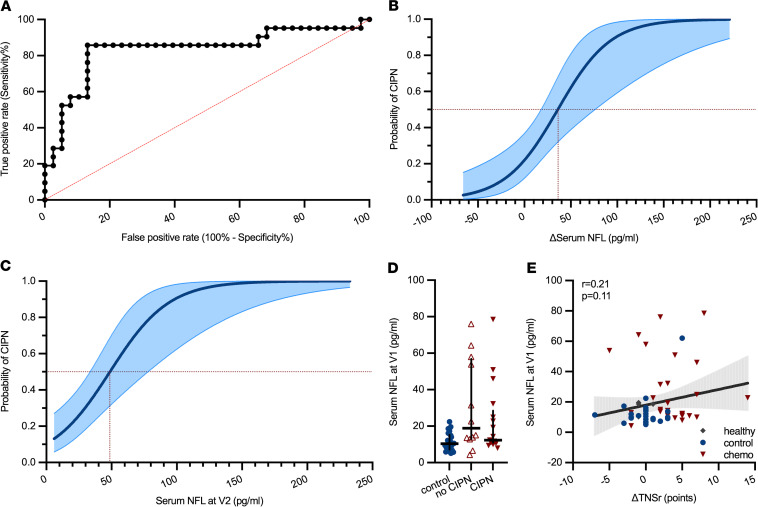
BACKGROUNDPaclitaxel chemotherapy frequently induces dose-limiting sensory axonal polyneuropathy. Given that sensory symptoms are challenging to assess objectively in clinical practice, an easily accessible biomarker for chemotherapy-induced polyneuropathy (CIPN) holds the potential to improve early diagnosis. Here, we describe neurofilament light chain (NFL), a marker for neuroaxonal damage, as a translational surrogate marker for CIPN.METHODSNFL concentrations were measured in an in vitro model of CIPN, exposing induced pluripotent stem cell-derived sensory neurons (iPSC-DSNs) to paclitaxel. Patients with breast or ovarian cancer undergoing paclitaxel chemotherapy, breast cancer control patients without chemotherapy, and healthy controls were recruited in a cohort study and examined before chemotherapy (V1) and after 28 weeks (V2, after chemotherapy). CIPN was assessed by the validated Total Neuropathy Score reduced (TNSr), which combines patient-reported symptoms with data from clinical examinations. Serum NFL (NFLs) concentrations were measured at both visits with single-molecule array technology.RESULTSNFL was released from iPSC-DSNs upon paclitaxel incubation in a dose- and time-dependent manner and was inversely correlated with iPSC-DSN viability. NFLs strongly increased in paclitaxel-treated patients with CIPN, but not in patients receiving chemotherapy without CIPN or controls, resulting in an 86% sensitivity and 87% specificity. An NFLs increase of +36 pg/mL from baseline was associated with a predicted CIPN probability of more than 0.5.CONCLUSIONNFLs was correlated with CIPN development and severity, which may guide neurotoxic chemotherapy in the future.TRIAL REGISTRATIONClinicalTrials.gov NCT02753036.FUNDINGDeutsche Forschungsgemeinschaft (EXC 257 NeuroCure), BMBF (Center for Stroke Research Berlin, 01 EO 0801), Animalfree Research, EU Horizon 2020 Innovative Medicines Initiative 2 Joint Undertaking (TransBioLine, 821283), Charité 3R - Replace - Reduce - Refine.

Keywords: Adult stem cells; Cancer; Neuroscience; Toxicology.


Figures

Figure 1
Figure 1. Neurofilament proteins and viability in human iPSC-DSNs treated with paclitaxel.
(A) Human induced pluripotent stem cell–derived sensory neurons (hiPSC-DSNs) express cytoskeleton protein mRNA. (B and C) Immunocytochemistry of the cytoskeleton proteins peripherin, NFL, and phosphorylated NF heavy chain (pNFH) indicate colocalization of peripherin with NFL and NFL with pNFH (scale bar: 25 μm). (D and E) In comparison to vehicle (DMSO), treatment with paclitaxel at 1 μM for 72 hours led to axonal blebbing (E, vertical arrow) in living cells and apoptosis (E, horizontal arrow) (scale bar: 50 μm) (see also Supplemental Figure 2). (FH) A time- and dose-dependent decrease in hiPSC-DSN viability (mean with 95% CI) and a corresponding increase of NFL in the supernatant (mean ± SD) was observed upon paclitaxel incubation. (I) Human iPSC-DSN viability and NFL concentrations in the supernatant correlated inversely in response to 72-hour paclitaxel incubation. (J and K) Axonal NFL expression diminished and concentrated in cytoskeletal debris in response to paclitaxel treatment compared with vehicle-treated hiPSC-DSN (scale bar: 50 μm). Statistical analysis: (FH, left column) nonlinear regression (log-inhibitor vs. response, 3 parameters) of data from n = 9 independent experiments; (FH, right column) Kruskal-Wallis test of data from n = 9 independent experiments; (I) Pearson’s correlation from n = 9 independent experiments of 24- to 72-hour paclitaxel-treated neurons (for details, refer to Supplemental Methods). *P < 0.05.
Figure 2
Figure 2. CONSORT diagram of the CICARO trial.
Patients were screened in weekly interdisciplinary tumor board meetings and eligibility criteria checked. Eligible patients were contacted by phone regarding possible study participation and, if interested, scheduled for a baseline visit V1, where written informed consent was obtained prior to study inclusion and procedures. Follow-up study visit V2 was scheduled at least 2 weeks after the last chemotherapy application or approximately 6 months after V1 for control patients. A total of n = 10 patients were lost to follow-up (i.e., could not be reached, withdrawal of consent, death) and were excluded from the final analysis.
Figure 3
Figure 3. Clinical and patient-reported characteristics of CIPN in patients.
(A) Chemotherapy but not control patients developed an increase in the Total Neuropathy Score reduced (TNSr). (B) Patient-reported symptoms of CIPN, assessed with the EORTC-CIPN20 questionnaire, increased in chemotherapy-treated patients. (C) The increase in subjective CIPN symptoms was significantly greater in chemotherapy than control patients, (D) particularly for the sensory symptoms of CIPN assessed with the questionnaire, whereas (E) only a slight nonsignificant increase was observed for motor symptoms and (F) autonomic symptoms. (G) Change in subjective CIPN symptoms correlated well with the increase in TNSr, which (H) was also the case for only the sensory items of the CIPN20 questionnaire (area filling indicates 95% CI). (I) The Karnofsky performance index decreased in chemotherapy-treated patients but not in controls. Statistical analysis: (AF and I) Kruskal-Wallis test with Dunn’s post hoc correction; (G and H) linear regression with Spearman’s correlation. Study participants: (A and I) n = 6 (healthy), n = 25 (control), n = 31 (chemo); (BH) n = 4 (healthy), n = 24 (control), n = 29 (chemo). *P < 0.05, **P < 0.01, ****P < 0.0001.
Figure 4
Figure 4. Electrophysiological changes in patients with CIPN.
(A) The sural nerve sensory nerve action potential (SNAP) amplitudes decreased slightly in patients undergoing chemotherapy, but not controls. (B and C) Changes in SNAP amplitudes neither correlated with changes in the TNSr nor with patient-subjective symptoms of CIPN (area filling indicates 95% CI). Statistical analysis: (A) Kruskal-Wallis test; (B and C) linear regression with Spearman’s correlation. Study participants: (A and B) n = 6 (healthy), n = 25 (control), n = 31 (chemo); (C) n = 4 (healthy), n = 24 (control), n = 29 (chemo).
Figure 5
Figure 5. Serum neurofilament concentrations in control and chemotherapy-treated patients.
(A) NFLs concentrations were significantly higher in patients treated with chemotherapy (chemo) than patients who did not receive chemotherapy (control). (B) The age-adjusted upper limit of normal (97th percentile) for NFLs concentrations was calculated as NFLnorm = 4.19 × 1.029age (21). Patients’ median NFLs concentrations were below age-adjusted upper normal values at baseline in all groups. NFLs values increased 2.8-fold over the age-adjusted upper limit of normal in chemotherapy-treated patients but not controls after treatment (dotted line marks ratio of 1). (C) The change in TNSr and NFLs correlated positively as did (D) the increase in patient-reported CIPN symptoms and NFLs (area filling indicates 95% CI). (E) The increase in NFLs was particularly observed in chemotherapy-treated patients, who developed clinically significant CIPN (defined as ΔTNSr ≥ 3 points) compared with chemotherapy-treated patients without CIPN and control patients. (F) The same was true for age-adjusted NFLs concentrations. (G) Increased NFLs values were also observed in chemotherapy-treated patients stratified according to CTCAE grades for peripheral sensory neuropathy: on average grade 2 and 3 CIPN (n = 25) resulted in a significant rise in NFLs values compared with asymptomatic grade 1 (n = 6) and controls (n = 30). (H) Higher serum concentrations of phosphorylated NF heavy chain (pNFH) concentrations were observed in patients with CIPN. (I) No changes in GFAP as indicator of CNS glial cell (astrocyte) damage were seen in any group. Statistical analysis: (A, B, and EI) Kruskal-Wallis test; (C and D) linear regression with Spearman’s correlation. Study participants: (AC and I) n = 6 (healthy), n = 24 (control), n = 30 (chemo); (D) n = 4 (healthy), n = 24 (control), n = 29 (chemo); (E, F, and H) n = 30 (control), n = 12 (no CIPN), n = 17 (CIPN). *P < 0.05, **P < 0.01, ****P < 0.0001.
Figure 6
Figure 6. Predicted probability of CIPN diagnosis dependent on NFLs concentrations.
(A) ROC analysis revealed an 86% sensitivity and 87% specificity for the parameter ΔNFLs greater than 7.05 pg/mL to detect CIPN. (B) A likelihood of more than 0.5 for a patient to have CIPN was given at an increase in NFLs by +36 pg/mL (area filling indicates 95% CI). (C) Not taking baseline NFLs values into account, a probability of more than 0.5 for a CIPN diagnosis was predicted at NFLs concentrations of 49 pg/mL at V2 (area filling indicates 95% CI). (D) Baseline NFLs concentrations were not different among controls, chemotherapy-treated patients without CIPN, and patients with CIPN. (E) Baseline NFLs values did not correlate with change in TNSr (area filling indicates 95% CI). Statistical analysis: (A) ROC analysis; (B and C) logistic regression; (D and E) Kruskal-Wallis test. Study participants: (AC and E) n = 6 (healthy), n = 24 (control), n = 30 (chemo); (D) n = 30 (control), n = 12 (no CIPN), n = 17 (CIPN).

References

    1. Boehmerle W, et al. [Chemotherapy-induced neuropathy] Nervenarzt. 2015;86(2):156–160. doi: 10.1007/s00115-014-4126-3. - DOI - PubMed
    1. Seretny M, et al. Incidence, prevalence, and predictors of chemotherapy-induced peripheral neuropathy: a systematic review and meta-analysis. Pain. 2014;155(12):2461–2470. doi: 10.1016/j.pain.2014.09.020. - DOI - PubMed
    1. Kober KM, et al. Phenotypic characterization of paclitaxel-induced peripheral neuropathy in cancer survivors. J Pain Symptom Manage. 2018;56(6):908–919. doi: 10.1016/j.jpainsymman.2018.08.017. - DOI - PMC - PubMed
    1. Tofthagen C, et al. Peripheral neuropathy caused by paclitaxel and docetaxel: an evaluation and comparison of symptoms. J Adv Pract Oncol. 2013;4(4):204–215. - PMC - PubMed
    1. Scripture CD, et al. Peripheral neuropathy induced by paclitaxel: recent insights and future perspectives. Curr Neuropharmacol. 2006;4(2):165–172. doi: 10.2174/157015906776359568. - DOI - PMC - PubMed

Publication types

MeSH terms

Associated data