. 2022 Mar 8;7(5):e150239.
doi: 10.1172/jci.insight.150239.

Recruitment and training of alveolar macrophages after pneumococcal pneumonia

Affiliations

Recruitment and training of alveolar macrophages after pneumococcal pneumonia

Emad I Arafa et al. JCI Insight. .

Abstract

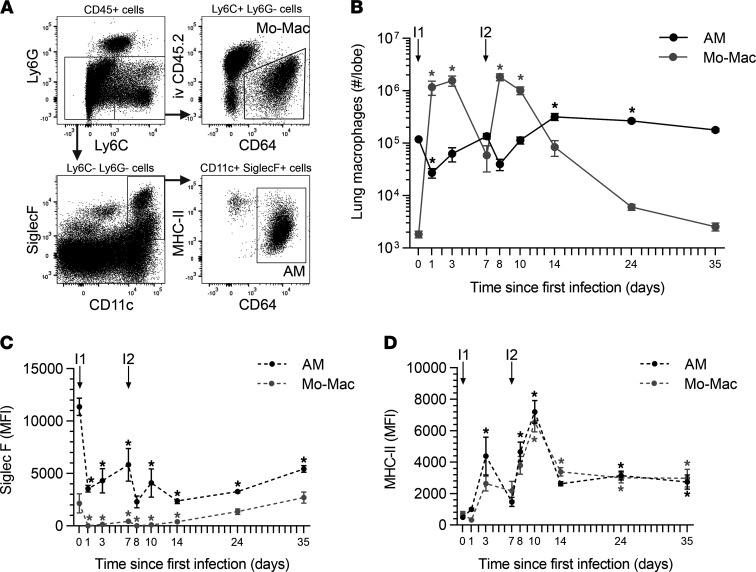
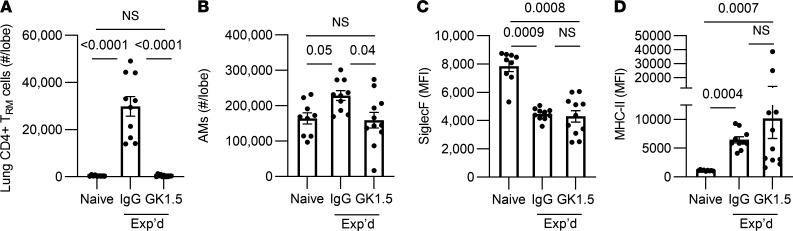
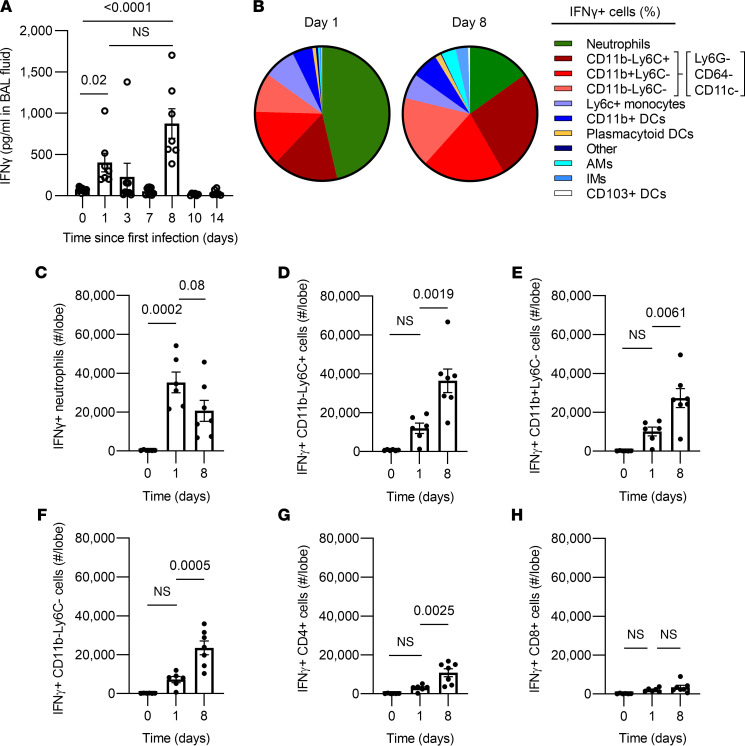
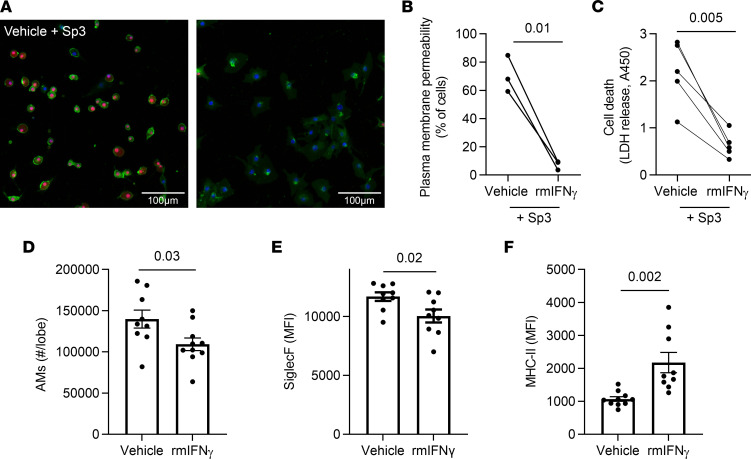
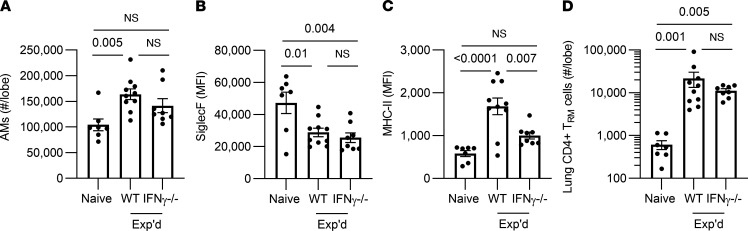
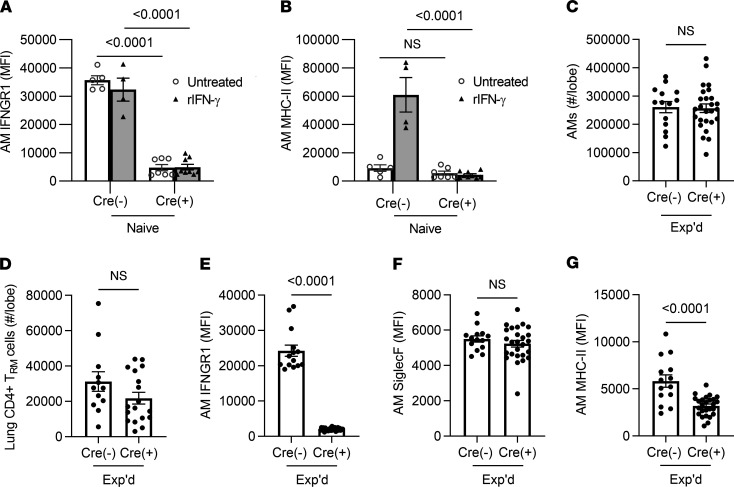
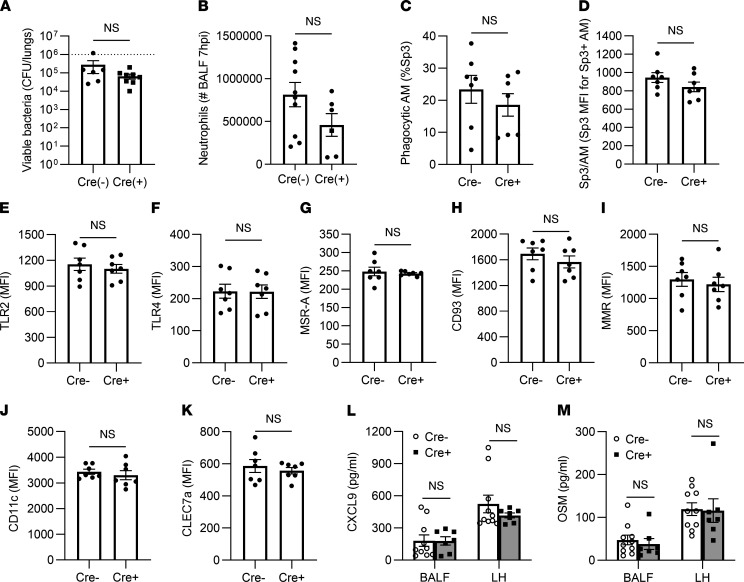
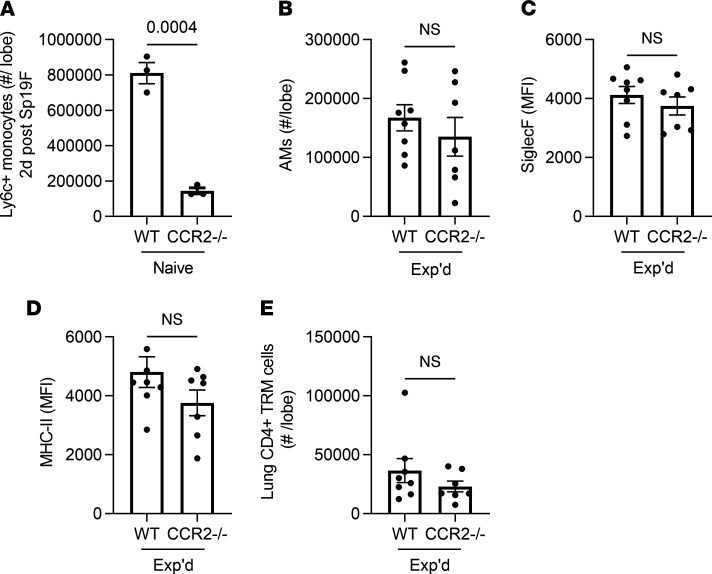
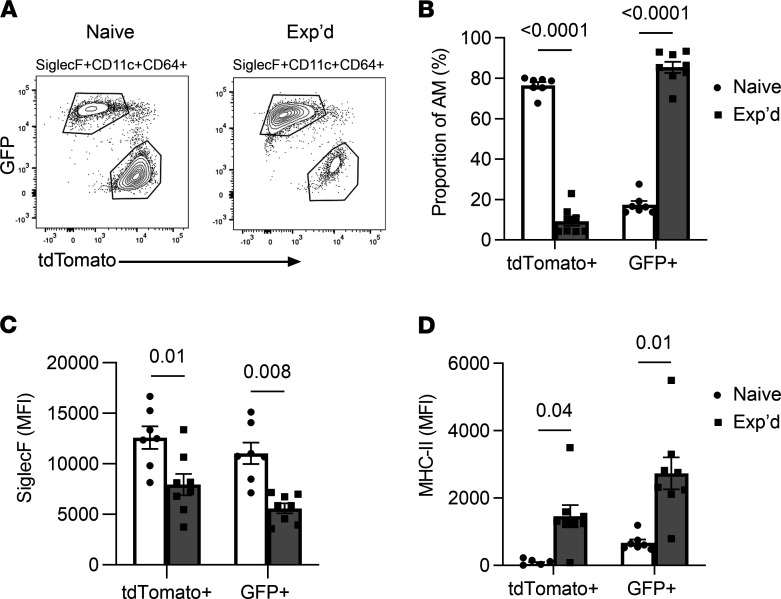
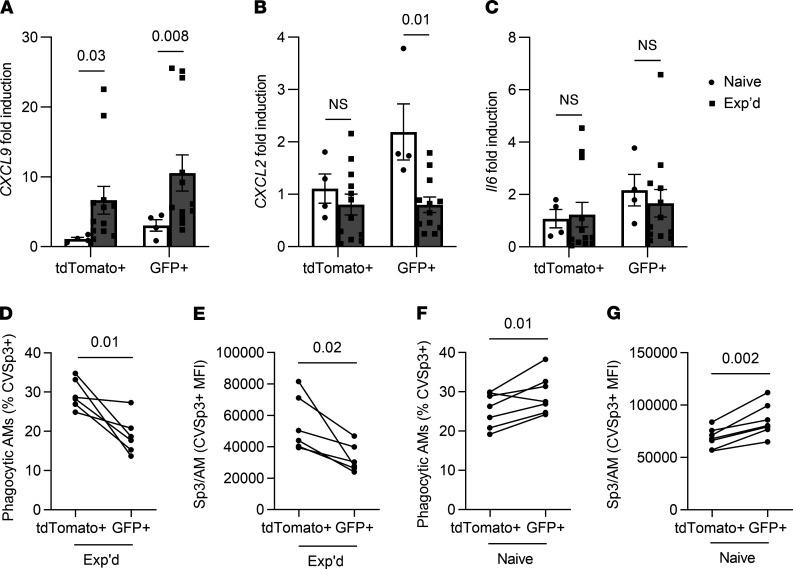
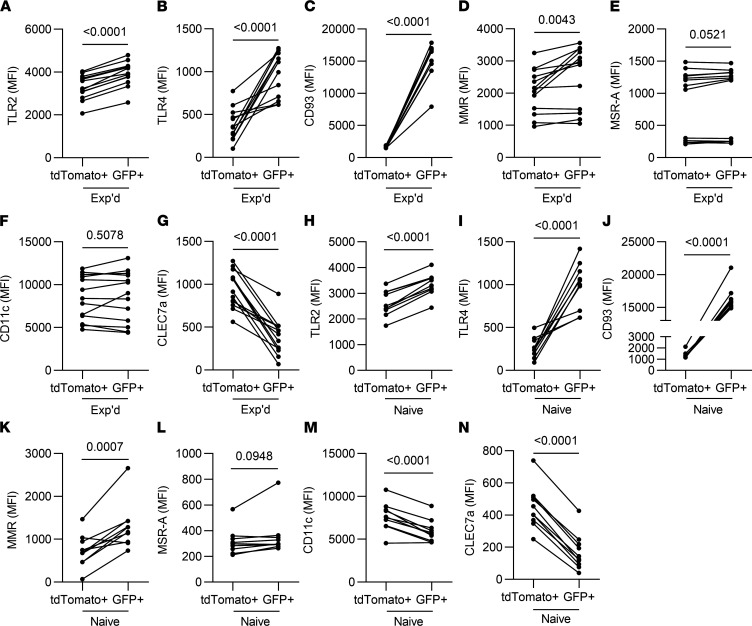
Recovery from pneumococcal pneumonia remodels the pool of alveolar macrophages so that they exhibit new surface marker profiles, transcriptomes, metabolomes, and responses to infection. Mechanisms mediating alveolar macrophage phenotypes after pneumococcal pneumonia have not been delineated. IFN-γ and its receptor on alveolar macrophages were essential for certain, but not all, aspects of the remodeled alveolar macrophage phenotype. IFN-γ was produced by CD4+ T cells plus other cells, and CD4+ cell depletion did not prevent alveolar macrophage remodeling. In mice infected or recovering from pneumococcus, monocytes were recruited to the lungs, and the monocyte-derived macrophages developed characteristics of alveolar macrophages. CCR2 mediated the early monocyte recruitment but was not essential to the development of the remodeled alveolar macrophage phenotype. Lineage tracing demonstrated that recovery from pneumococcal pneumonias converted the pool of alveolar macrophages from being primarily of embryonic origin to being primarily of adult hematopoietic stem cell origin. Alveolar macrophages of either origin demonstrated similar remodeled phenotypes, suggesting that ontogeny did not dictate phenotype. Our data reveal that the remodeled alveolar macrophage phenotype in lungs recovered from pneumococcal pneumonia results from a combination of new recruitment plus training of both the original cells and the new recruits.

Keywords: Bacterial infections; Immunology; Macrophages; Pulmonology.


Conflict of interest statement

Conflict of interest: The authors have declared that no conflict of interest exists.

Figures

Figure 1
Figure 1. Macrophage dynamics after pneumococcal infections.
Single-cell suspensions were generated from left lung lobes and processed using flow cytometry at select time points during generation of pneumococcal experience. (A) AM and inflammatory monocyte-macrophages (Mo-Macs) were identified as CD45+Ly6gCD64+SiglecF+CD11c+ cells and CD45+Ly6gCD64+SiglecF+Ly6c+ cells, respectively. Panels represent a mouse with Sp19F pneumonia 7 days after infection. (B) Numbers of AM and Mo-Macs were calculated from the frequency of total measured by FlowJo software. (C and D) Median fluorescent intensity (MFI) of Siglec F and MHC-II on AM and Mo-Macs at select time points after a first infection (I1) or second infection (I2) with Sp19F. Values are expressed as mean ± SEM. One-way ANOVA with Dunnett’s multiple-comparison test was used to examine significance. * P < 0.05 compared with day 0.
Figure 2
Figure 2. CD4+ cells and the experienced AM phenotype.
C57BL/6 mice received i.p. and i.n. GK1.5 to deplete CD4+ T cells, or IgG as control, during each of the Sp19F infections — the last of which was 4 weeks prior to studies of T cells and AM in the lungs. (A) Enumeration of extravascular CD4+CD69+CD11a+CD44+CD62L cells per lung lobe reveals a loss of CD4+ resident memory T (TRM) cells in the GK1.5-treated group. (B) Enumeration of alveolar macrophages (defined as CD11c+SiglecF+CD64+). (C and D) Median fluorescent intensity (MFI) of Siglec F and MHC-II on AM. Values are expressed as mean ± SEM. n = 8–12 mice/group. Kruskal-Wallis with Dunn’s multiple-comparison tests were used to examine significance.
Figure 3
Figure 3. Cellular sources of IFN-γ during pneumococcal pneumonia.
(A) ELISA measurement of IFN-γ concentration in broncho-alveolar lavage (BAL) fluids from left lungs at 0, 1, 3, and 7 days after the first Sp19F infection, as well as 1, 3, and 7 days after the second Sp19F infection that was delivered on day 7. Values are expressed as mean ± SEM. n = 6–11 mice per time point. One-way ANOVA with Tukey’s multiple-comparison test on log-transformed data was used to examine significance. (BH) Intracellular cytokine staining was performed on single-cell suspensions from left lung digests from naive uninfected mice, 1 day after a single Sp19F infection (day 1), or 1 day after a second Sp19F infection (day 8), with n = 6–7 mice per time point. (B) Pie chart depicting cells that were IFN-γ+ expressed as an average of all IFN-γ+ cells in the lung. Myeloid cells were identified as described (21). (C) Numbers of IFN-γ+ neutrophils (identified as CD11b+Ly6G+). (D) Numbers of IFN-γ+ CD45+Ly6GCD64CD11cCD11bLy6C+ cells. (E) Numbers of IFN-γ+ CD45+Ly6GCD64CD11cCD11b+Ly6C cells. (F) Numbers of IFN-γ+ CD45+Ly6GCD64CD11cCD11bLy6C cells. (G) Numbers of IFN-γ+ CD4+ cells (identified as CD19CD8CD4+ cells). (H) Number of IFN-γ+ CD8+ cells (identified as CD19CD4CD8+ cells). Values are expressed as mean ± SEM. One-way ANOVA Tukey’s multiple-comparison tests were used to examine significance.
Figure 4
Figure 4. IFN-γ is sufficient to remodel and protect macrophages.
(AC) RAW264.7 cells were treated with recombinant mouse IFN-γ or vehicle prior to being infected with Sp3 for 2 hours. (A) Infected cells were stained with Hoechst (nucleus, blue), Cell Mask Green (plasma membrane, green) and Nuclear Red Dye 647 (permeable dye, red). Scale bar: 100 μm. (B) Quantification of cells with permeable plasma membranes, defined by nuclear red staining. n = 3 independent experiments. (C) Quantification of ell death, as measured by LDH in the supernatant. n = 5 independent experiments. Paired t test analyses were used to examine significance. (DF) Seven- to 8-week-old mice were i.t. stimulated with IFN-γ or vehicle (1% BSA in saline) directed to the left lung twice at a 1-week interval, to mimic infection experiences. Four weeks after the second stimulation with IFN-γ, single-cell suspensions were created from left lung lobes and processed using flow cytometry. AM were identified as CD11c+SiglecF+CD64+ cells. n = 9–10 mice per group. (D) AM numbers were calculated from the frequency of total measured by FlowJo software. (E and F) Median fluorescent intensity (MFI) of Siglec F and MHC-II expression on AM. Values are expressed as mean ± SEM. Unpaired t test analyses were used to examine significance.
Figure 5
Figure 5. Roles for IFN-γ in remodeling of AM.
Wild type (WT) C57BL/6 or IFN-γ–/– mice were i.t. challenged with Sp19F or saline directed to the left lung twice, referred to as experienced (Exp’d) or Naive, respectively. After 4–6 weeks (to allow resolution of inflammation), the left lung lobes of these mice were immunophenotyped. n = 7–10 mice per group. Values are expressed as mean ± SEM. AM were identified as CD11c+SiglecF+CD64+ cells. Numbers were calculated from the frequency of total measured by FlowJo software. Median fluorescent intensity (MFI) of Siglec F and of MHC-II were calculated on AM from each mouse. One-way ANOVA with Tukey’s multiple-comparison test was used to examine significance. (AD) Lung CD4+ resident memory T (TRM) cells were identified as extravascular CD4+CD69+CD11a+CD44+CD62L live cells, and numbers were calculated from the frequency of total gated events measured by FlowJo software. Kruskal-Wallis with Dunn’s multiple-comparison test was used to examine significance.
Figure 6
Figure 6. Roles for the IFN-γ receptor on AM in their remodeling after pneumococcus infections.
CD11c-Cre and IFNGR1-floxed mice were crossed to produce IFNGR1 mutation in CD11c+ cells. (A and B) Acute responses to IFN-γ. MFI of MHC-II and IFNGR1 were measured on AM, identified as live CD11c+SiglecF+CD64+ cells in single-cell suspensions from left lung lobes. Cre and Cre+ mice were instilled i.n. with 200 ng/mL IFN-γ and compared with uninstilled controls. Values are expressed as mean ± SEM. n = 4–9 mice/group. Two-way ANOVA followed by Tukey’s multiple comparison test was used to calculate significance. (CG) AM and T cells in the left lung lobes of mice with prior pneumococcal experience. (C) Enumeration of AM, identified as live CD11c+SiglecF+CD64+ cells. n = 14–26 mice per group. Values are expressed as mean ± SEM. Unpaired t tests were used to examine significance. (D) Enumeration of lung CD4+ resident memory T (TRM) cells, identified as extravascular CD4+CD69+CD11a+CD44+CD62L- cells, with numbers calculated from the frequency of total measured by FlowJo software in experienced lungs from Cre and Cre+ mice. n = 12–18 mice/group. Values are expressed as mean ± SEM. Unpaired t tests were used to examine significance. (EG) Median fluorescent intensity (MFI) of IFNGR1, Siglec F, and MHC-II, measured on AM in single-cell suspensions from left lung lobes. AM were identified as CD11c+SiglecF+CD64+ cells. n = 14–26 mice/group. Values are expressed as mean ± SEM. Unpaired t tests were used to examine significance.
Figure 7
Figure 7. Immune activities in the absence of IFN-γ receptor on AM.
CD11c-Cre and IFNGR1-floxed mice were crossed to produce IFNGR1 mutation in CD11c+ cells. Prior pneumococcal experience was generated as described in Methods for all mice in the studies shown. AM and neutrophils were identified as CD11c+SiglecF+ and Ly6Gbright cells in bronchoalveolar lavage fluids. (A) Viable bacteria per lung, after mice were infected i.t. 24 hours previously with Sp3. n = 6–8 mice per group. (B) Neutrophils in the air spaces of mice with 7 hours of Sp3 pneumonia, quantified in BAL fluids. n = 6–10 mice/group. (C) Fraction of AM that were actively phagocytic, expressed as the percentage of total AM that were associated with PKH67-labeled bacteria 40 minutes after instillation. n = 7 mice per group. (D) Amount of Sp3 phagocytized by AM that were actively phagocytic, expressed as the MFI of those AM that were PKH67+ 40 minutes after instillation of fluorescent bacteria. (EK) Surface levels of phagocytic receptors and pattern-recognition receptors on AM from the phagocytosis experiment, expressed as MFI. (L and M) Concentrations of CXCL9 and OSM in BAL fluids and lung homogenates collected 7 hours after Sp3 infection. n = 7–10 mice/group. For AK, data were compared using unpaired t tests. For L and M, data were compared using 2-way ANOVA with Tukey’s multiple-comparison test. Values are expressed as mean ± SEM.
Figure 8
Figure 8. CCR2 and the experienced AM phenotype.
(A) Enumeration of extravascular monocytes in single-cell suspensions from lung lobes of WT or CCR2–/– mice infected with Sp19F for 2 days, defined as live CD11cSiglecFCD11b+MHCIILy6C+ cells using a similar schema to the one detailed in Figure 1A. n = 3 mice per group. (B) AM were identified as live CD11c+SiglecF+CD64+ cells using a similar schema to the one detailed in Figure 1A, and numbers were calculated from the frequency of total measured by FlowJo software. (C and D) Median fluorescent intensity (MFI) of Siglec F and MHC-II expression on AM. (E) Lung CD4+ resident memory T (TRM) cells were identified as extravascular CD4+CD69+CD11a+CD44+CD62L cells, and numbers were calculated from the frequency of total measured by FlowJo software. For BE, n = 8–10 mice per group. Throughout, values are expressed as mean ± SEM, and unpaired t tests were used to examine significance.
Figure 9
Figure 9. AM from different origins remodel similarly after pneumococcal infections.
A lineage-tracing mouse model allowed the differentiation of AM of embryonic origin (TdTomato+) from those that derived from adult hematopoietic stem cells (GFP+). Naive and experienced mice had prior exposures to saline or pneumococcus Sp19F in their lungs, respectively. (A) Both naive and experienced lungs contain distinct populations of TdTomato+ and GFP+ AM. (B) Percentages of AM subsets in naive and experienced lungs. (C) Median fluorescent intensity (MFI) of Siglec F expression on AM subsets in naive and experienced lungs. (D) MFI of MHC-II expression on AM subsets in naive and experienced lungs. For all, n = 7–8 mice per group, values are expressed as mean ± SEM, and unpaired t tests were used to examine the effect of experience on AM subsets.
Figure 10
Figure 10. Recent recruits differ functionally from the AM that were initially resident in the experienced lung.
A lineage-tracing mouse model allowed the differentiation of AM of embryonic origin (TdTomato+) from those that derived from adult hematopoietic stem cells (GFP+). (AG) Naive and experienced mice had prior exposures to saline or pneumococcus Sp19F in their lungs, respectively, before being challenged with a mismatched Sp3 serotype prior to AM collection for studies of cytokine expression (AC) or phagocytosis (DG). (AC) Fold induction of Cxcl9 (A), Cxcl2 (B), and Il6 (C) transcripts measured using quantitative PCR of sorted tdTomato+ and GFP+ AM, normalized to average induction in naive tdTomato+ AM for each gene. n = 4–12 mice per group. Values are expressed as mean ± SEM, and unpaired Mann-Whitney U tests were used to examine the effect of experience on each AM subset. (D) Fraction of AM of distinct origin that were actively phagocytic within experienced lungs, expressed as the percentage of total AM of that origin (TdTomato+ or GFP+) that were associated with ClaretVue-labeled bacteria 40 minutes after instillation. (E) Amount of Sp3 phagocytized by AM that were actively phagocytic within experienced lungs, expressed as the MFI of those AM that were ClaretVue+. (D and E) n = 6 mice per group, with lines connecting AM subsets of distinct origin within a given mouse lung. (F) Fraction of AM of distinct origin that were actively phagocytic within naive lungs, expressed as the percentage of total AM of that origin (TdTomoato+ or GFP+) that were associated with ClaretVue-labeled bacteria 40 minutes after instillation. (G) Amount of Sp3 phagocytized by AM that were actively phagocytic within naive lungs, expressed as the MFI of those AM that were ClaretVue+. (F and G) n = 7 mice per group, with lines connecting AM subsets of distinct origin within a given mouse lung. The experienced mice in D and E and naive mice in F and G were collected in different experiments; therefore, data should not be compared across the former and latter panels. For DG, paired t tests were used to examine significance.
Figure 11
Figure 11. Differential surface levels of phagocytic receptors and pattern-recognition receptors on AM of distinct origins, in naive and experienced lungs.
A lineage-tracing mouse model allowed the differentiation of AM of embryonic origin (TdTomato+) from those that derived from adult hematopoietic stem cells (GFP+). (AG) Experienced mice were ushered through the pneumococcal experience model, (Experienced, Exp’d). (HN) Naive mice were left unchallenged (Naive). AM were identified as live CD11c+SiglecF+CD64+ cells in single-cell suspensions from the left lung lobe. Each panel shows median fluorescent intensity (MFI) of the indicated receptor on the indicated AM subsets, with lines connecting AM subsets of distinct origin within a given mouse lung. n = 7–11 mice per group. Paired t test analysis was used to examine significance.

Similar articles

Cited by

References

    1. Mizgerd JP. Respiratory infection and the impact of pulmonary immunity on lung health and disease. Am J Respir Crit Care Med. 2012;186(9):824–829. doi: 10.1164/rccm.201206-1063PP. - DOI - PMC - PubMed
    1. Mandell LA, et al. Infectious Diseases Society of America/American Thoracic Society consensus guidelines on the management of community-acquired pneumonia in adults. Clin Infect Dis. 2007;44 Suppl 2(ssuppl 2):S27–S72. - PMC - PubMed
    1. Ramirez JA, et al. Adults hospitalized with pneumonia in the United States: incidence, epidemiology, and mortality. Clin Infect Dis. 2017;65(11):1806–1812. doi: 10.1093/cid/cix647. - DOI - PubMed
    1. Lipsitch M, et al. Are anticapsular antibodies the primary mechanism of protection against invasive pneumococcal disease? PLoS Med. 2005;2(1):e15. doi: 10.1371/journal.pmed.0020015. - DOI - PMC - PubMed
    1. Hussell T, Bell TJ. Alveolar macrophages: plasticity in a tissue-specific context. Nat Rev Immunol. 2014;14(2):81–93. doi: 10.1038/nri3600. - DOI - PubMed

Publication types