. 2022 Mar 22;7(6):e156532.
doi: 10.1172/jci.insight.156532.

Regional variability and genotypic and pharmacodynamic effects on PrP concentration in the CNS

Affiliations

Regional variability and genotypic and pharmacodynamic effects on PrP concentration in the CNS

Meredith A Mortberg et al. JCI Insight. .

Abstract

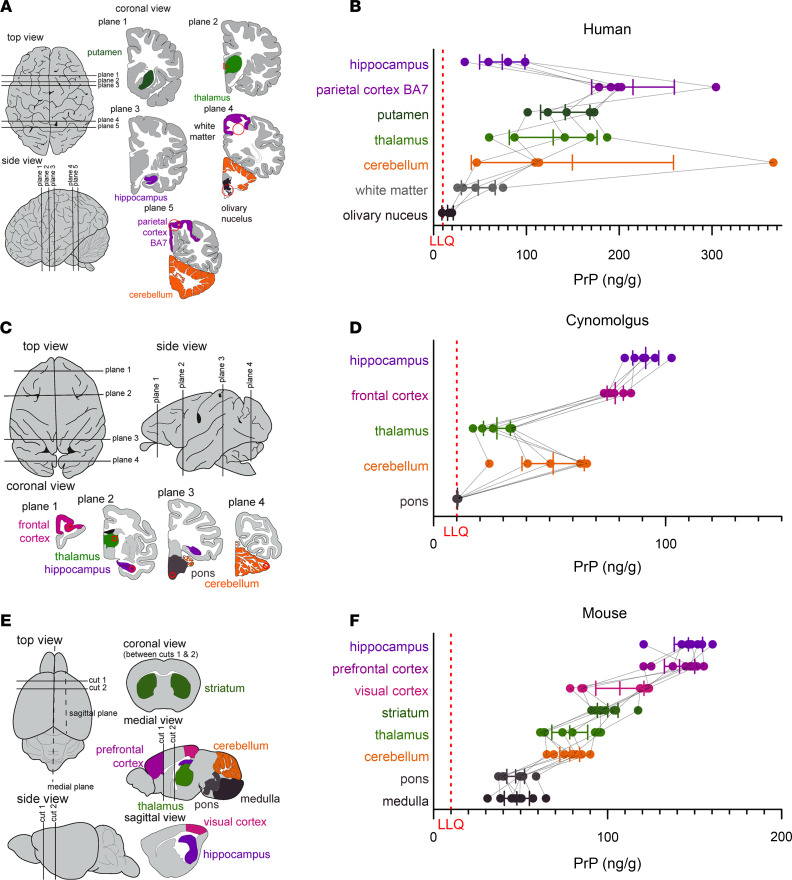
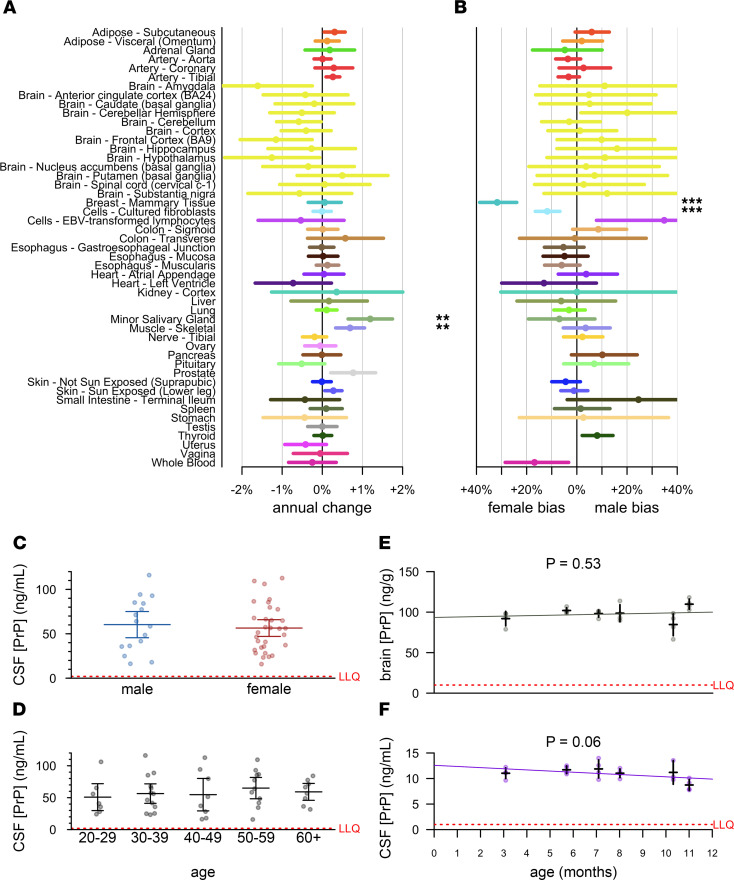
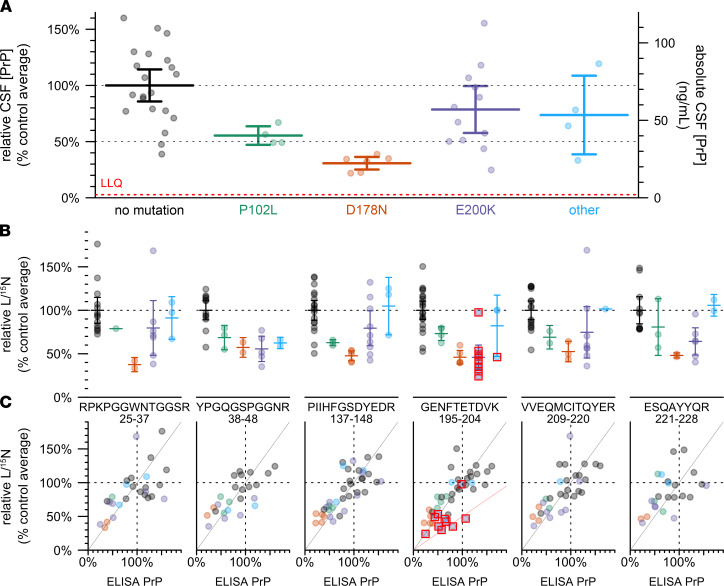
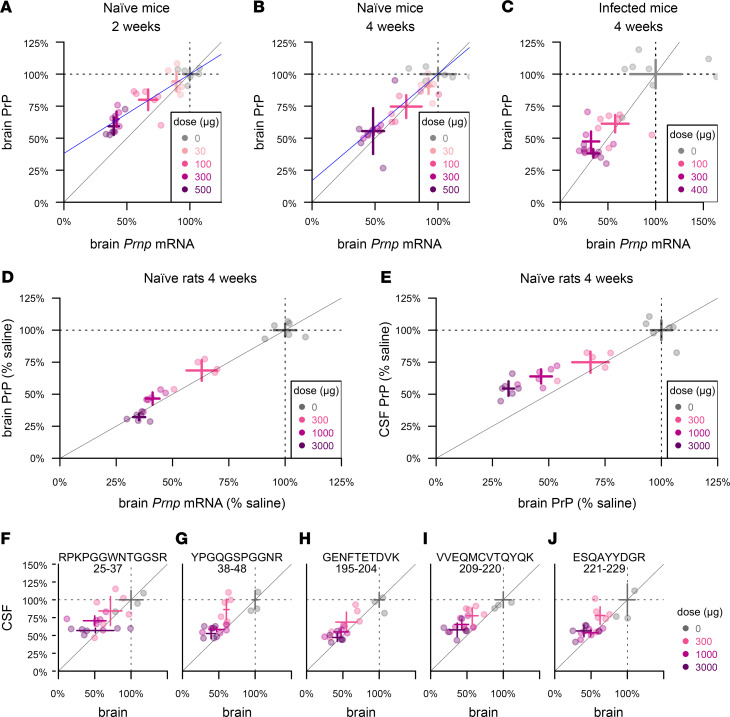
Prion protein (PrP) concentration controls the kinetics of prion replication and is a genetically and pharmacologically validated therapeutic target for prion disease. In order to evaluate PrP concentration as a pharmacodynamic biomarker and assess its contribution to known prion disease risk factors, we developed and validated a plate-based immunoassay reactive for PrP across 6 species of interest and applicable to brain and cerebrospinal fluid (CSF). PrP concentration varied dramatically across different brain regions in mice, cynomolgus macaques, and humans. PrP expression did not appear to contribute to the known risk factors of age, sex, or common PRNP genetic variants. CSF PrP was lowered in the presence of rare pathogenic PRNP variants, with heterozygous carriers of P102L displaying 55%, and D178N just 31%, of the CSF PrP concentration of mutation-negative controls. In rodents, pharmacologic reduction of brain Prnp RNA was reflected in brain parenchyma PrP and, in turn in CSF PrP, validating CSF as a sampling compartment for the effect of PrP-lowering therapy. Our findings support the use of CSF PrP as a pharmacodynamic biomarker for PrP-lowering drugs and suggest that relative reduction from individual baseline CSF PrP concentration may be an appropriate marker for target engagement.

Keywords: Neurodegeneration; Neuroscience; Prions; Therapeutics.


Conflict of interest statement

Conflict of interest: EVM has received consulting fees from Deerfield Management and has received research support in the form of unrestricted charitable contributions from Ionis Pharmaceuticals. SMV has received speaking fees from Ultragenyx, Illumina, and Biogen and has received research support in the form of unrestricted charitable contributions from Ionis Pharmaceuticals. SEA has received honoraria and/or travel expenses for lectures from AbbVie, Biogen, EIP Pharma, Roche, and Sironax; has received fees for consulting and/or advisory board membership from Athira, Biogen, Cassava, Cognito, Cortexyme, Sironax, and vTv Therapeutics; and has received grant support from AbbVie, Amylyx Pharmaceuticals, EIP Pharma, Ionis Pharmaceuticals, and Merck. HTZ, CM, JM, and HBK are employees and shareholders of Ionis Pharmaceuticals. MRM is an employee of BioAgilytix. EK is an employee of Kymera Therapeutics. JL is currently an employee of Kriya Therapeutics. DEC has received grant support from Ionis Pharmaceuticals.

Figures

Figure 1
Figure 1. Regional distribution of brain PrP.
(A, C, and E) Diagrams of brain regions examined in humans, cynomolgus macaques, and mice, respectively, and (B, D, and F) PrP concentrations in n = 5 human, n = 6 macaque, and n = 8 mouse brains. Thin lines connect regions from the same individual. Bars indicate mean and 95% confidence interval of the mean. Red dashed lines indicate lower limit of quantification (LLQ). Brain diagrams were traced from Allen Brain Atlas images (51, 52).
Figure 2
Figure 2. Lack of evidence for sex or age effects in PrP expression.
(A and B) Analysis of publicly available GTEx v8 data. Log-linear models [log(tpm) ~ age + hardy + sex; see Results] were fit for each tissue, and the mean annual change (dots) was calculated as exp(βage)-1 and exp(βsex), with 95% confidence intervals (line segments) given by 1.96 standard errors of the mean. After Bonferroni correction for n = 49 tests (A) or n = 44 tests (B), symbols indicate *P < 0.05, **P < 0.01, ***P < 0.001. (C and D) CSF PrP concentrations averaged across all available CSF samples for n = 47 MGH study participants stratified by sex (C) or age (D). Bars indicate mean and 95% confidence interval of the mean. (E and F) Brain (E) and CSF (F) concentrations of PrP for cohorts of n = 4 male Sprague-Dawley rats aged 3–11 months. Red dashed lines indicate lower limit of quantification (LLQ).
Figure 3
Figure 3. Effect of PRNP mutation on CSF PrP concentration.
(A) CSF PrP concentrations measured by cross-species ELISA, averaged across all available CSF samples for each of n = 47 MGH study participants, normalized to the mean of non-mutation carrier controls. Bars indicate mean and 95% confidence interval of the mean. Red dashed line indicates lower limit of quantification (LLQ). This sample set includes n = 29 individuals for which CSF PrP concentrations determined by BetaPrion ELISA were previously reported (11). (B) The same samples analyzed by the PrP MRM assay, peptides arranged from N-terminal (left) to C-terminal (right). Peptide sequences and residue numbers are noted beneath each plot. Because observations with technical replicate CVs greater than 15%, were removed, the number of samples differs for each panel. Bars indicate mean and 95% confidence interval of the mean. (C) Correlation between ELISA results from (A) (x axis) and MRM results from (B) (y axis), with lines indicating a diagonal with slope = 1 (gray) and 0.5 (pink, GENFTETDVK only). In (B and C), red boxes indicate individuals whose mutation abolishes the tryptic peptide being monitored in that plot.
Figure 4
Figure 4. Pharmacodynamic effect of PrP RNA-targeting therapy.
(A and B) Whole-hemisphere RNA (x axis) versus PrP (y axis), reduction measured by ELISA in groups of n = 6 naive mice at 2 weeks (A) and 4 weeks (B) after dosing. Blue lines represent linear regression best fits with the (1,1) coordinate fixed. (C) RNA from the lateral half of 1 hemisphere (x axis) versus PrP from the medial half of the same hemisphere (y axis), reduction measured by ELISA in groups of n = 6 RML prion–infected mice dosed at 60 dpi and harvested at 4 weeks after dosing. (D) Whole-hemisphere RNA (x axis) versus PrP (y axis), reduction measured by ELISA in groups of n = 6 naive rats harvested at 4 weeks after dosing. (E) Whole hemisphere PrP (x axis) reduction versus CSF PrP (y axis) in the same rats. (F–J) CSF and brain samples from (E) analyzed by MRM, with the 5 rat PrP peptides arranged from N-terminal (F) to C-terminal (J). Peptide sequences and residue numbers are noted above each plot. In every panel, crosshairs represent the mean and 95% confidence interval of the mean on both dimensions.

References

    1. Prusiner SB. Prions. Proc Natl Acad Sci U S A. 1998;95(23):13363–13383. doi: 10.1073/pnas.95.23.13363. - DOI - PMC - PubMed
    1. Büeler H, et al. Mice devoid of PrP are resistant to scrapie. Cell. 1993;73(7):1339–1347. doi: 10.1016/0092-8674(93)90360-3. - DOI - PubMed
    1. Vallabh SM, et al. Towards a treatment for genetic prion disease: trials and biomarkers. Lancet Neurol. 2020;19(4):361–368. doi: 10.1016/S1474-4422(19)30403-X. - DOI - PubMed
    1. Nazor Friberg K, et al. Intracerebral infusion of antisense oligonucleotides into prion-infected mice. Mol Ther Nucleic Acids. 2012;1(2):e9. - PMC - PubMed
    1. Raymond GJ, et al. Antisense oligonucleotides extend survival of prion-infected mice. JCI Insight. 2019;5(16):131175. - PMC - PubMed