. 2022 Jul 29;145(7):2332-2346.
doi: 10.1093/brain/awac037.

AMPK-mediated potentiation of GABAergic signalling drives hypoglycaemia-provoked spike-wave seizures

Affiliations

AMPK-mediated potentiation of GABAergic signalling drives hypoglycaemia-provoked spike-wave seizures

Kathryn A Salvati et al. Brain. .

Abstract

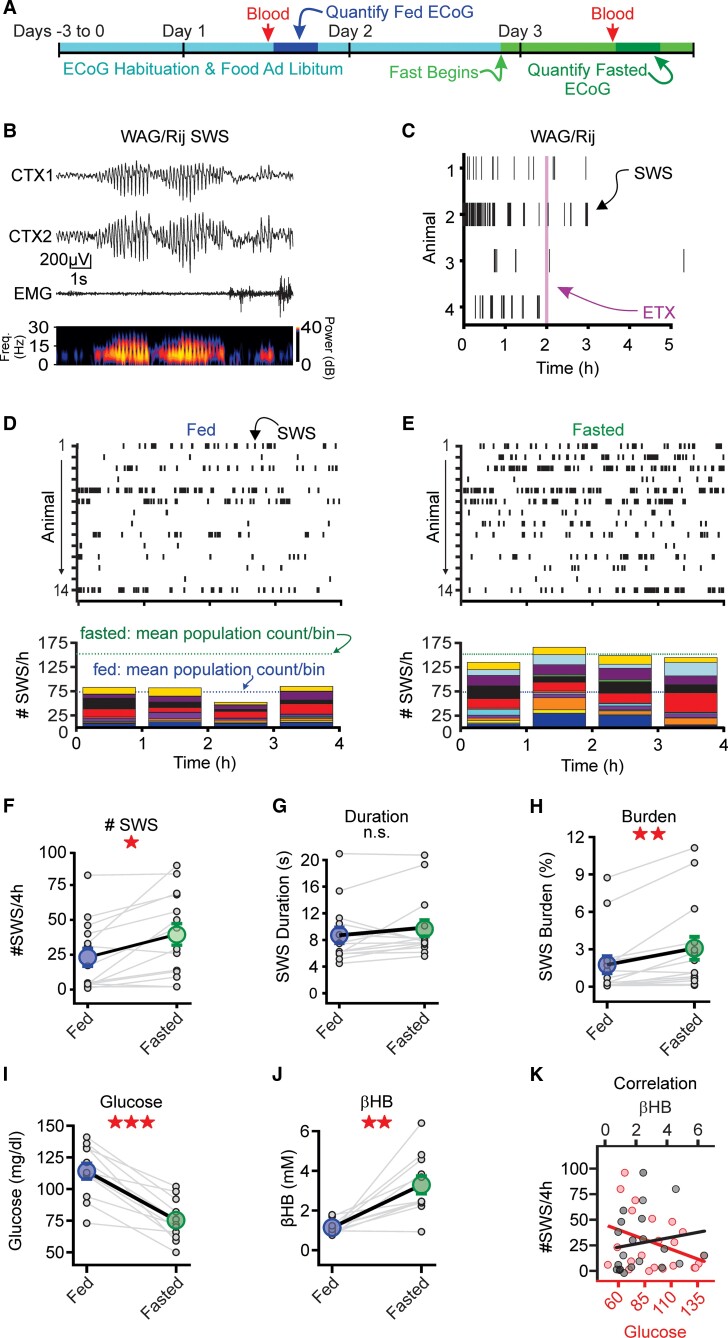
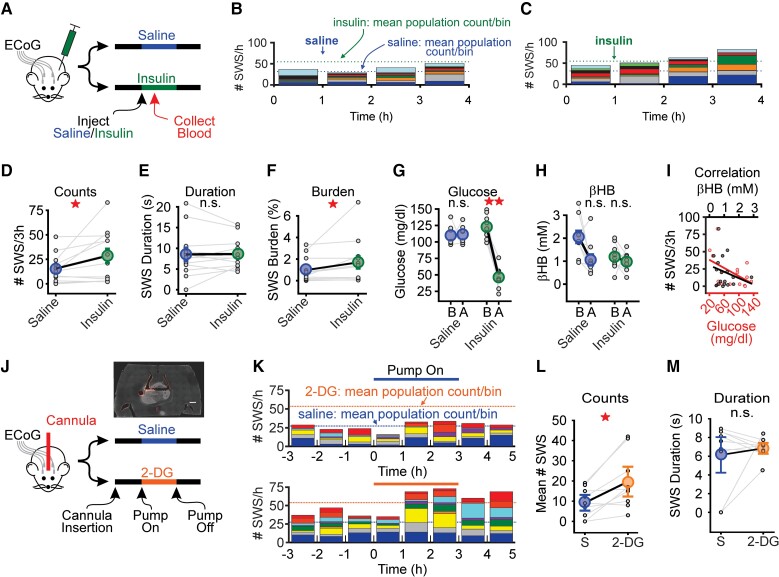
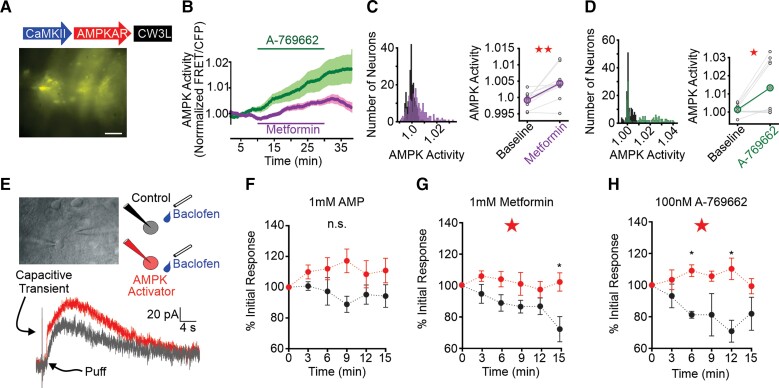
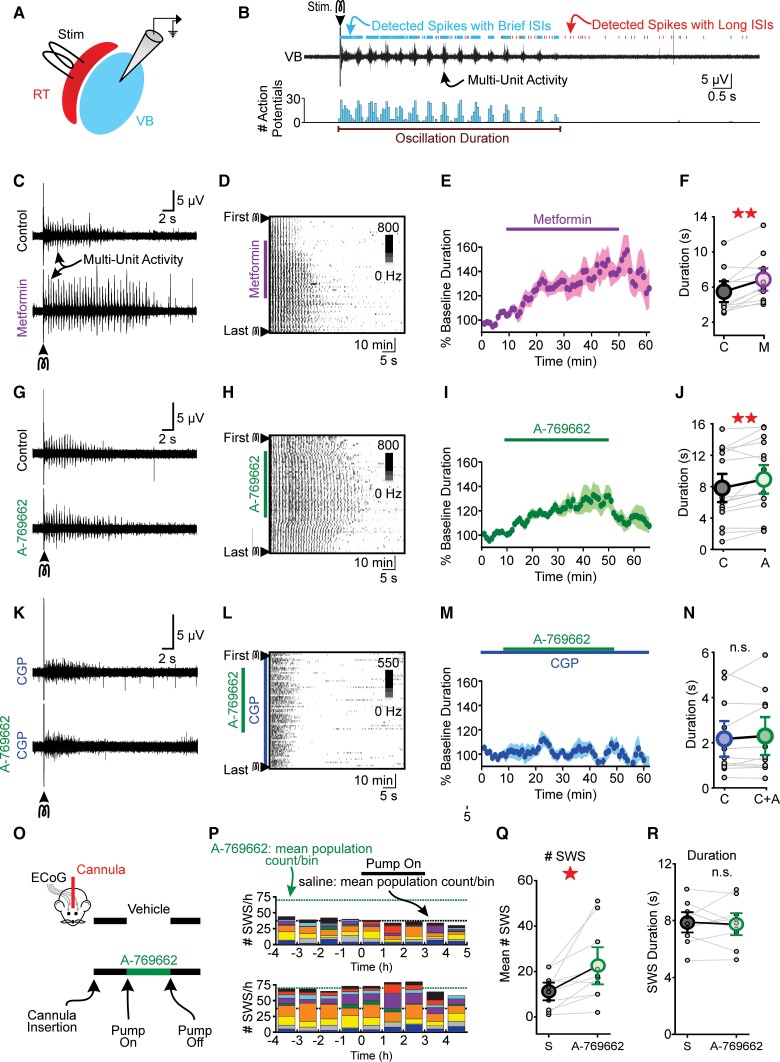
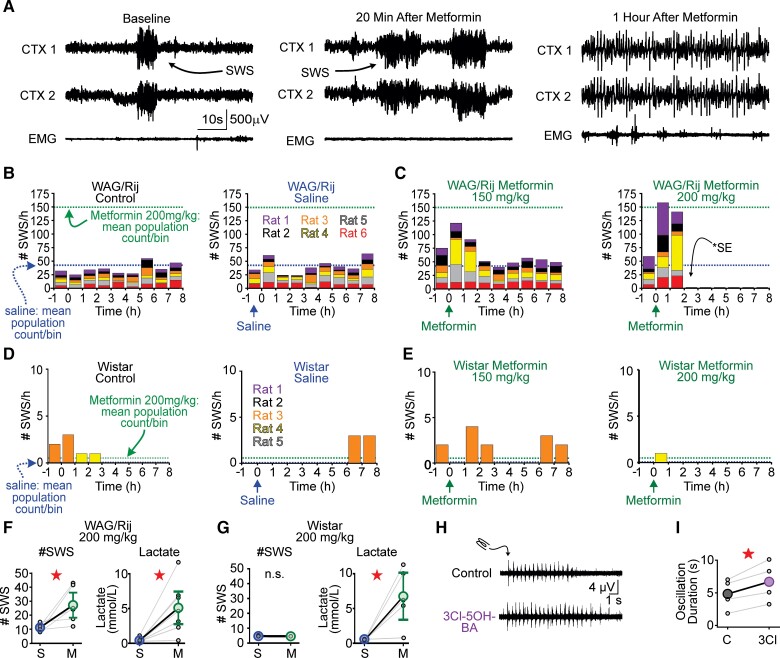
Metabolism regulates neuronal activity and modulates the occurrence of epileptic seizures. Here, using two rodent models of absence epilepsy, we show that hypoglycaemia increases the occurrence of spike-wave seizures. We then show that selectively disrupting glycolysis in the thalamus, a structure implicated in absence epilepsy, is sufficient to increase spike-wave seizures. We propose that activation of thalamic AMP-activated protein kinase, a sensor of cellular energetic stress and potentiator of metabotropic GABAB-receptor function, is a significant driver of hypoglycaemia-induced spike-wave seizures. We show that AMP-activated protein kinase augments postsynaptic GABAB-receptor-mediated currents in thalamocortical neurons and strengthens epileptiform network activity evoked in thalamic brain slices. Selective thalamic AMP-activated protein kinase activation also increases spike-wave seizures. Finally, systemic administration of metformin, an AMP-activated protein kinase agonist and common diabetes treatment, profoundly increased spike-wave seizures. These results advance the decades-old observation that glucose metabolism regulates thalamocortical circuit excitability by demonstrating that AMP-activated protein kinase and GABAB-receptor cooperativity is sufficient to provoke spike-wave seizures.

Keywords: AMPK; GABA; epilepsy; metabolism; thalamocortical.


Figures

Figure 1
Figure 1
Overnight fasting increases spike-and-wave discharges. (A) Seizure activity was evaluated for multiple days. Animals had access to food ad libitum before the overnight fast on Day 3. Before control and fasting experiments, blood was drawn for glucose and β-hydroxybutyrate (βHB) measurements. (B) Top: Representative SWS from a WAG/Rij rat (right). CTX1 and CTX2 are cortical ECoG recordings while EMG recording is from the neck. EMG activity was suppressed during the SWS, corresponding to behavioural arrest. Bottom: Spectrograms from CTX1 showing increased power in the 5–8 Hz frequency band during the SWS. (C) Ethosuximide (ETX; 200 mg/kg) suppressed SWSs in the WAG/Rij rat. Purple line indicates intraperitoneal injection of ETX. (D and E) Top: SWS rasters during fed (D) and fasted (E) conditions in rats (n = 13). Bottom: Stacked histograms showing hourly SWS count for each rat during fed and fasted conditions. Blue and green dashed lines represent mean of the total SWS count per bin during fed and fasted conditions, respectively. (FH) Fasting increased SWS count, duration and burden. (I and J) Fasting decreased blood glucose and increased β-hydroxybutyrate, relative to the fed state (n = 11). (K) Blood glucose (red) or serum β-hydroxybutyrate (black) versus SWS count. For each panel, small circles represent data from one animal, while large circles represent the sample mean (±SE). *P < 0.05, **P < 0.01, ***P < 0.001, not significant (n.s.) from the Wilcoxon sign rank test. See Supplementary Table 1 for details.
Figure 2
Figure 2
Elevated SWS count tracks with low blood glucose. (A) Animals received either saline or insulin (3 IUs) 1 h into a 4-h recording session (n = 12). Blood was collected at 90 min post-injection for glucose and serum β-hydroxybutyrate (βHB) analysis. (B and C) Stacked histograms showing SWS counts for WAG/Rij rats after saline (B) or insulin (C) injection. Blue dashed lines represent the mean total SWS count per bin after saline. Green dashed lines represent the mean total SWS count per bin after insulin. (DF) Insulin increased mean SWS count and burden, but not duration, relative to saline injection. If an animal did not have SWSs, then duration was defined as zero. (G and H) In rats, insulin significantly decreased blood glucose but had no effect on serum β-hydroxybutyrate concentration. B = before injection; A = after injection. (I) Plot comparing SWS count to blood glucose (red) and serum β-hydroxybutyrate (black) in rats (n = 9). (J) Rats implanted with ECoG electrodes and unilateral cannulae in somatosensory thalamus received either saline or 2-DG on separate days. Pump was automatically turned on after a 4-h baseline recording and turned off 3 h later. Inset shows example of cannula placement in thalamus. A 100-µm horizontal section from rat following injection of DiI (scale = 1 mm). (K) Stacked histograms showing SWS count per hour for saline infusion (top) and 2-DG (bottom). Blue and orange dotted lines represent the mean of the total SWS count per bin during the infusion of saline and 2-DG, respectively. (L and M) 2-DG infusion increased mean SWS count during the infusion period (i.e. 0–3 h) whereas duration was unaffected. In each panel, small circles represent data from one animal, whereas large circles represent the sample mean (±SE). *P < 0.05, **P < 0.01, not significant (n.s.) from Wilcoxon sign rank test or paired t-test. See Supplementary Table 2 for details.
Figure 3
Figure 3
Thalamic p-AMPK expression and GIRK currents following AMPK activation. (A) Thalamocortical neuron AMPKAR expression based on construct developed by Tsou et al. and Konagaya et al. Scale bar = 50 µM. (B) Thalamocortical neuron AMPKAR FRET efficiency increased during application of metformin (10 mM, purple), A-769662 (100 nM, green). FRET values are normalized to the 3-min baseline period prior to drug application. (C) Histogram (left) of FRET values for all neurons during baseline (black) and metformin (purple) application. Pairwise comparison (right) of mean FRET per slice in baseline and metformin application. (D) Histogram of FRET values (left) and mean pairwise comparisons (right) for A-769662 application. See Supplementary Table 3 for data values. (E) Top left: Whole-cell patch-clamp recording in an acute thalamic brain slice. Baclofen application pipette is on the right. Top right: Schematic of experiment. Whole-cell patch-clamp recordings were performed using recording pipettes containing either control internal solution (black) or internal solution supplemented with an AMPK activator (red). A second pipette, placed proximal to the patched neuron, contained 100 µM baclofen (blue). Bottom: Representative traces of evoked GABAB currents with recording pipette containing AMPK activator (grey, t = 3 min; red, t = 9 min). Arrows point to capacitive transient of a voltage-step used to measure access resistance and puff onset. (F) AMP (1 mM) stabilized, but did not significantly mitigate (P = 0.06), GABAB-receptor current rundown. (G) Metformin (1 mM) significantly prevented GABAB current rundown relative to control. (H) A-769662 (100 nM) similarly attenuated GABAB current rundown relative to control. For FH, response amplitude of GABAB-receptor mediated K+ current was normalized to the current amplitude at 3 min (t = 1); data are mean ± SE; *P < 0.05. Repeated-measures two-way ANOVA; unpaired t-test for pairwise comparison. See Supplementary Table 3 for details.
Figure 4
Figure 4
AMPK activators intensify thalamocortical oscillations in vitro and SWS in vivo. (A) Thalamocortical oscillations were electrically evoked in acute brain slices containing reticular thalamus (RT) and ventrobasal nucleus (VB) thalamus. (B) Top: A single stimulus evoked seconds-long bursting activity in ventrobasal nucleus that was evaluated by measuring interspike intervals (see ‘Materials and methods’ section). Bottom: Histogram of detected spikes. Bin size = 100 ms. (C) Representative oscillations and (D) spike raster during control and 5 mM metformin. Oscillations were evoked once every 60 s in the presence of bicuculline. (E) Normalized oscillation duration versus time for all metformin experiments. Durations were normalized to baseline values per slice. (F) Co-application of metformin increased oscillation duration relative to baseline. (G) Representative oscillations and (H) spike raster during control (bicuculline) and 10 µM A-769662 co-application. (I) Normalized oscillation duration versus time for all A-769662 experiments. (J) A-769662 increased oscillation duration relative to baseline. (K) Representative oscillations and (L) spike raster during control (20 nM CGP-54626) and 20 nM CGP-54626 + 10 µM A-769662. Blocking GABAB receptors with CGP resulted in briefer and more disorganized spiking activity. (M) Normalized oscillation duration versus time for all CGP experiments. (N) Mean duration of evoked activity was not different between CGP-54626 and CGP-54626 + A-769662 co-application. (O) Direct infusion of A-769662 in somatosensory thalamus increased SWSs. WAG/Rij rats implanted with ECoG electrodes and unilateral cannulae in somatosensory thalamus received either saline or 10 µM A-769662 for 3-h on separate days. (P) Stacked histograms showing SWS counts for each animal [saline (top) and A-769662 (bottom)]. Black and green dotted lines represent mean of the total SWS count per bin after infusion start for saline and A-769662, respectively. (Q) A-769662 infusion increased mean SWS count during the infusion period (i.e. 0–3 h) but not (R) SWS duration. All data are represented as mean ± SE. *P < 0.05, ** P < 0.01, not significant (n.s.) from paired student’s t-test or Wilcoxon sign rank test. Each circle in the figure represents one slice (CN) or animal (QR). See Supplementary Table 4 for details.
Figure 5
Figure 5
Metformin elevates SWSs and can cause status epilepticus in WAG/Rij rats. (A) Representative recording of WAG/Rij rat injected with 200 mg/kg metformin. Left: ECoG/EMG activity before metformin injection. Arrow indicates spontaneous SWS. Middle: At 20 min after metformin injection, SWSs occurred frequently and marked the beginning of continual SWSs. Right: ECoG/EMG recording 1 h after metformin injection, wherein the transition from SWSs to convulsive status epilepticus (SE) has occurred. Heightened muscle activity is recorded in the EMG, consistent with motor activity induced by tonic-clonic seizures. (B) WAG/Rij rat SWS counts for control and saline. (C) SWS counts in same WAG/Rij rats after 150 mg/kg and 200 mg/kg metformin. Stacked histograms showing SWS counts per animal for all conditions. Dotted lines indicate the mean of the total SWS count per bin following saline (blue) and 200 mg/kg metformin (green) injection, respectively. (D) Non-epileptic Wistar rat SWS counts for control and saline. (E) Wistar rat SWS counts in stacked histogram format for 150 and 200 mg/kg metformin. (F) Injection with 200 mg/kg metformin increased WAG/Rij SWS counts, while lactate (mmol/l) levels trended higher. (G) Injection with 200 mg/kg metformin did not evoke any seizure activity in Wistar rats despite comparable changes in lactate (mmol/l). (H) Representative multi-unit recordings of evoked thalamocortical oscillations in ventrobasal nucleus (VB) thalamus following electrical stimulation of reticular thalamus (RT). Top: Control trace showing oscillation evoked during baseline conditions. Bottom: Oscillation evoked during 3Cl-5OH-BA application. (I) 3Cl-5OH-BA significantly prolonged the duration of evoked oscillations. In each panel, data are presented as mean ± SE. Each dot represents one animal (F and G) or slice (I). *P < 0.05 or not significant (n.s.) from paired, t-test or Wilcoxon sign rank pairwise comparison. See Supplementary Table 5 for details.

References

    1. Huguenard JR, McCormick DA. Thalamic synchrony and dynamic regulation of global forebrain oscillations. Trends Neurosci. 2007;30(7):350–356. - PubMed
    1. McCafferty C, David F, Venzi M, et al. . Cortical drive and thalamic feed-forward inhibition control thalamic output synchrony during absence seizures. Nat Neurosci. 2018;21(5):744–756. - PMC - PubMed
    1. Kandel A, Buzsáki G. Cellular–synaptic generation of sleep spindles, spike-and-wave discharges, and evoked thalamocortical responses in the neocortex of the rat. J Neurosci. 1997;17(17):6783–6797. - PMC - PubMed
    1. Avoli M. A brief history on the oscillating roles of thalamus and cortex in absence seizures. Epilepsia. 2012;53(5):779–789. - PMC - PubMed
    1. Beenhakker MP, Huguenard JR. Neurons that fire together also conspire together: Is normal sleep circuitry hijacked to generate epilepsy? Neuron. 2009;62(5):612–632. - PMC - PubMed

Publication types

Substances