. 2022 Apr 21;139(16):2471-2482.
doi: 10.1182/blood.2021015161.

Unbiased cell surface proteomics identifies SEMA4A as an effective immunotherapy target for myeloma

Affiliations

Unbiased cell surface proteomics identifies SEMA4A as an effective immunotherapy target for myeloma

Georgina S F Anderson et al. Blood. .

Abstract

The accessibility of cell surface proteins makes them tractable for targeting by cancer immunotherapy, but identifying suitable targets remains challenging. Here we describe plasma membrane profiling of primary human myeloma cells to identify an unprecedented number of cell surface proteins of a primary cancer. We used a novel approach to prioritize immunotherapy targets and identified a cell surface protein not previously implicated in myeloma, semaphorin-4A (SEMA4A). Using knock-down by short-hairpin RNA and CRISPR/nuclease-dead Cas9 (dCas9), we show that expression of SEMA4A is essential for normal myeloma cell growth in vitro, indicating that myeloma cells cannot downregulate the protein to avoid detection. We further show that SEMA4A would not be identified as a myeloma therapeutic target by standard CRISPR/Cas9 knockout screens because of exon skipping. Finally, we potently and selectively targeted SEMA4A with a novel antibody-drug conjugate in vitro and in vivo.


Conflict of interest statement

Conflict-of-interest disclosure: A patent application has been filed in relation to this work. J.E.T. received an honorarium from Gilead for speaking at an educational meeting. M.A.C. was on an advisory board for Bristol Myers Squibb. The remaining authors declare no competing financial interests.

Figures

None
Graphical abstract
Figure 1
Figure 1
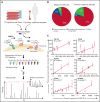
Plasma membrane profiling (PMP) of primary samples and cell lines leads to quantification of the cell surface proteome in myeloma at high coverage. (A) PMP overview. Ten human myeloma cell lines (HMCL) were profiled in a 10-plex and 8 primary myeloma samples plus 2 repeat HMCL were profiled in a second 10-plex. Sugar residues were oxidized with sodium periodate (NaIO4) to form aldehydes, which were then treated with aminooxy-biotin resulting in biotinylation via stable oxime bonds. This was followed by streptavidin pull-down, tandem mass tag (TMT) labeling, and mass spectrometry (MS3). (B) Identified proteins were annotated as plasma membrane proteins, as endogenously biotinylated contaminants, or unrecognized as plasma membrane proteins. Proportions within the pie charts refer to protein abundance. (C) Comparison of protein quantification by flow cytometry and PMP. Relative protein abundance by TMT labeling and mass spectrometry in arbitrary units (AU; x-axis) is compared with protein abundance by median fluorescence intensity (MFI) as determined by flow cytometry with validated antibodies relative to isotype control (y-axis). Error bars are ±SD of biological replicates; n = 3. *P < .05; **P < .01; ***P < .001; ****P < .0001.
Figure 2
Figure 2
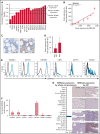
Prioritization of immune therapy targets leads to the identification of SEMA4A as a potential ADC target in myeloma. (A) Expression of SEMA4A by plasma membrane profiling (PMP) in myeloma cell lines and primary myeloma cells. Log relative expression is standardized to the range 0 to 1 for each sample. The median expressions of SLAMF7 (the target of elotuzumab), CD38 (the target of daratumumab), and BCMA (the target of CAR T cells) are also indicated. (B) Comparison of SEMA4A expression by flow cytometry and by PMP. Relative protein abundance by tandem mass tag labeling and mass spectrometry in arbitrary units (AU; x-axis) is compared with protein abundance by median fluorescence intensity (MFI) as determined by flow cytometry with the SEMA4A 5E3 clone antibody relative to isotype control (y-axis). Error bars are ±SD of biological replicates; n = 3. (C) Representative images of healthy (non–multiple myeloma [MM]) and MM bone marrow after duplex immunohistochemistry staining with CD138 (yellow) and SEMA4A (purple). CD138+ cells in the non-MM bone marrow are indicated by arrows. (D) Comparison of SEMA4A expression by flow cytometry in CD138+ cells in non-MM (n = 3) and in MM (n = 5) as described in panel B. (E) Representative histograms of flow cytometric profiling of SEMA4A expression in hematopoietic cells from a single patient. Markers used are CD66b (granulocytes), CD14 (monocytes), CD138 (myeloma cells), CD3 (T cells), CD19 (B cells), and CD34 (primitive hematopoietic cells). Black lines show intensity of isotype control, and blue lines show the intensity of SEMA4A. (F) Summary of the flow cytometric profiling of hematopoietic cells as shown in panel E. SEMA4A expression for each patient was calculated as the MFI of the 5E3 clone relative to the isotype control and then normalized to SEMA4A expression on CD19+ cells; n = 12. (G) Expression of SEMA4A in normal healthy tissues by whole-cell proteomic profiling (Human Proteome Map, www.humanproteomemap.org; left) and by tissue microarray (Human Protein Atlas, proteinatlas.org; right). NK, natural killer. ***P < .001.
Figure 3
Figure 3
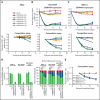
Expression of shRNA against SEMA4A is associated with reduced growth in myeloma cells but not K562 erythroleukemia cells. The erythroleukemia cell line, K562 (A), and the human myeloma cell lines, NCI-H929 (B) and MM1.S (C), were lentivirally transduced with six shRNA predicted to target SEMA4A plus a control shRNA directed against luciferase (shLUC). All shRNA vectors expressed GFP. Transduction efficiency was deliberately maintained at ∼50%. Top panels: SEMA4A expression was measured at the cell surface by flow cytometry and is expressed relative to expression in GFP-negative (GFP-) cells. K562 cells do not express SEMA4A, and thus expression is not shown. Bottom panels: GFP-positive (GFP+)/total cell ratio was measured from day 4 after transduction. GFP+/total cell ratio is then plotted relative to that ratio at day 4 and normalized to the ratio for the control hairpin, shLUC. Error bars indicate ±SD from a minimum of 2 replicates for each shRNA. (D) MM1.S, NCI-H929, and NCI-H929 Cas9 were lentivirally transduced as described in panel A with a control (shLUC/sgNone) or shRNA/sgRNA targeting SEMA4A. Left panel: at 144 hours' post–viral transduction, SEMA4A expression was measured at the cell surface by flow cytometry and is expressed relative to expression in untransduced cells (UT). Right: Cell viability was also assessed by flow cytometry to determine the percentages of dead (Annexin V and LIVE/DEAD Fixable Violet positive), early apoptotic (Annexin V positive and LIVE/DEAD Fixable Violet negative), and alive (Annexin V and LIVE/DEAD Fixable Violet negative) cells. A one-way analysis of variance comparing MM1.S alive cells F(3,8) = 42.45, P < .0001, NCI-H929 alive cells F(3,8) = 101.2, P < .0001, and NCI-H929 Cas9 alive cells F(3,8) = 56.84, P < .0001 was performed. Dunnett's multiple comparisons correction is shown. (E) NCI-H929 constitutively expressing Cas9 were lentivirally transduced with sgRNA targeting exon six of SEMA4A (sgSEMA4A) or a nontargeting control sgRNA (sgNone). All sgRNA vectors expressed blue fluorescent protein (BFP), and transduction efficiency was deliberately maintained at ∼50%. After lentiviral transduction, cells were cultured ± the stromal cell line, HS5, or were supplemented ± interleukin-6 (IL-6). The BFP-positive (BFP+)/total cell ratio was measured from day 4 after transduction and is plotted relative to proportion at day 4 and normalized to the ratio of each control sgRNA, sgNone. Error bars are ±SD of replicates; n = 3. **P < .01; ***P < .001; ****P < .0001. NS, not significant.
Figure 4
Figure 4
SEMA4A antibody is internalized in a temperature-dependent manner and localizes to the lysosomal compartment. (A) Immunofluorescence microscopy in NCI-H929 cells demonstrating localization of SEMA4A (green) and lysosomal-associated membrane protein 1 (LAMP-1) (red) before and after 3 hours of incubation at 37°C. Below the photomicrographs are plots showing fluorescence intensity as a function of distance from a reference point and confirming colocalization of SEMA4A with LAMP-1 after incubation. (B) Flow cytometry of NCI-H929 cells exhibiting the dynamics of SEMA4A internalization, as indicated by loss of antibody from the cell surface over time when cultured at 37°C but not at 4°C. (C) Histogram of cells from panel B, at the beginning and end of the time course. Internalization of SEMA4A from the cell surface affects the entire cell population. IgG1, immunoglobulin G1.
Figure 5
Figure 5
ADCs against SEMA4A are potent and selective in vitro. (A) Fab-ZAP assay in NCI-H929 cells, MM1.S cells, and K562 cells, which do not express SEMA4A, as a control. Cells were incubated with Fab-ZAP alone or with clone 5E3 anti-SEMA4A or with an isotype control. Cell viability was measured by XTT assay at 72 hours. (B) Linker chemistry for 5E3-vedotin and 5E3-emtansine. (C) Dose–response curves for 5E3-vedotin and 5E3-emtansine in NCI-H929 and MM1.S cells. Citrate buffer was used as a control. Cell viability was measured by XTT assay at 72 hours. IC50 values are specified, where the calculation was possible. NR = IC50 was not reached. (D) NCI-H929 and MM1.S cells were treated with media only, citrate buffer (vehicle), 10 nM trastuzumab-vedotin (TRA-vedotin), 10 nM 5E3-vedotin, or 10 nM bortezomib (BTZ) and incubated with IncuCyte Caspase-3/7 apoptosis assay reagent for 72 hours and imaged by using an IncuCyte Live Cell Analysis system. (E) NCI-H929 cells were cocultured ± HS5 and treated with vehicle or dexamethasone (DEXA, 10 µM) for 72 hours. Total cell counts were determined by using Flow-Count Fluorospheres (Beckman Coulter) by flow cytometry and normalized to media-treated controls. (F) NCI-H929 were cocultured with HS5 and treated with either vehicle or 5E3-vedotin. Cell counts were determined as in panel E at 72 hours. CD138+ cells (G) or CD14+ cells (H) from myeloma patients were isolated by using microbeads (Miltenyi Biotec) and incubated with vehicle or 5E3-vedotin. Cell viability was measured by CellTiter-Glo or Annexin V and LIVE/DEAD staining by flow cytometry. Error bars indicate ±SD of a minimum of 3 replicates.
Figure 6
Figure 6
An ADC against SEMA4A is potent in vivo. (A) Xenograft model to test in vivo efficacy of 5E3-vedotin. Mice were injected with MM1.S-luciferase or JK-6L luciferase cells by tail vein injection at day −13 and established disease confirmed by luciferase intensity, measured by using an in vitro imaging system. 5E3-vedotin was injected via the tail vein at 4 mg/kg twice weekly for a total of 4 doses on days 0, 2, 6, and 9. Controls were trastuzumab-vedotin (isotype; TRA-vedotin) and nonconjugated 5E3 antibody. Mice were imaged weekly and at euthanasia. (B) Luciferase intensity in the regions of interest (ROI) of the JK-6L model before dosing, exhibiting similar disease dissemination levels between treatment and control arms. (C) Time course of luciferase intensity for the same study as in panel B. ROI intensity was normalized to the baseline ROI (week 0) for each mouse. (D) Luciferase intensity in the ROI of the MM1.S model before dosing. (E) Time course of luciferase intensity for the same study as in panel D. ROI intensity was normalized to the baseline ROI (week 0) for each mouse. (F) Images of luciferase intensity of the MM1.S model. (G) Kaplan-Meier curve for the MM1.S model comparing survival of mice in the 5E3-vedotin treatment group vs that of mice in the control groups. Survival was significantly increased in the treatment group compared with isotype control (Cox proportional hazards model, P = .0004). Error bars are ±SD.

Comment in

References

    1. Weekes MP, Tan SY, Poole E, et al. Latency-associated degradation of the MRP1 drug transporter during latent human cytomegalovirus infection. Science. 2013;340(6129):199–202. - PMC - PubMed
    1. Weekes MP, Tomasec P, Huttlin EL, et al. Quantitative temporal viromics: an approach to investigate host-pathogen interaction. Cell. 2014;157(6):1460–1472. - PMC - PubMed
    1. Bausch-Fluck D, Hofmann A, Bock T, et al. A mass spectrometric-derived cell surface protein atlas. PLoS One. 2015;10(3):e0121314. - PMC - PubMed
    1. Lee JK, Bangayan NJ, Chai T, et al. Systemic surfaceome profiling identifies target antigens for immune-based therapy in subtypes of advanced prostate cancer. Proc Natl Acad Sci USA. 2018;115(19):E4473–E4482. - PMC - PubMed
    1. Ali SA, Shi V, Maric I, et al. T cells expressing an anti-B-cell maturation antigen chimeric antigen receptor cause remissions of multiple myeloma. Blood. 2016;128(13):1688–1700. - PMC - PubMed

Publication types