. 2022 May;162(6):1716-1731.e17.
doi: 10.1053/j.gastro.2022.01.046. Epub 2022 Feb 5.

Helicobacter pylori-induced RASAL2 Through Activation of Nuclear Factor-κB Promotes Gastric Tumorigenesis via β-catenin Signaling Axis

Affiliations

Helicobacter pylori-induced RASAL2 Through Activation of Nuclear Factor-κB Promotes Gastric Tumorigenesis via β-catenin Signaling Axis

Longlong Cao et al. Gastroenterology. 2022 May.

Abstract

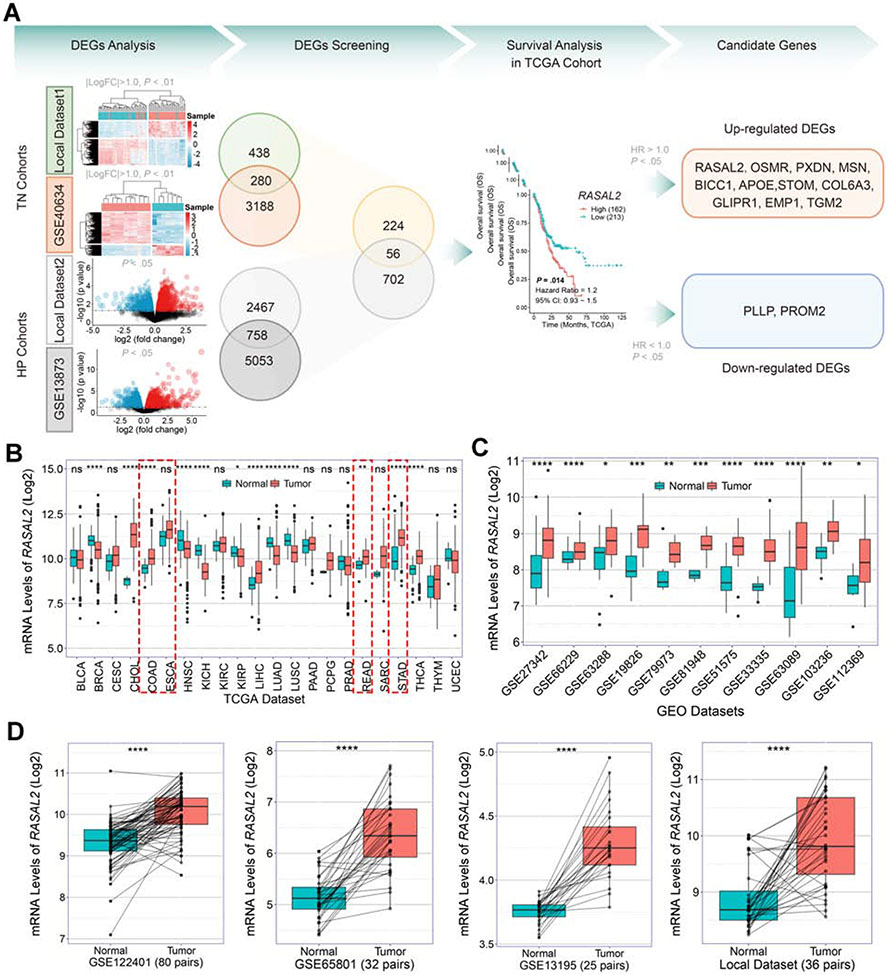
Background & aims: Helicobacter pylori infection is the predominant risk factor for gastric cancer. RAS protein activator like 2 (RASAL2) is considered a double-edged sword in carcinogenesis. Herein, we investigated the role of RASAL2 in response to H pylori infection and gastric tumorigenesis.

Methods: Bioinformatics analyses of local and public databases were applied to analyze RASAL2 expression, signaling pathways, and clinical significance. In vitro cell culture, spheroids, patient-derived organoids, and in vivo mouse models were used. Molecular assays included chromatin immunoprecipitation, co-immunoprecipitation, Western blotting, quantitative polymerase chain reaction, and immunocyto/histochemistry.

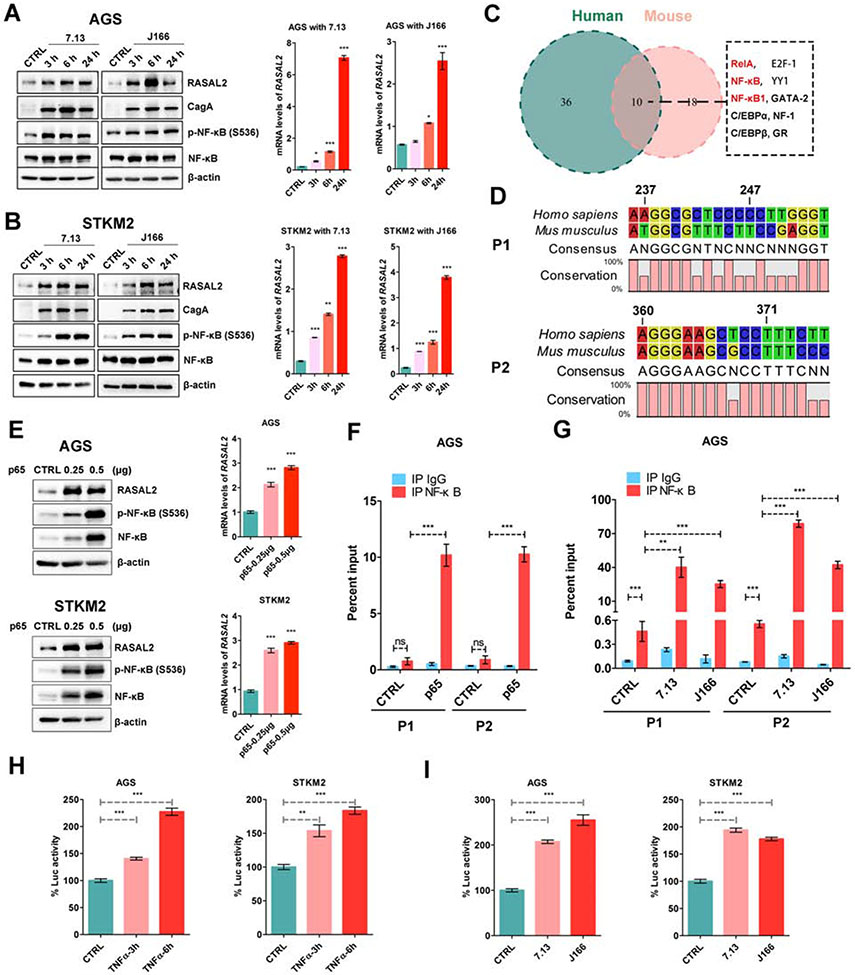
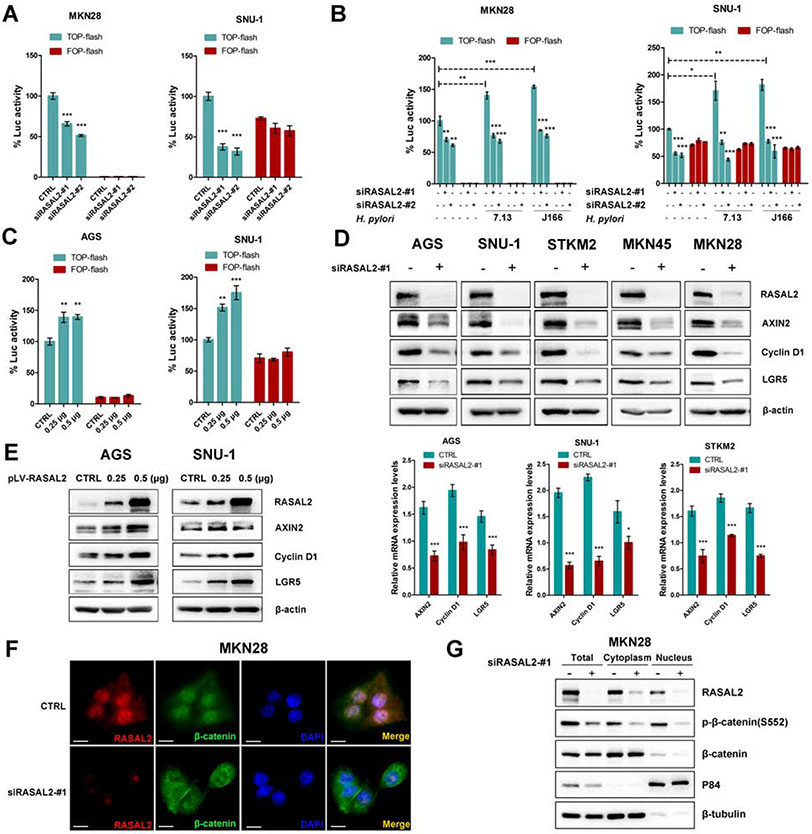
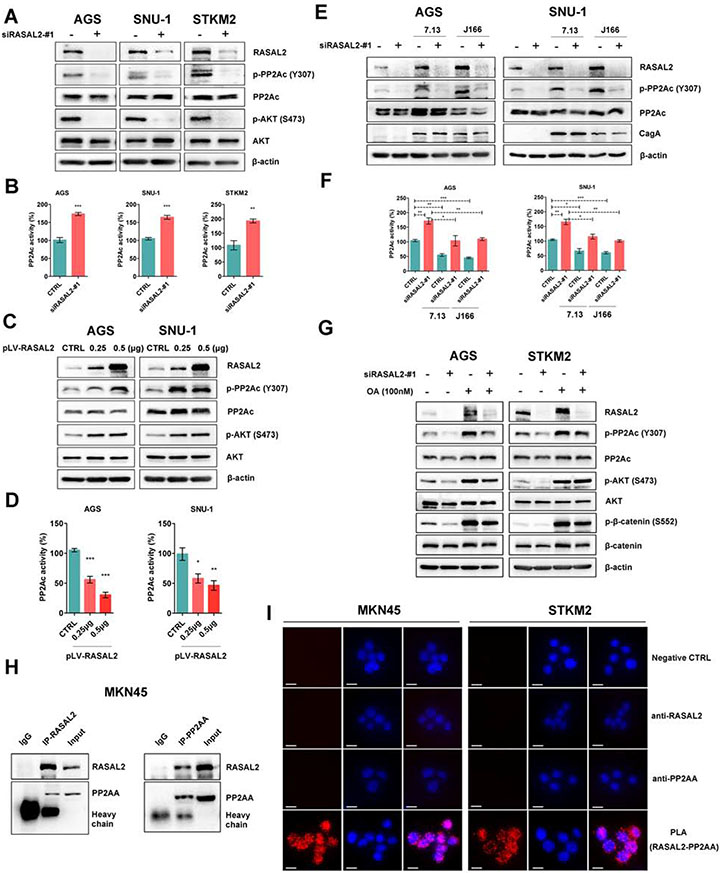
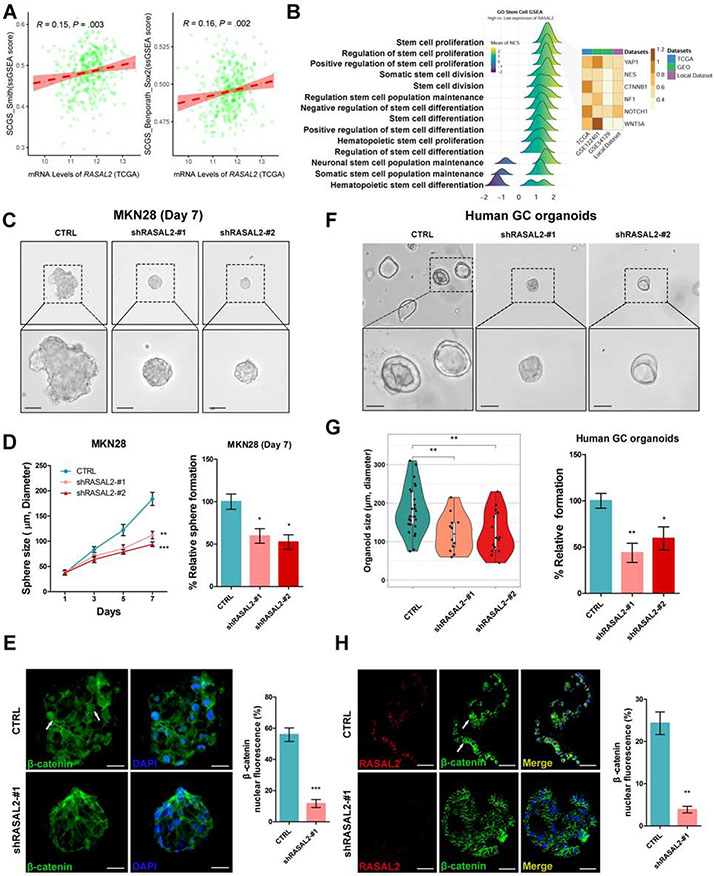
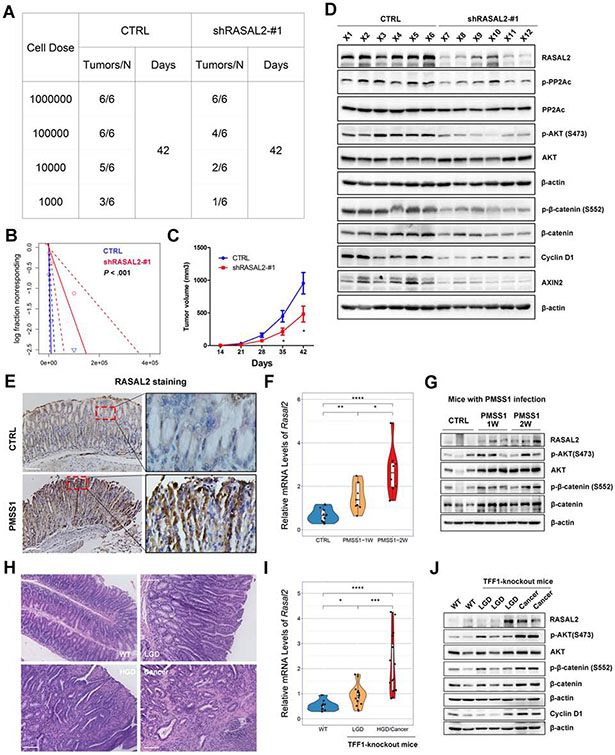
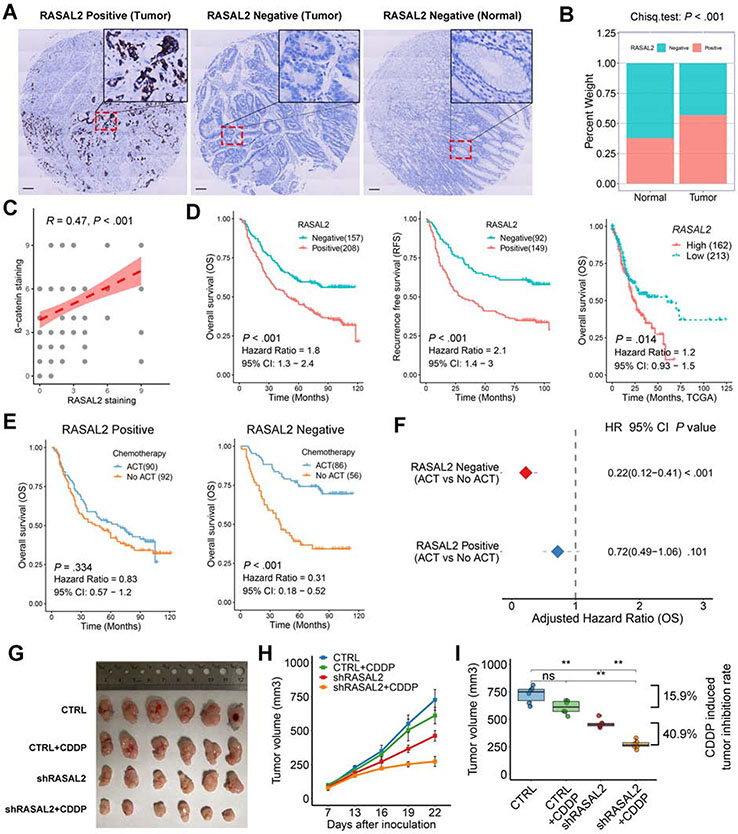
Results: H pylori infection induced RASAL2 expression via a nuclear factor-κB (NF-κB)-dependent mechanism whereby NF-κB was directly bound to the RASAL2 promoter activating its transcription. By gene silencing and ectopic overexpression, we found that RASAL2 upregulated β-catenin transcriptional activity. RASAL2 inhibited protein phosphatase 2A activity through direct binding with subsequent activation of the AKT/β-catenin signaling axis. Functionally, RASAL2 silencing decreased nuclear β-catenin levels and impaired tumor spheroids and organoids formation. Furthermore, the depletion of RASAL2 impaired tumor growth in gastric tumor xenograft mouse models. Clinicopathological analysis indicated that abnormal overexpression of RASAL2 correlated with poor prognosis and chemoresistance in human gastric tumors.

Conclusions: These studies uncovered a novel signaling axis of NF-κB/RASAL2/β-catenin, providing a novel link between infection, inflammation and gastric tumorigenesis.

Keywords: Gastric Cancer; Helicobacter pylori; RASAL2; Tumorigenesis; β-catenin.


Figures

Figure 1.
Figure 1.. Overexpression of RASAL2 in gastric cancer samples
(A) Analyses of the whole-transcriptome sequencing datasets and two Gene Expression Omnibus (GEO) datasets from tumor-vs.-normal (TN) cohorts and H. pylori infection (HP) cohorts. Hierarchical clustering heatmap and volcano plots of significant differential expression genes (DEGs) were shown in DEGs Analysis. Overlapping TN cohorts and HP cohorts identified 56 DEGs. Survival analysis of the 56 DEGs was performed in TCGA cohort and the genes with the significance levels (∣HR∣ > 1.0 and P < .05) were identified as candidate genes. (B) Analyses of TCGA pan-cancer database displayed diverse mRNA expression patterns of RASAL2 in different cancer types; ns indicates no significance, *P < .05, **P < .01, ****P < .0001. (C) Analyses of public GEO datasets showed that the mRNA expression levels of RASAL2 were consistently elevated in gastric cancers compared to normal samples; *P < .05, **P < .01, ***P < .001, ****P < .0001. (D) The mRNA expression levels of RASAL2 were examined in the paired tumor and adjacent non-tumor tissues from the GEO datasets and our local cohort; ****P < .0001.
Figure 2.
Figure 2.. H. pylori infection transcriptionally regulated RASAL2 expression through NF-κB
(A and B) Western blot and quantitative real-time (qRT) PCR analysis of RASAL2 in AGS and STKM2 cells following H. pylori infection; *P < .05, **P < .01, ***P < .001. (C) The transcription factor binding sites were predicted by the PROMO website using a 600bp conserved segment of RASAL2 promoter. (D) A conserved sequence of two putative NF-κB binding sites (P1 and P2) with higher JASPAR scores in humans and mice. (E) Western blot and qRT-PCR analysis of RASAL2 in AGS and STKM2 cells with and without transient expression of NF-κB (p65); ***P < .001. (F and G) Chromatin immunoprecipitation (ChIP) assay using NF-κB antibody was performed, followed by qPCR applying primers covering P1 and p2 region; ns, no significance, **P < .01, ***P < .001. AGS cells with P65 transient expression (F). AGS cells with infection of the two H. pylori strains (7.13 and J166) (G). (H and I) RASAL2 promoter luciferase reporter assays were performed in AGS and STKM2 cell lines with TNFα treatment (H) or H. pylori infection (7.13 and J166, I); **P < .01, ***P < .001.
Figure 3.
Figure 3.. H. pylori infection induced β-catenin transcriptional activity in a RASAL2-dependent manner
(A - C) β-catenin luciferase reporter assays. TOP-flash contains wild-type TCF binding sites. FOP-flash, containing mutated TCF binding sites (negative control); *P < .05, **P < .01, ***P < .001. (A) Gastric cancer cells were transfected with two independent RASAL2 siRNAs (#1, or #2) or scramble siRNA (CTRL). (B) 72h after transfection of RASAL2 siRNAs (#1, or #2), gastric cancer cells were infected with H. pylori strains for 6h. (C) Gastric cancer cells were transfected with the indicated mounts (0.25μg or 0.5μg) of pLV-RASAL2 expression vector or empty vector control (CTRL). (D and E) Western blots and qRT-PCR analysis of β-catenin targets, including AXIN2, Cyclin D1, and LGR5; *P < .05, ***P < .001. Gastric cancer cell lines were transfected with RASAL2 siRNA (#1) or scramble siRNA control (CTRL) (D). Gastric cancer cell lines were transfected with the indicated mounts (0.25μg or 0.5μg) of pLV-RASAL2 expression plasmid or empty vector (CTRL) (E). (F and G) MKN28 cells were transfected with RASAL2 siRNA (#1) or scrambled siRNA (CTRL). Immunofluorescence staining (scale bars, 20μm) for RASAL2 (red) and β-catenin (green) was performed. Representative images are shown (F). Nuclear and cytoplasmic protein extraction and Western blots of RASAL2, p-β-catenin (S552) and β-catenin were performed (G).
Figure 4.
Figure 4.. RASAL2 enhanced AKT phosphorylation through inhibition of protein phosphatase 2A (PP2A) activity
(A,C and E) Western blots for RASAL2, p-PP2Ac (Y307), total PP2Ac, p-AKT (Ser473), and total AKT were performed in gastric cancer cell lines. (A) Gastric cancer cells with RASAL2 depletion, (C) Gastric cancer cells with RASAL2 overexpression, (E) Gastric cancer cells with RASAL2 depletion followed by H. pylori infection. (B,D and F) PP2A Phosphatase immunoprecipitation assays. The active PP2A form, PP2Ac, was specifically pulled down from whole-cell lysates, according to the manufacturer's instructions; *P < .05, **P < .01, ***P < .001. (B) Gastric cancer cell lines with RASAL2 depletion, (D) RASAL2 overexpression, and (F) RASAL2 depletion followed by H. pylori infection. (G) Western blot in AGS and STKM2 cell lines, following RASAL2 silencing and PP2A inhibitor (Okadaic acid, OA, 100nM) treatment. (H) Immunoprecipitation (IP) assay using antibody against RASAL2 or PP2AA in MKN45 cells. IgG was used as a negative control. Western blots of RASAL2 and PP2AA were performed. (I) Proximity ligation assays (PLA) in MKN45 and STKM2 cells were performed by using anti-RASAL2 and anti-PP2AA antibodies (scale bars, 10μm). PBS (CTRL) and single antibody only was used as negative controls. Red dots represent close relationship between two proteins.
Figure 5.
Figure 5.. RASAL2 depletion represses gastric cancer cell expansion
(A) Pearson’s correlation analyses between RASAL2 mRNA level and single-sample gene set enrichment analysis (ssGSEA) scores for two verified stem cell signatures, namely Stem cell gene set (SCGS)_Smith and SCGS_Benporath_Sox2, in TCGA cohort. (B) GSEA was employed in the TCGA, GEO and local cohorts, using stem cell relative signatures from GO biological processes items. The CSC markers, YAP1, NES, CTNNB1 (β-catenin), NF1, NOTCH1, and WNT5A, were analyzed across the datasets. (C) Spheroids (scale bars, 100μm) derived from MKN28 cells with stable knockdown of RASAL2 (shRASAL2-#1) displayed significantly smaller spheroids as compared to the scrambled shRNA cells (CTRL). (D) The quantification of sphere size and the number was expressed as the mean ± SD of 3 independent fields; *P < .05, **P < .01, ***P < .001. (E) Representative immunofluorescent images (scale bars, 25μm) of β-catenin (green) in spheroids; nuclei were stained with DAPI (blue). White arrows indicate nuclear β-catenin staining. The quantification of nuclear β-catenin fluorescence is shown as the mean ± SD of 3 independent fields; ***P < .001. (F) Human organoids (scale bars, 100μm) from gastric cancer tissues were stable knocked down of RASAL2 (lentivirus shRASAL2) or control (CTRL), showing that knockdown of RASAL2 inhibited organoids growth. (G) The quantification of organoids size and number was expressed as the mean ± SD of 5 independent fields; *P < .05, **P < .01. (H) Representative immunofluorescence images (scale bars, 50μm) of β-catenin (green) and RASAL2 (red) in organoids; nuclei were stained with DAPI (blue). White arrows indicate nuclear β-catenin staining. The quantification of nuclear β-catenin fluorescence is shown as the mean ± SD of 3 independent fields; **P < .01.
Figure 6.
Figure 6.. In vivo studies of RASAL2 in gastric tumorigenesis
(A and B) MKN45 cells with/without RASAL2 knockdown were serially diluted and xenografted into NOD/SCID mice subcutaneously. (A) shows tumor the cell numbers injected and frequency of tumor formation at day 42. (B) displays the probability estimates calculated with Extreme Limiting Dilution Analysis (ELDA) software (http://bioinf.wehi.edu.au/software/elda/). A significant difference in tumor formation capacity was observed between the control and sh-RASAL2 groups. (C) Tumor growth curves for subcutaneous tumor xenografts with shRNA knockdown or control (n = 6 per 1 million cells dose group); *P < .05. (D) Western blots for RASAL2 and its downstream signaling genes for xenograft tumors with/without RASAL2 knockdown (from 1 million cells dose group). (E-G) Immunohistochemistry staining (scale bars, 100μm) of RASAL2 (E), qRT-PCR of Rasal2 (F), and Western blots for RASAL2 (G) and its downstream targets were performed in H. pylori-infected mouse stomach tissues using mouse-adapted H. pylori strain, PMSS1, for 1 week (PMSS1-1W) or 2 weeks (PMSS1-2W) infection. *P < .05, **P < .01, ***P < .001. (H-J) Hematoxylin and eosin (H&E) staining (H, scale bars, 100μm), qRT-PCR of Rasal2 (I), and Western blots for RASAL2 and its downstream targets (J) were performed in TFF1-knockout mouse neoplastic gastric tissues. WT, wide-type mouse; LGD, low-grade dysplasia; HGD, High-grade dysplasia. *P < .05, ***P < .001.
Figure 7.
Figure 7.. Elevated expression of RASAL2 predicted chemoresistance and poor prognosis in human samples
(A) Representative immunohistochemistry staining (scale bars, 100μm) of RASAL2 in human gastric tumors and adjacent non-tumor tissues. (B) Percentages of RASAL2 negative and positive staining in tumor (n=365) and non-tumor tissues (n=124). (C) Spearman’s correlation between IHC staining scores of RASAL2 and β-catenin in tumor slides of 119 patients. (D) Kaplan-Meier survival analysis for RASAL2 staining in the local cohort (left for OS and middle for RFS) or mRNA levels (right) in TCGA cohorts. (E) Kaplan-Meier survival analysis for patients with and without adjuvant chemotherapy (ACT) in RASAL2 positive or negative staining cases in the local cohort. (F) Cox regression model for an adjusted hazard ratio of the patients with ACT in RASAL2 positive and negative staining cases, compared with the patients without ACT. (G) Gross morphology of tumors in NOD/SCID mice model using MKN45 cells with RASAL2 knockdown or combination with CDDP treatment. Mice were dosed with CDDP (2 mg/kg/3 day, ip) (n = 6 tumors per group). (H) Tumor growth curve over time in each group. Data are shown as the mean ± SEM. (I) Relative tumor volume at the end of treatment. Boxes in the graph indicate the median with interquartile range. ns indicates no significance. **P < .01.

Comment in

References

    1. Sung H, Ferlay J, Siegel RL, et al. Global Cancer Statistics 2020: GLOBOCAN Estimates of Incidence and Mortality Worldwide for 36 Cancers in 185 Countries. CA Cancer J Clin 2021;71:209–249. - PubMed
    1. Infection with Helicobacter pylori. IARC Monogr Eval Carcinog Risks Hum 1994;61:177–240. - PMC - PubMed
    1. Kiga K, Mimuro H, Suzuki M, et al. Epigenetic silencing of miR-210 increases the proliferation of gastric epithelium during chronic Helicobacter pylori infection. Nat Commun 2014;5:4497. - PMC - PubMed
    1. Peterson AJ, Menheniott TR, O'Connor L, et al. Helicobacter pylori infection promotes methylation and silencing of trefoil factor 2, leading to gastric tumor development in mice and humans. Gastroenterology 2010;139:2005–17. - PMC - PubMed
    1. Niwa T, Tsukamoto T, Toyoda T, et al. Inflammatory processes triggered by Helicobacter pylori infection cause aberrant DNA methylation in gastric epithelial cells. Cancer Res 2010;70:1430–40. - PubMed

Publication types