. 2022 Feb 28;57(4):543-560.e9.
doi: 10.1016/j.devcel.2022.01.008. Epub 2022 Feb 7.

A single-cell Arabidopsis root atlas reveals developmental trajectories in wild-type and cell identity mutants

Affiliations

A single-cell Arabidopsis root atlas reveals developmental trajectories in wild-type and cell identity mutants

Rachel Shahan et al. Dev Cell. .

Abstract

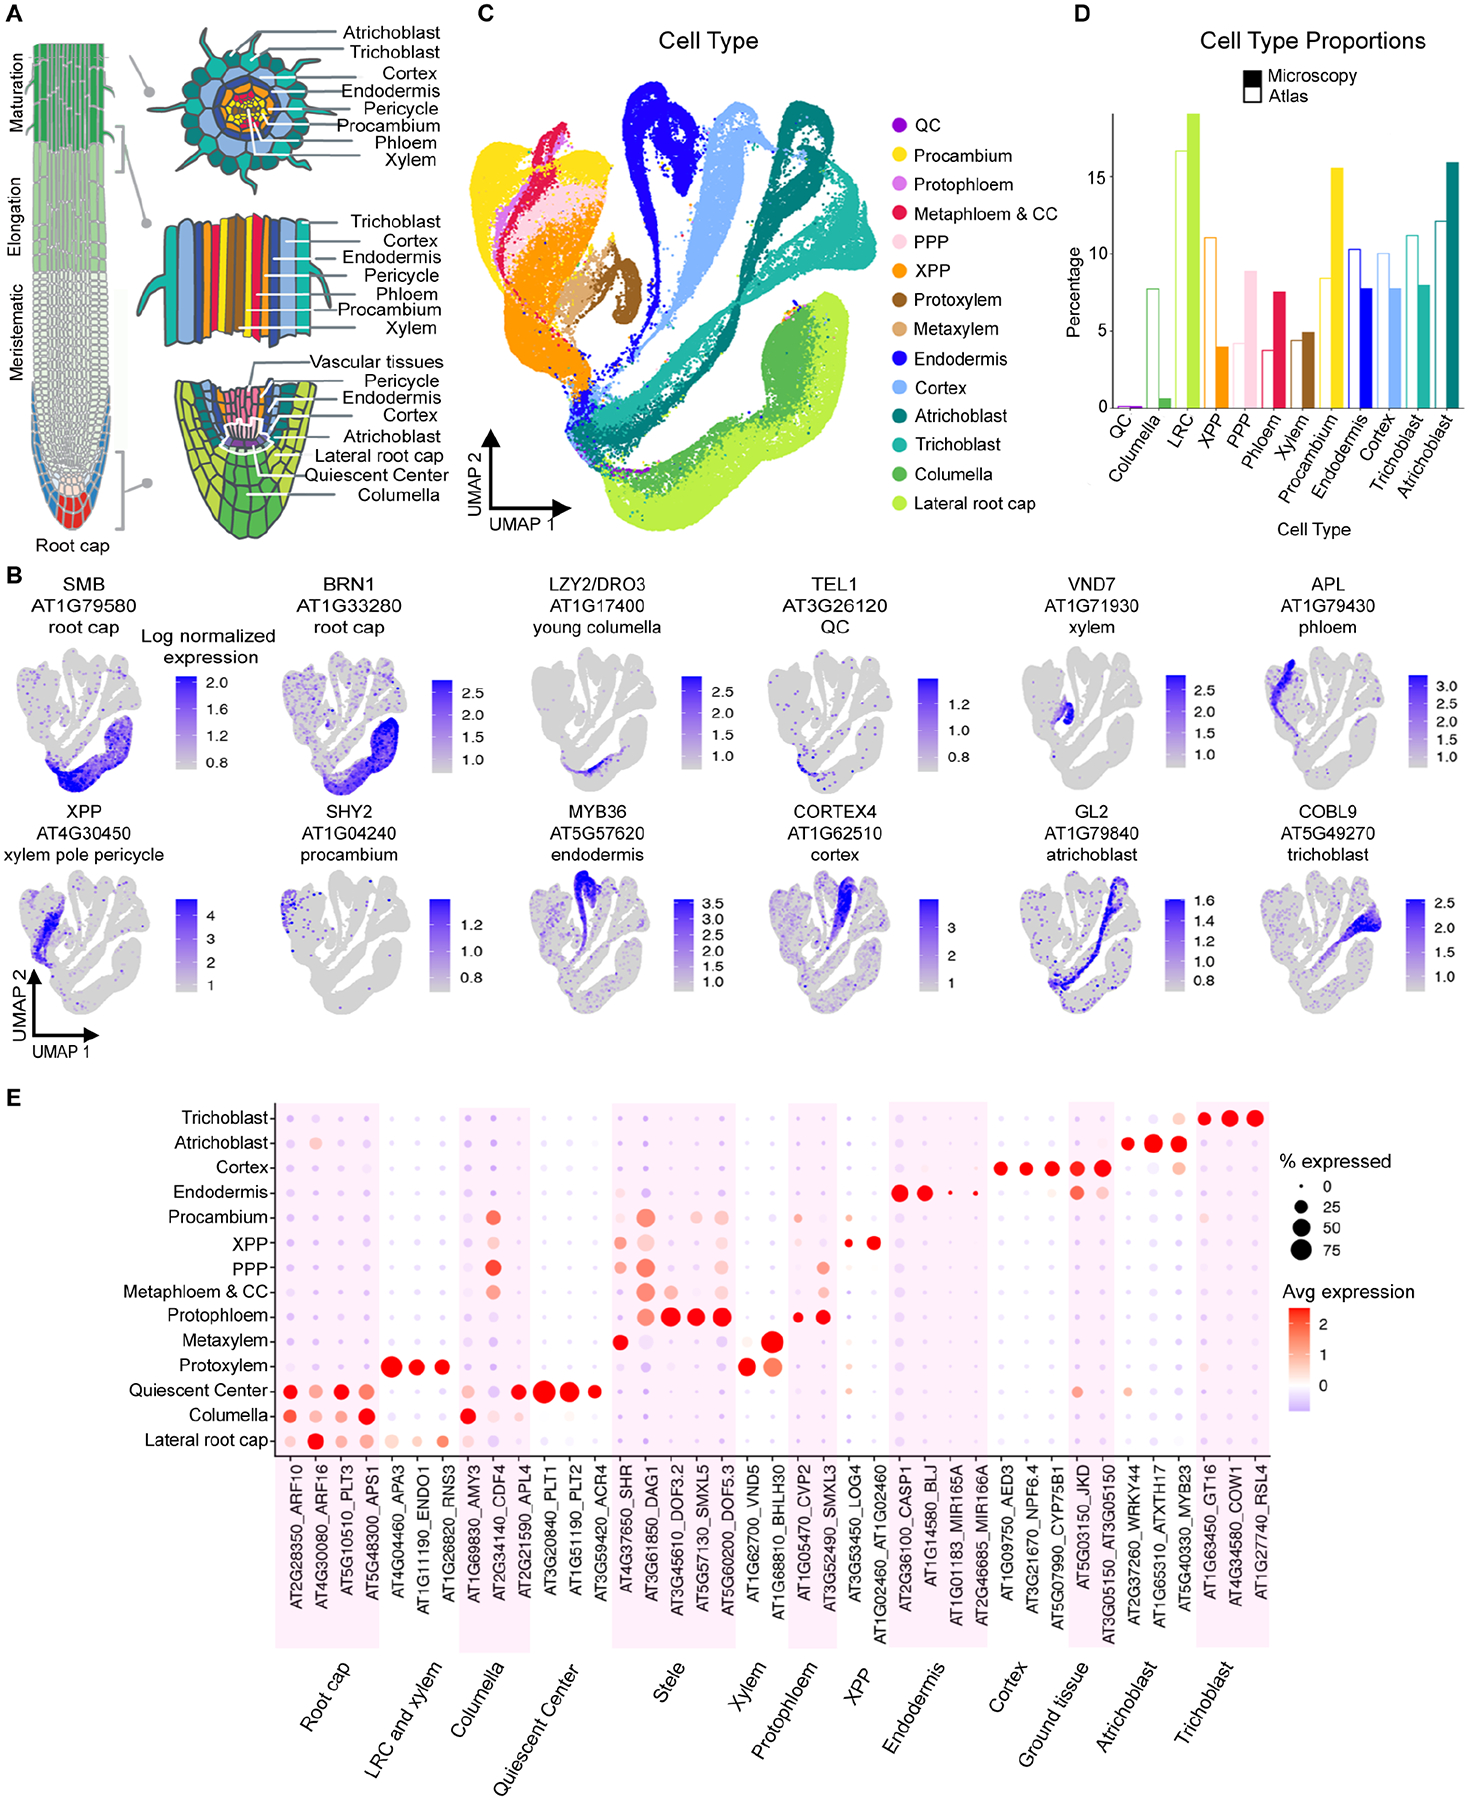
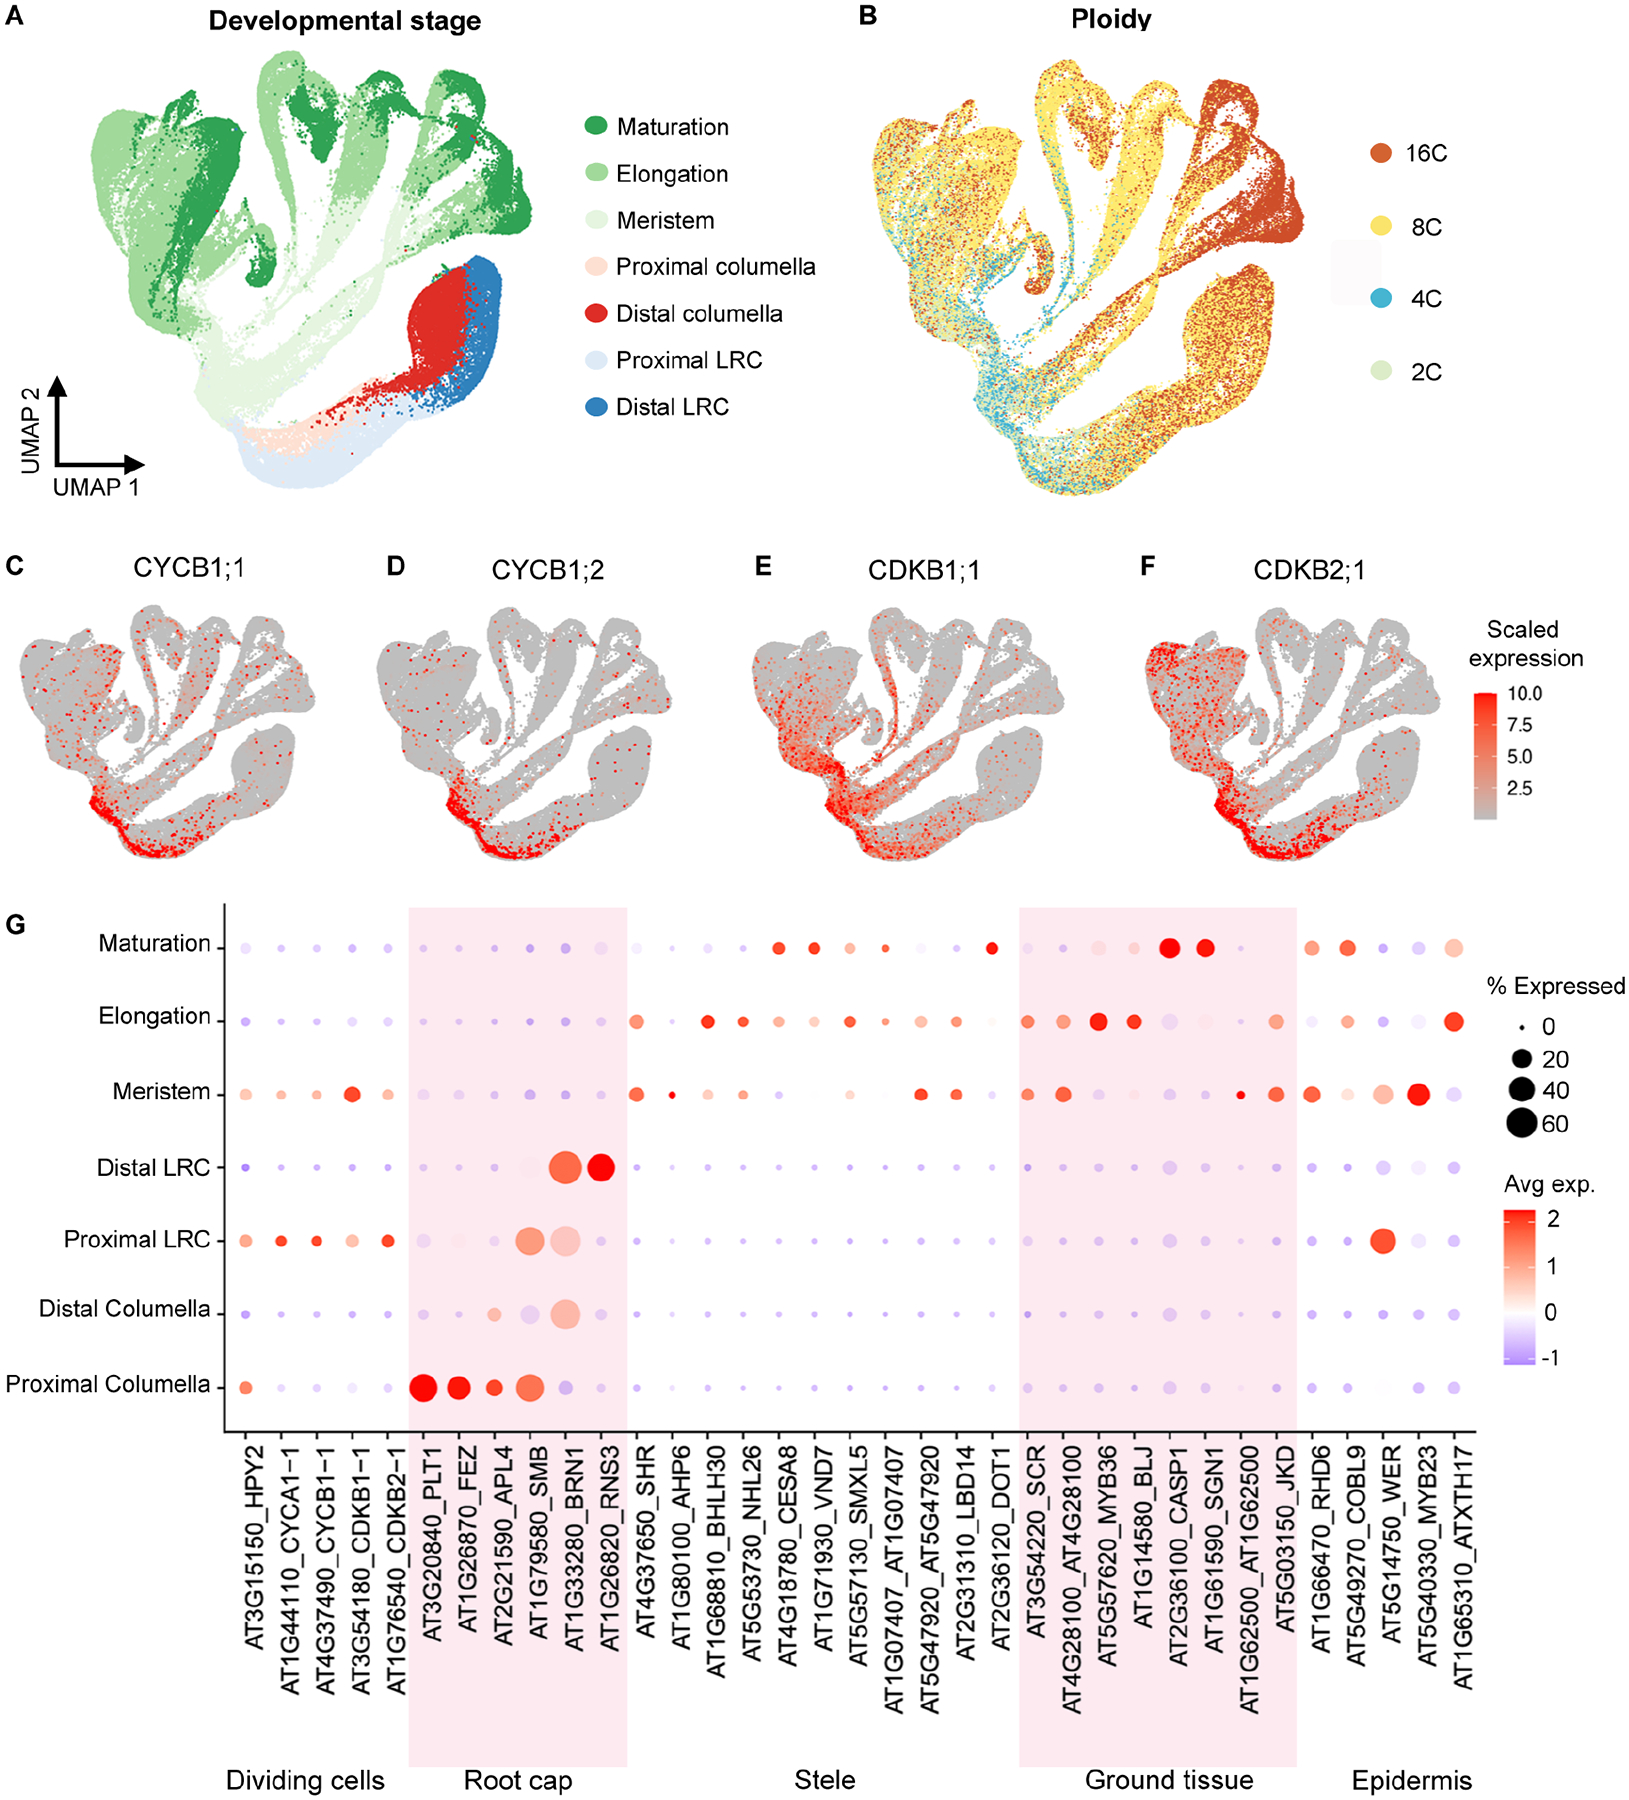
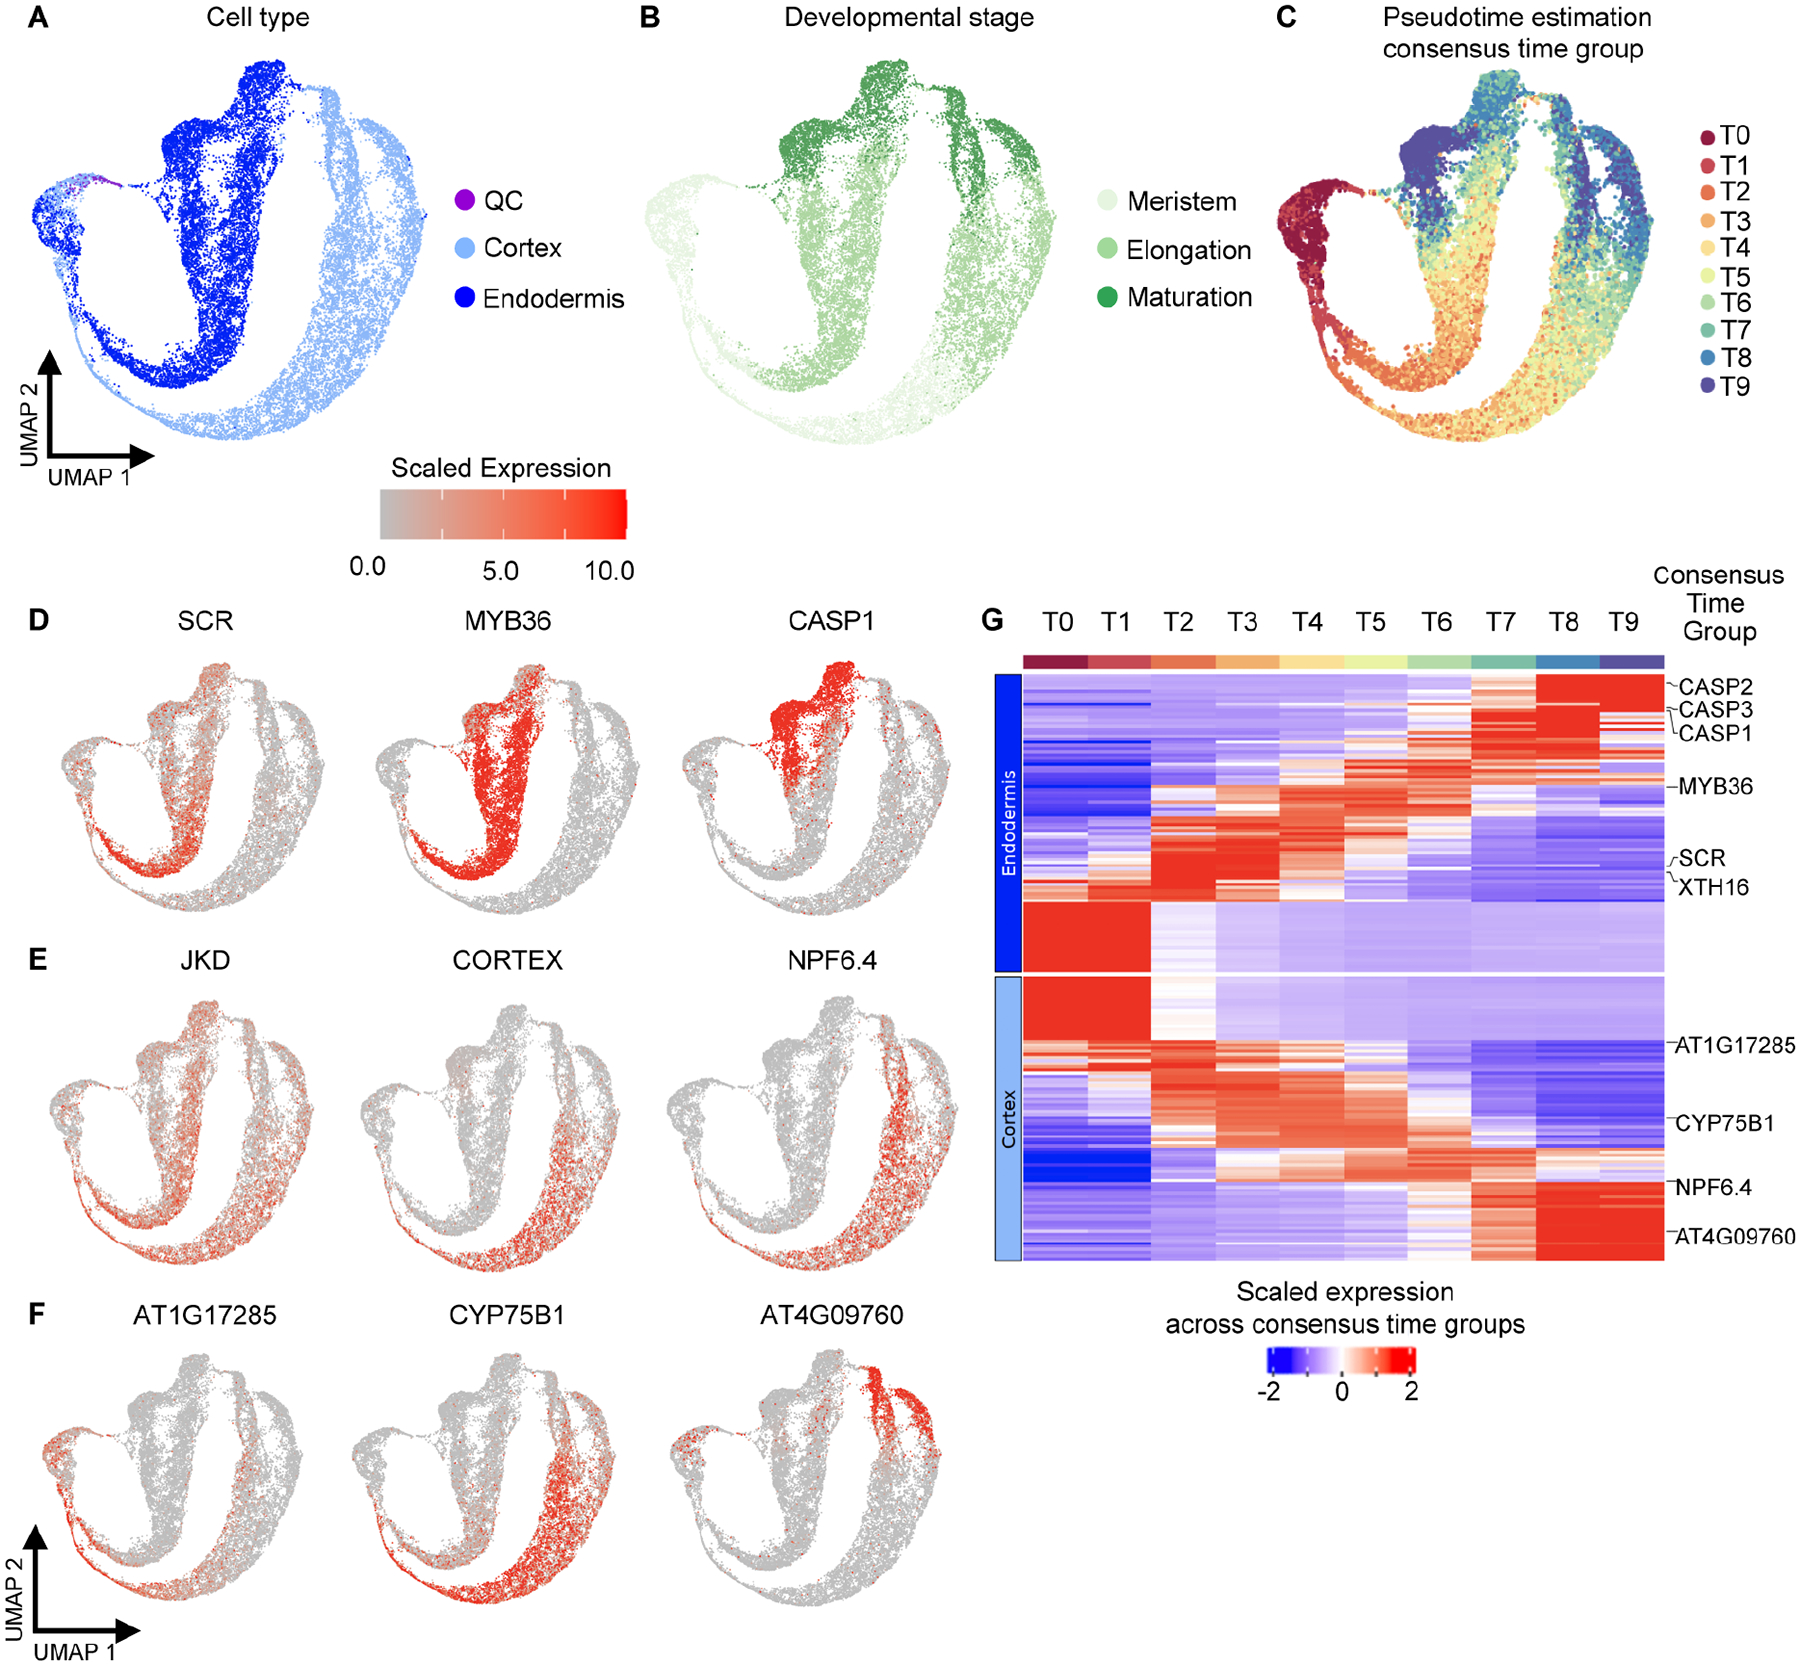
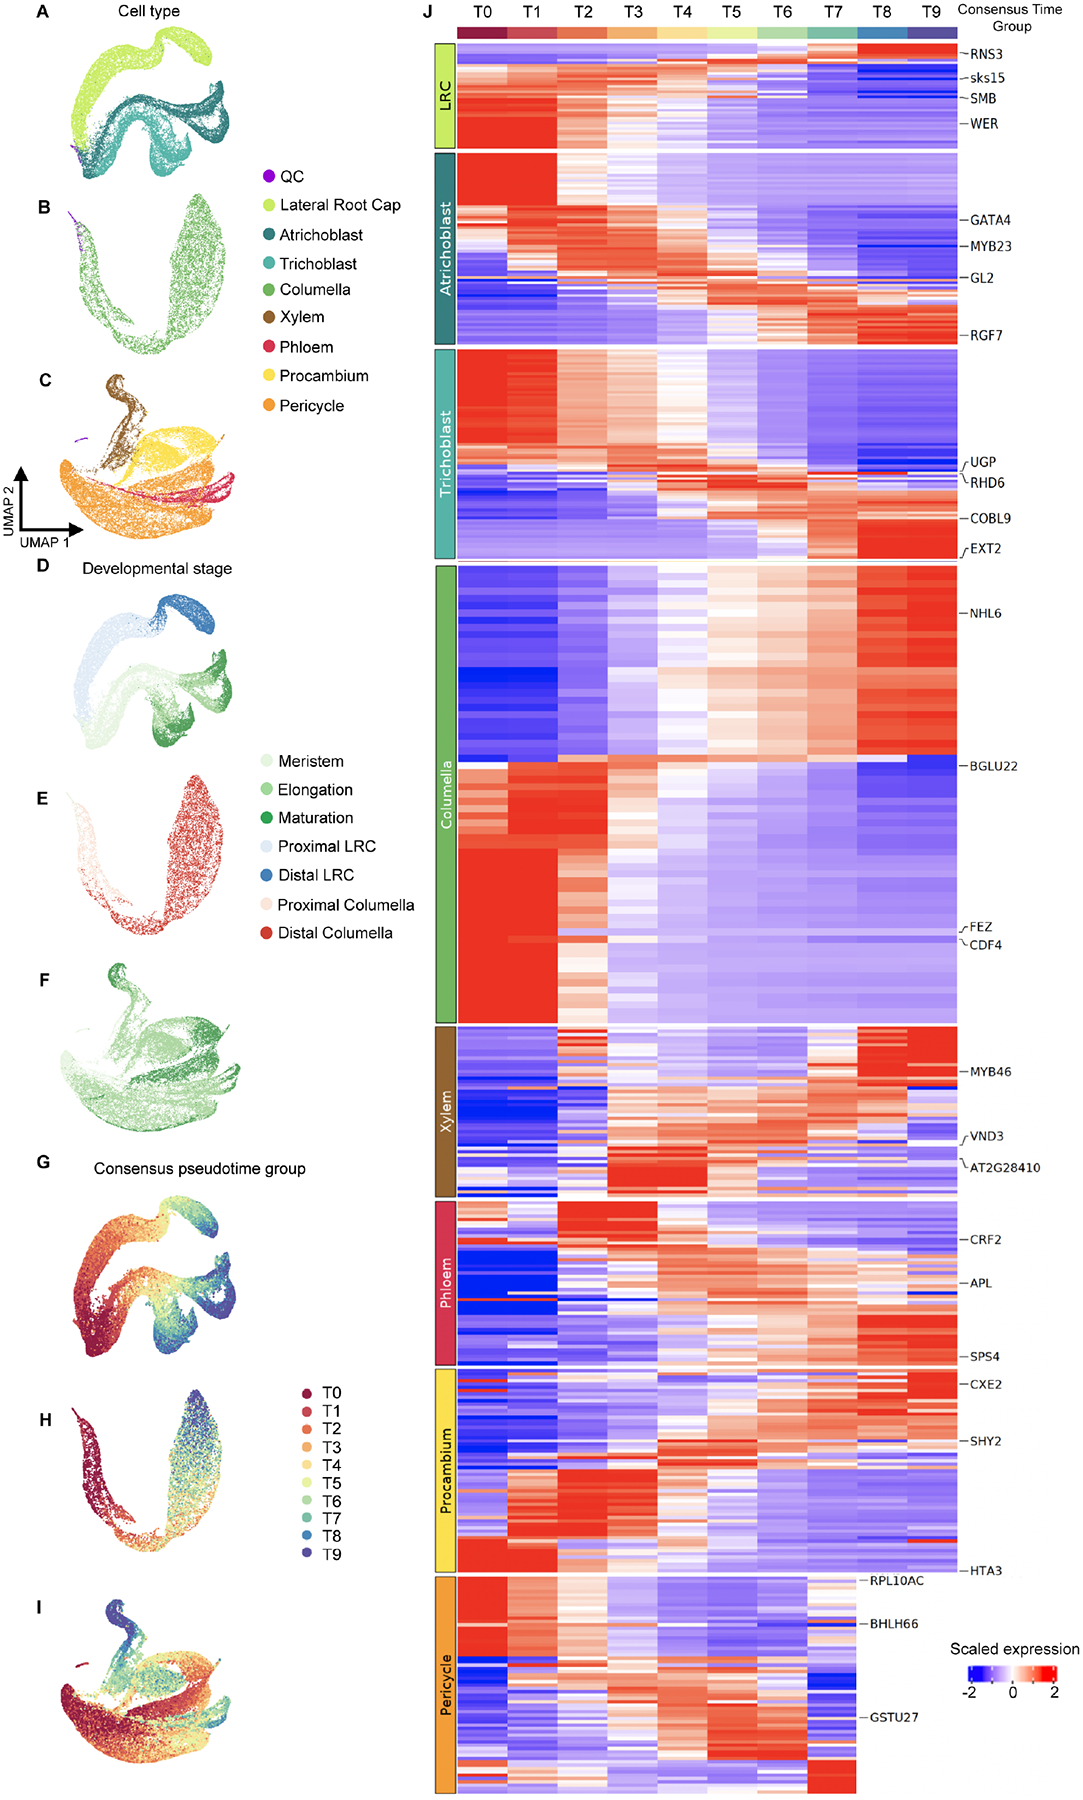
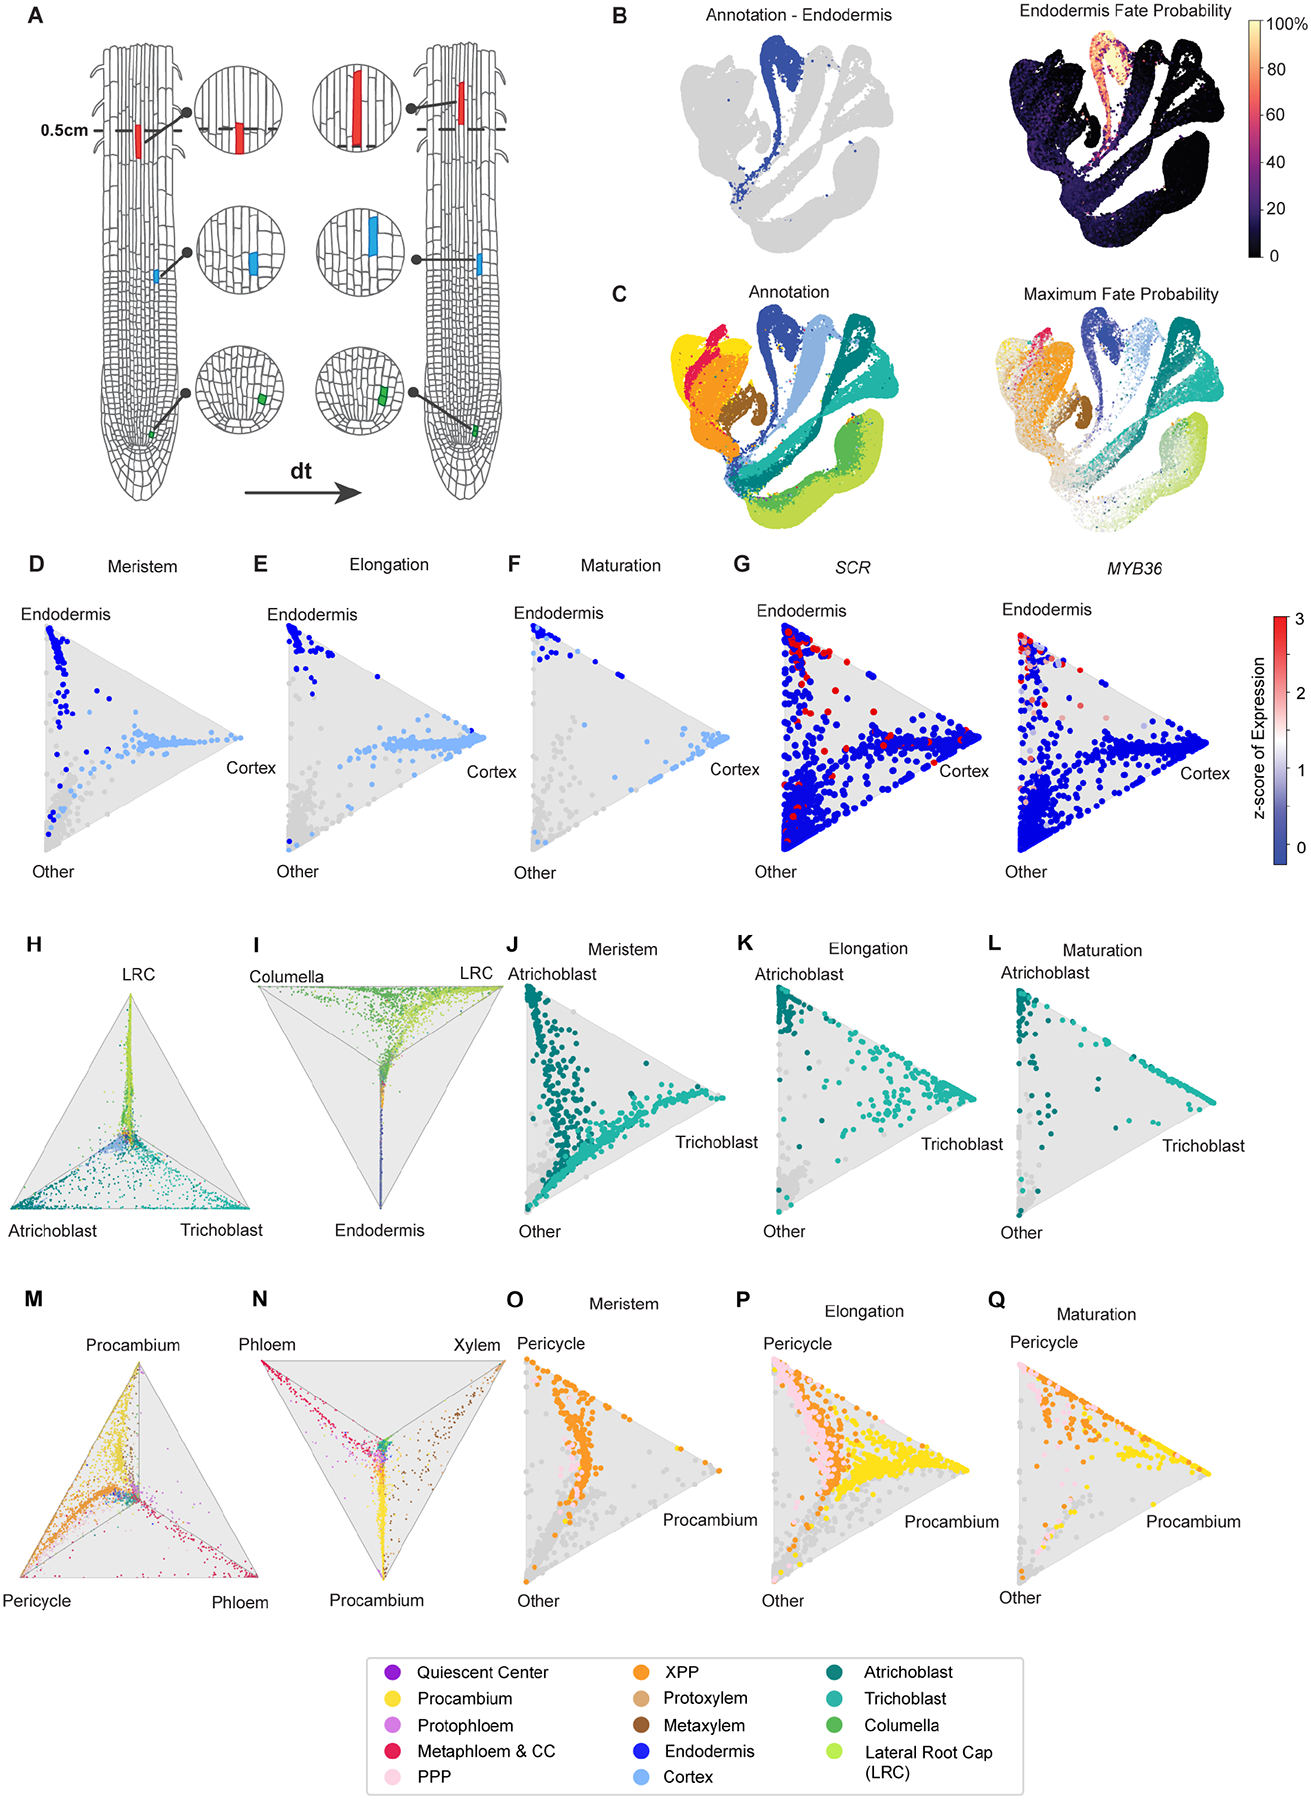
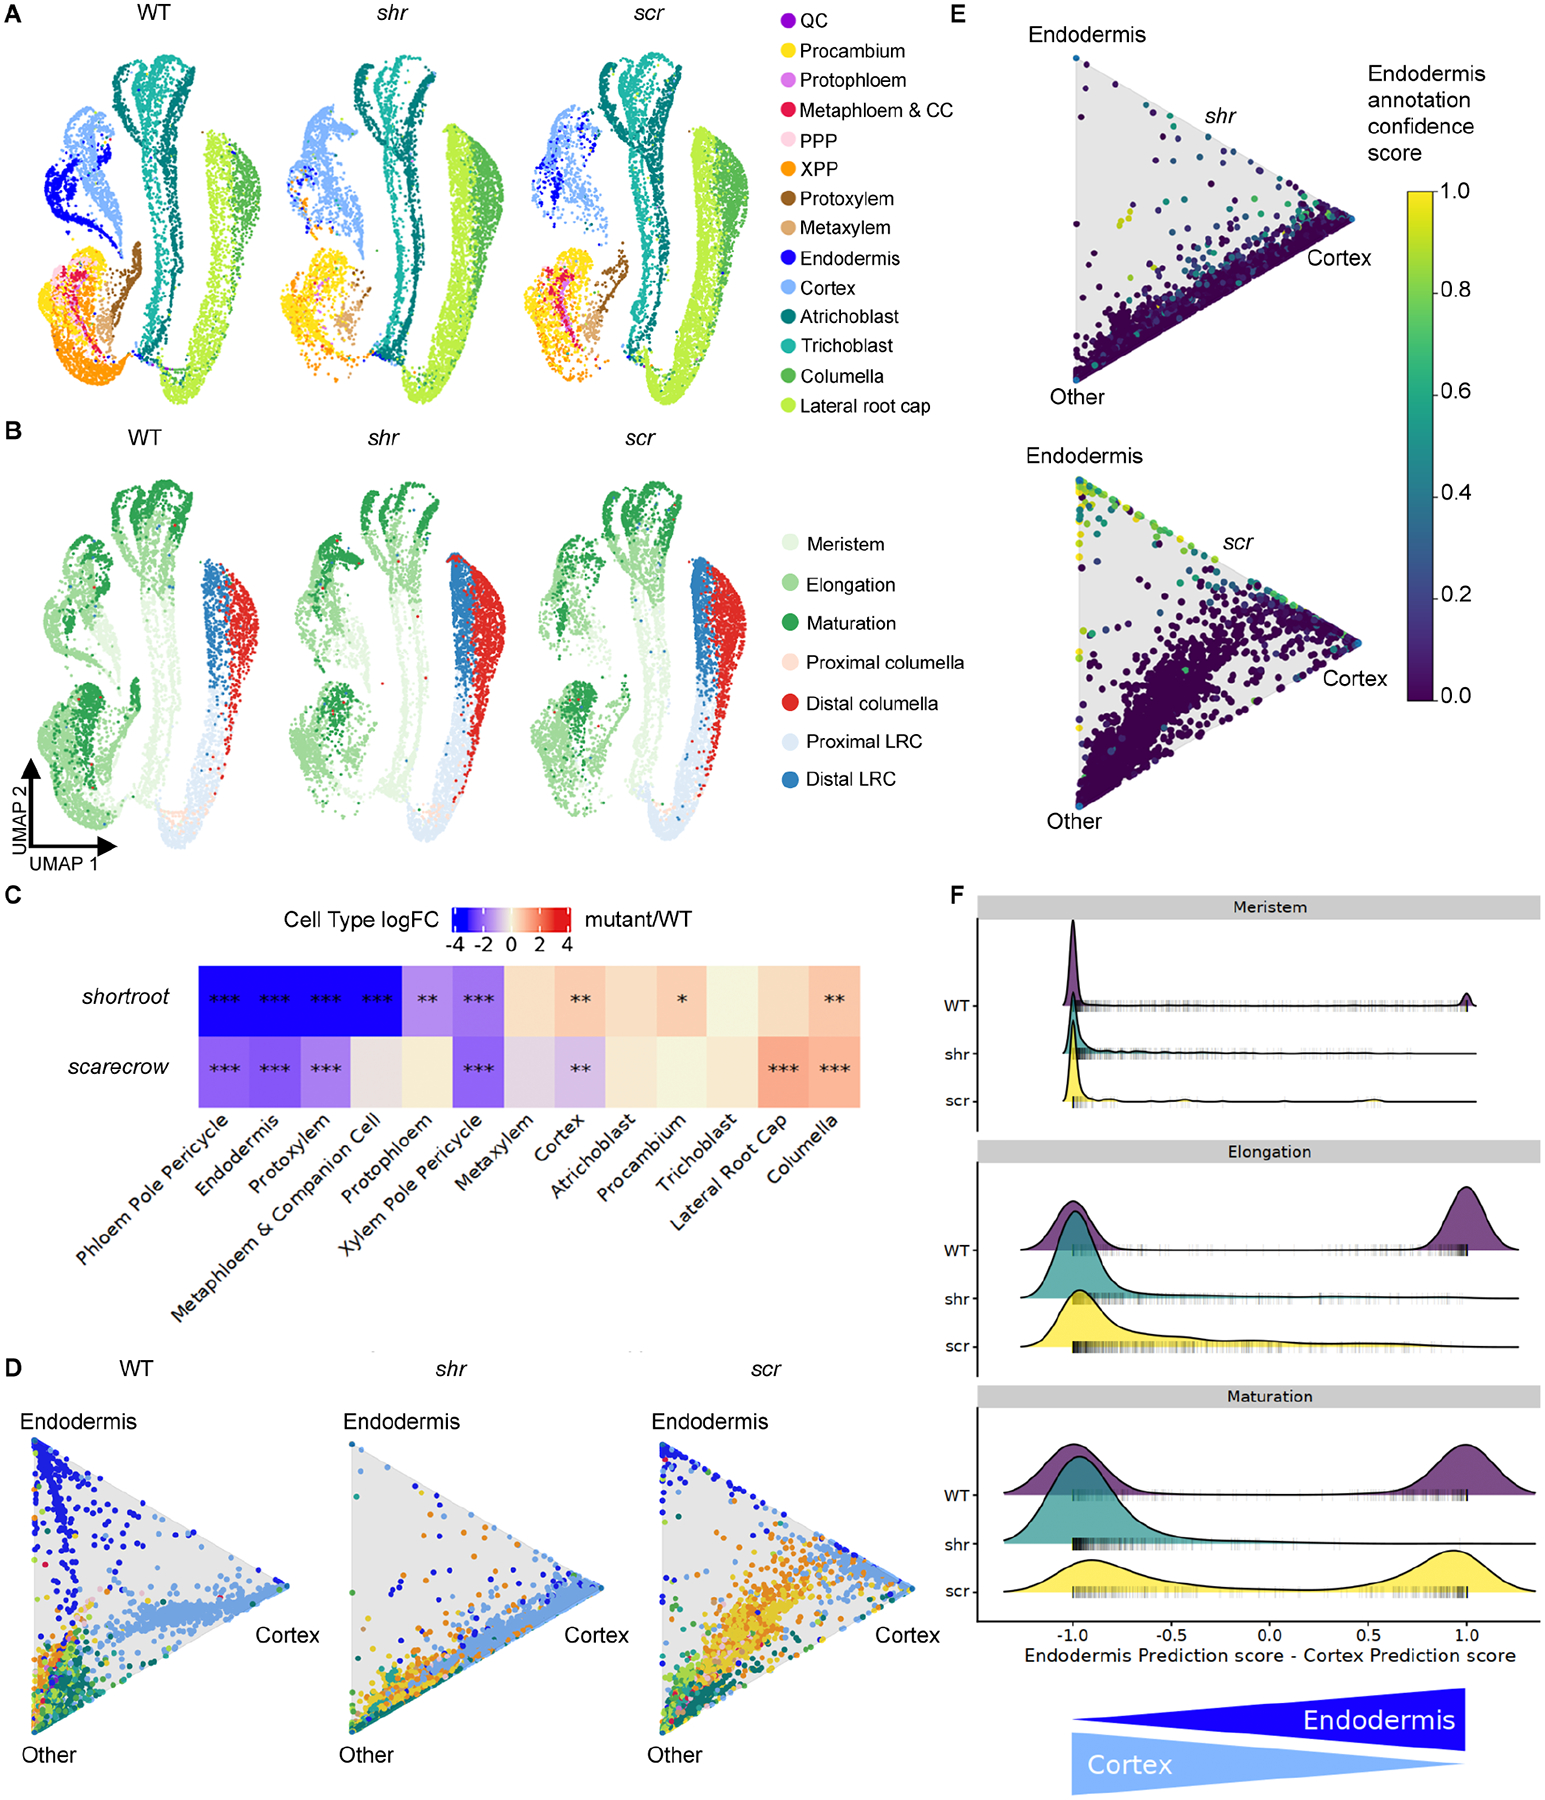
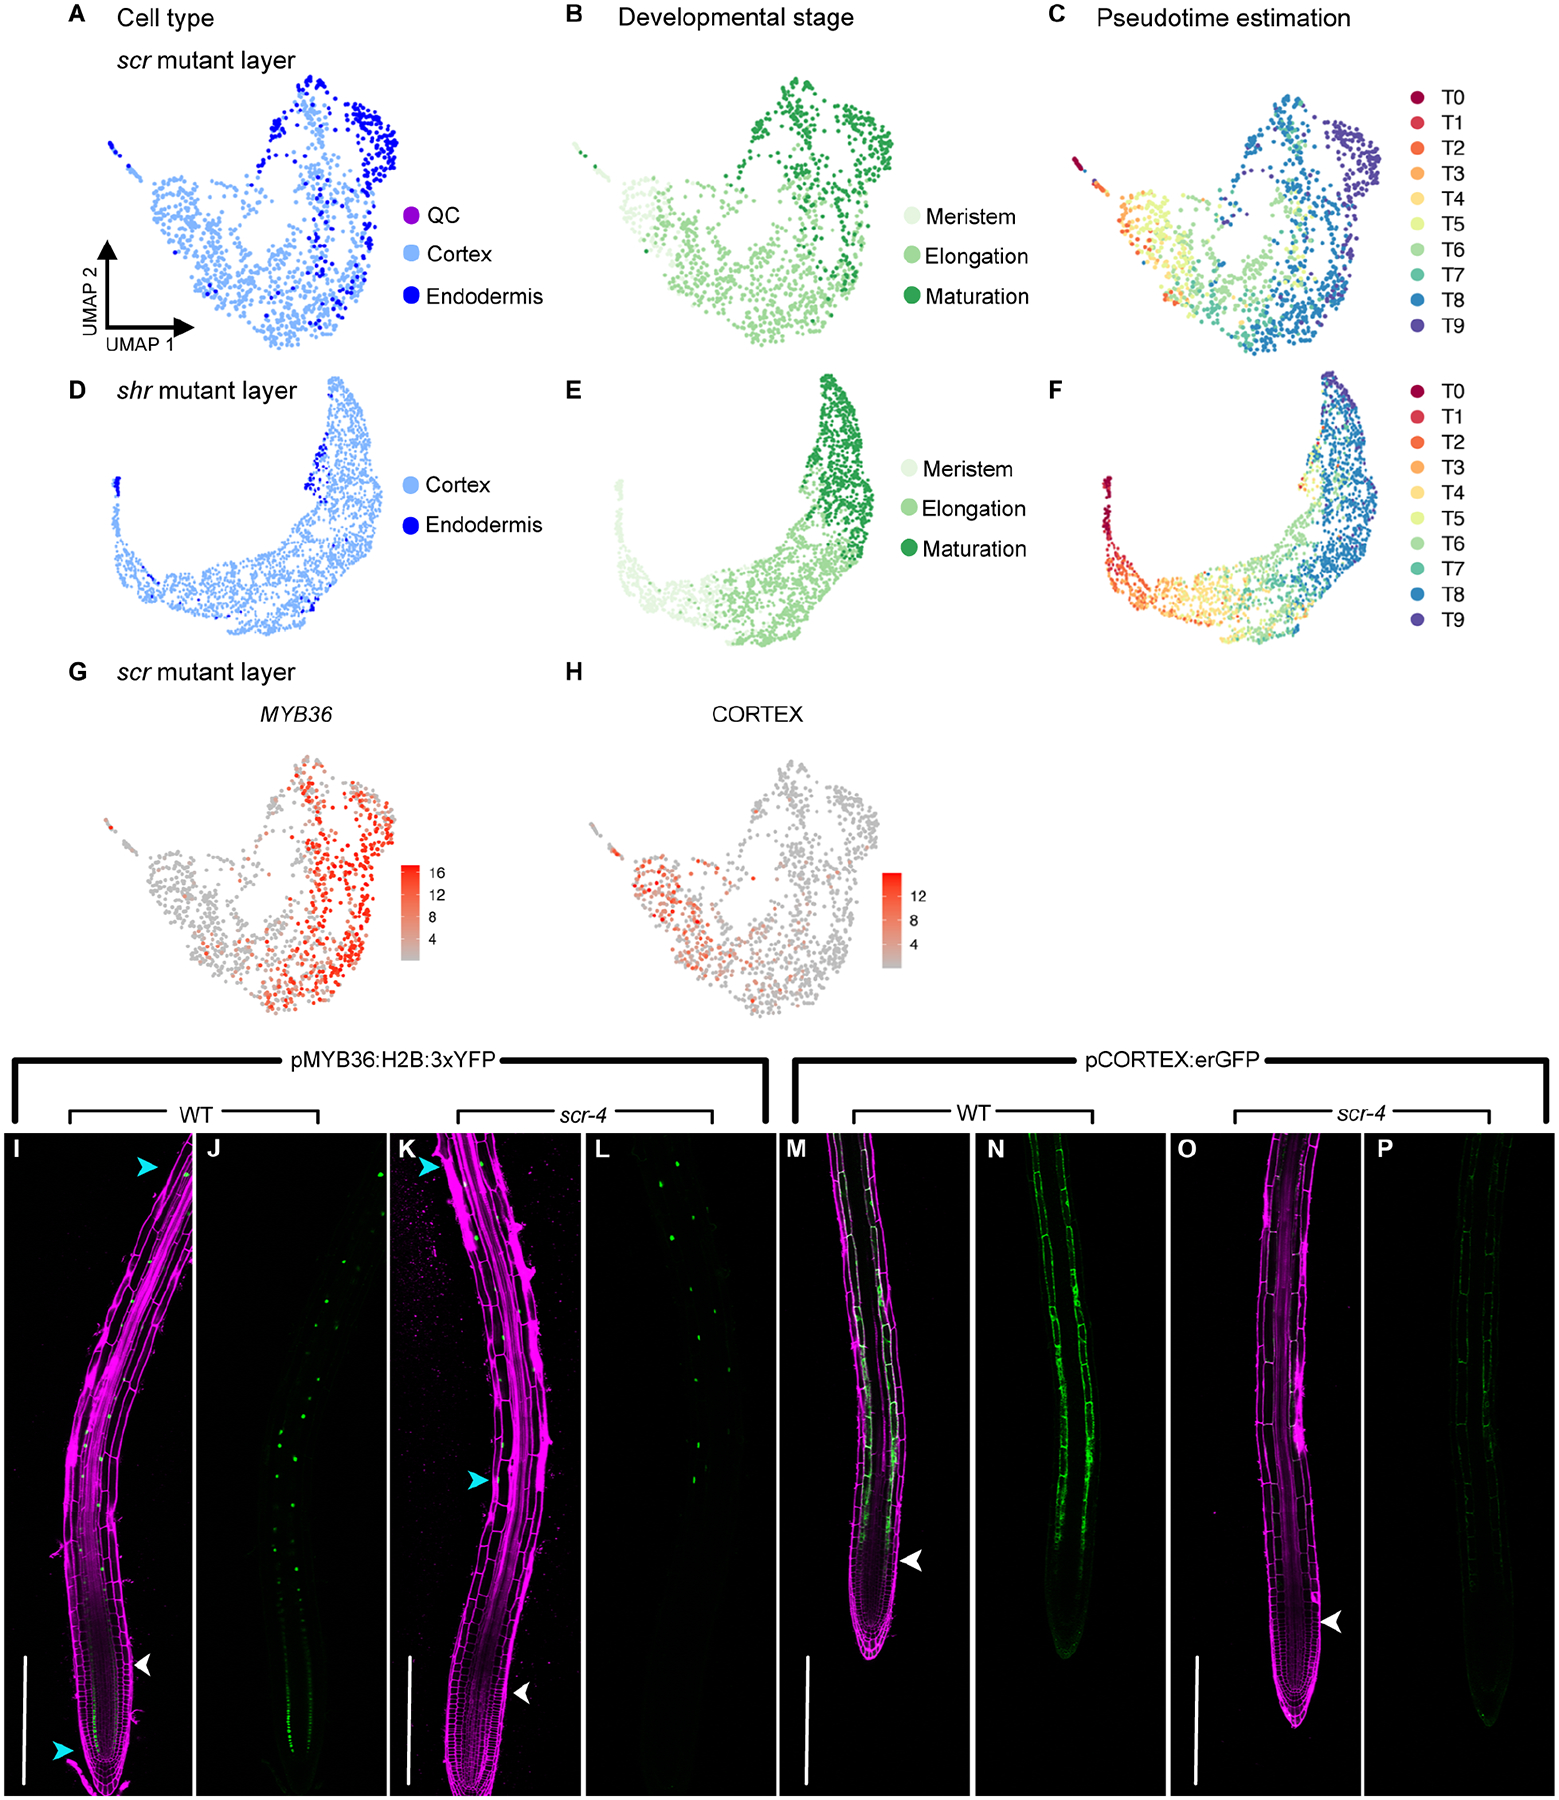
In all multicellular organisms, transcriptional networks orchestrate organ development. The Arabidopsis root, with its simple structure and indeterminate growth, is an ideal model for investigating the spatiotemporal transcriptional signatures underlying developmental trajectories. To map gene expression dynamics across root cell types and developmental time, we built a comprehensive, organ-scale atlas at single-cell resolution. In addition to estimating developmental progressions in pseudotime, we employed the mathematical concept of optimal transport to infer developmental trajectories and identify their underlying regulators. To demonstrate the utility of the atlas to interpret new datasets, we profiled mutants for two key transcriptional regulators at single-cell resolution, shortroot and scarecrow. We report transcriptomic and in vivo evidence for tissue trans-differentiation underlying a mixed cell identity phenotype in scarecrow. Our results support the atlas as a rich community resource for unraveling the transcriptional programs that specify and maintain cell identity to regulate spatiotemporal organ development.

Keywords: Arabidopsis; SCARECROW; SHORTROOT; cell fate; development; root; scRNA-seq; transcriptomics.


Conflict of interest statement

Declaration of interests P.N.B. is a member of the Developmental Cell advisory board and is the co-founder and Chair of the Scientific Advisory Board of Hi Fidelity Genetics, a company that works on crop root growth.

Figures

Figure 1.
Figure 1.. 110,427 cell root atlas representing all major cell types.
A) Developmental zones (left) and radial cell types (right) of the Arabidopsis root. White border indicates the location of stem cells surrounding the Quiescent Center. Illustration adapted from the Plant Illustrations repository (Bouché, 2017). B) Expression of known cell type markers. The color scale for each plot represents log normalized, corrected UMI counts for the indicated gene. C) UMAP with cell type labels. The crossing over or apparent mixture between some cell types, e.g., trichoblast and atrichoblast, is a result of 2D projection and absent in 3D (Supplementary Movie 1). D) The proportion of each cell type group in the atlas is comparable to in vivo cell type proportions (Cartwright et al., 2009). E) Cell type expression for 40 genes, the spatial expression profiles of which have been previously characterized. Dot size represents the percentage of cells in which each gene is expressed (% expressed). Dot colors indicate the average scaled expression of each gene in each cell type group with warmer colors indicating higher expression levels. CC: companion cell; QC: quiescent center; PPP: phloem pole pericycle; XPP: xylem pole pericycle; LRC: lateral root cap. See also Figures S1– S6, Datasets S1– S3, Data S1, and Supplementary Movie 1.
Figure 2.
Figure 2.. Expression profiles of known genes support the atlas developmental stage annotations.
A) UMAP with developmental stage annotations. LRC: lateral root cap. B) UMAP with cell ploidy annotations based on gene expression profiles from Bhosale et al. (2018). C-F) Scaled expression (STAR Methods) of four previously characterized cyclin genes (Ishida et al., 2009). G) Developmental stage expression profiles for 35 genes expressed across the four major root tissue types. Dot size represents the percentage of cells in which each gene is expressed (% Expressed). Dot colors indicate the average scaled expression of each gene in each developmental stage group with warmer colors indicating higher expression levels. Root cap: lateral root cap and columella. See also Figures S1– S6 and Datasets S1– S2.
Figure 3.
Figure 3.. Pseudotime estimates reflect the dynamics of ground tissue differentiation.
A) Endodermis and cortex-annotated cells (ground tissue) were extracted from the atlas and re-embedded in a 2D UMAP. QC cells were included to help anchor pseudotime estimations. B) Ground tissue cells annotated with developmental stage labels. C) Ground tissue cells annotated with consensus pseudotime group labels. T0 denotes the youngest cells. D-E) Scaled expression patterns (STAR Methods) of known endodermis and cortex markers. F) Newly identified cortex-expressed genes are candidates for marker development. G) Scaled expression of 90 and 94 non-redundant, differentially expressed genes across consensus pseudotime groups for cortex and endodermis, respectively. Warmer colors denote higher expression. Although thousands of differentially expressed genes were identified across pseudotime, only the most strongly differentially expressed genes for each of the ten pseudotime bins were plotted for simplicity. See also Dataset S4.
Figure 4.
Figure 4.. Pseudotime progressions indicate gradual gene expression changes underlie development across tissues and developmental zones.
A-C) Cells annotated as trichoblast, atrichoblast, and lateral root cap (A), columella (B), and stele (C) were extracted from the atlas and re-embedded in individual UMAPs. D-F) UMAPs annotated by developmental stage. G-I) UMAPs annotated by consensus time groups. J) Scaled expression of the top ten non-redundant, most highly differentially expressed genes across consensus pseudotime groups for each cell type. See also Dataset S4.
Figure 5.
Figure 5.. Optimal transport identifies developmental trajectories.
A) The root tip, denoted here as the 0.5 cm harvested for scRNA-seq, remains in equilibrium over a time period of duration dt. Individual cells progress through developmental stages, including dividing (green; transit amplifying divisions following stem cell divisions), enlarging (blue; elongation zone), and exiting the region of interest (red; early maturation zone). B) Endodermis fate probability (right) agrees with endodermis annotations (left), visualized on the UMAP. C) All fate probabilities are visualized on the UMAP (right). Cells are colored according to the lineage of maximum fate probability and cells fade to grey as the fate specification becomes less determined (i.e., as the maximum fate probability decreases). D-Q) StationaryOT fate probabilities reflect known developmental relationships and, in some cases, fate fluidity between cell types. For each plot, the dataset was down-sampled to 10,000 cells to facilitate visualization. D-F) Triangle plots with cells plotted according to cortex, endodermis, and all other fate probabilities. Cells annotated as cortex and endodermis are colored light and dark blue, respectively, with all other cells in gray. The three plots show cells from each of the three developmental stages. G) Increasing endodermis fate probabilities agree with developmental stage annotations and with expression patterns of SCARECROW (SCR) and MYB36. The legend shows z-scores of gene expression, where a score of 1 is one standard deviation above mean expression. H-I) Cells are arranged on tetrahedron plots according to cell fate probabilities from epidermis and root cap tissues. The top vertex of each face of the tetrahedron plots (looking down) contains all other cell type fates besides the three labeled at each of the remaining vertices. J-L) Cells are plotted according to atrichoblast, trichoblast, and all other fate probabilities. Cells annotated as atrichoblast and trichoblast are colored accordingly with all other cells in gray. M-N) Tetrahedron plots representing stele cell fate probabilities. Xylem, phloem, and pericycle terminal fates from pseudotime estimates were used for StationaryOT but stele cells are colored here according to annotated sub-types. O-Q) Cells are plotted according to pericycle, procambium, and all other fate probabilities. See also Figure S7.
Figure 6.
Figure 6.. Atlas informs cell type abundance and identity changes in shr and scr mutants.
A) UMAPs with cell type annotations representing WT integrated with shr and scr. Data from each genotype was down-sampled to 10,000 cells to facilitate comparison. B) UMAPs from A but labeled with developmental stage annotation. C) Differential abundance analysis using the full integrated WT, shr, and scr dataset reports significant changes in per-label cell type abundance between mutants and WT. *** False Discovery Rate (FDR) < 0.001; ** FDR < 0.01; * FDR < 0.05. D) Triangle plots illustrating cell fate probabilities calculated by StationaryOT. Cell type color legend is the same as A. E) Triangle plots show cells arranged according to endodermis, cortex, and all other fate probabilities for shr (top) and scr (bottom) as calculated by StationaryOT. Each dot represents one cell. Dots are colored by endodermis annotation confidence scores after label transfer from the WT atlas by Seurat. Zero and one are the lowest and highest confidence scores, respectively. F) Data density plot of the cortex classification score subtracted from the endodermis classification score for each cell, plotted by developmental stage. On the x-axis, a value of 1 indicates confident endodermal classification while a value of −1 indicates confident cortex classification. The annotation of each scr and shr cell was assigned using a weighted vote classifier based on reference cell labels from the atlas (Stuart et al., 2019). Cell type classification scores range from zero (lowest confidence) to one (highest confidence). Absolute cell numbers are represented by the shaded bars. See also Datasets S1 – S2, Data S1.
Figure 7.
Figure 7.. Spatial expression patterns of MYB36 and CORTEX transcriptional reporters are consistent with cortex to endodermis fate transition in the scarecrow mutant layer.
A) Cortex, endodermis, and QC cells extracted from the scr dataset and re-embedded in a UMAP. B) Developmental stage annotation labels were transferred from the WT atlas to the scr mutant layer cells. C) Consensus pseudotime group annotation labels were transferred from WT ground tissue to scr. Warmer to cooler colors represent the developmental progression from youngest to oldest cells, respectively. D) Cortex and endodermis cells were extracted from the shr dataset and re-embedded in a UMAP. E-F) As for scr, developmental stage (E) and consensus time group annotation labels (F) were transferred from the WT atlas to shr mutant layer cells. G-H) Scaled expression of MYB36 and AT1G09750 (CORTEX reporter) in cells of the scr mutant layer. I-L) pMYB36:H2B:3xYFP reporter in WT (I,J) and scr-4 (K,L) showing loss of meristem and elongation zone expression in scr mutant. Blue arrowheads mark the longitudinal location of the first and last cells in the image with visible YFP. M-P) pCORTEX:erGFP reporter in scr-4/pCORTEX:erGFP F2 progeny with WT ground tissue phenotype (M,N) and scr-4 mutant layer phenotype (O,P) showing reduced expression of cortex marker as cells mature in the mutant. Red and green channel overlay images (I, K, M, O) are propidium iodide-stained roots (magenta) and YFP or GFP signal. Green channel images (J, L, N, P) are YFP or GFP alone. Scale bars are 200 μm. White arrowheads mark the beginning of the elongation zone. See also Dataset S1.

References

    1. Aida M, Beis D, Heidstra R, Willemsen V, Blilou I, Galinha C, Nussaume L, Noh Y-S, Amasino R, and Scheres B (2004). The PLETHORA genes mediate patterning of the Arabidopsis root stem cell niche. Cell 119, 109–120. 10.1016/j.cell.2004.09.018. - DOI - PubMed
    1. Amezquita RA, Lun ATL, Becht E, Carey VJ, Carpp LN, Geistlinger L, Marini F, Rue-Albrecht K, Risso D, Soneson C, et al. (2020). Orchestrating single-cell analysis with Bioconductor. Nat Methods 17, 137–145. 10.1038/s41592-019-0654-x. - DOI - PMC - PubMed
    1. Andrews S (2010). FastQC: A quality control tool for high throughput sequence data. https://www.bioinformatics.babraham.ac.uk/projects/fastqc/.
    1. Bargmann BOR, Vanneste S, Krouk G, Nawy T, Efroni I, Shani E, Choe G, Friml J, Bergmann DC, Estelle M, and Birnbaum KD (2013). A map of cell type-specific auxin responses. Mol Syst Biol 9, 688. 10.1038/msb.2013.40. - DOI - PMC - PubMed
    1. Beeckman T and De Smet I (2014). Pericycle. Curr Biol 24, R378–379. 10.1016/j.cub.2014.03.031. - DOI - PubMed

Publication types

MeSH terms