. 2022 Feb 7;57(3):310-328.e9.
doi: 10.1016/j.devcel.2022.01.006.

Epigenetic basis of oncogenic-Kras-mediated epithelial-cellular proliferation and plasticity

Affiliations

Epigenetic basis of oncogenic-Kras-mediated epithelial-cellular proliferation and plasticity

Preetish Kadur Lakshminarasimha Murthy et al. Dev Cell. .

Abstract

Oncogenic Kras induces a hyper-proliferative state that permits cells to progress to neoplasms in diverse epithelial tissues. Depending on the cell of origin, this also involves lineage transformation. Although a multitude of downstream factors have been implicated in these processes, the precise chronology of molecular events controlling them remains elusive. Using mouse models, primary human tissues, and cell lines, we show that, in Kras-mutant alveolar type II cells (AEC2), FOSL1-based AP-1 factor guides the mSWI/SNF complex to increase chromatin accessibility at genomic loci controlling the expression of genes necessary for neoplastic transformation. We identified two orthogonal processes in Kras-mutant distal airway club cells. The first promoted their transdifferentiation into an AEC2-like state through NKX2.1, and the second controlled oncogenic transformation through the AP-1 complex. Our results suggest that neoplasms retain an epigenetic memory of their cell of origin through cell-type-specific transcription factors. Our analysis showed that a cross-tissue-conserved AP-1-dependent chromatin remodeling program regulates carcinogenesis.

Keywords: ATAC-seq; Fosl1; KRAS; NSCLC; adenocarcinoma; alveolar type II cell; club cell; epigenetics; intestinal stem cell; lung.


Conflict of interest statement

Declaration of interests X.S. is the co-founder and CEO of Xilis, Inc., a company that develops droplet organoids for clinical diagnostics. This study does not overlap with Xilis’ commercial interests. P.R.T. serves as a consultant for Surrozen Inc., Cellarity Inc., and Celldom Inc., on work not related to the contents of this manuscript.

Figures

Figure 1.
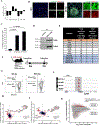
Figure 1.. AP-1 mediates epigenome-wide increase in nucleosome occupancy in KrasG12D mutant alveolar cells.
A. Schematic showing the experimental design. B. Representative H&E image of a lung section from a 4w SK mouse. Scale bar represents 1 mm. C. PCA of ATAC-seq data from AEC2 and SK 4w neoplastic cells. D. MA-plot showing the differentially accessible chromatin regions in SK 4w and AEC2. E. TF motifs enriched in the newly open regions in SK 4w neoplastic cells. F. ATAC-seq signal tracks at Ccnd1 and Pik3r1 loci. Newly open regions are shaded. * indicates the presence of AP-1 motif site in the peak. G. BaGFoot analysis of ATAC-seq data from AEC2 and 4w SK neoplastic cells. AP-1 TFs are circled. H. Plot showing the normalised ATAC-seq read count of SK 4w and AEC2 cells at the AP-1 motif sites present in differentially accessible regions. I. Plot showing nucleosome occupancy computed from ATAC-seq of AEC2 and SK 4w neoplastic cells at AP-1 (left) and CTCF (right) motif sites in constitutive and newly open peaks. J. Representative H&E images of the primary human lung adenocarcinoma and the PDX generated from it. Both the primary and PDX tumour cells consist of sheets and nests of large, pleomorphic neoplastic epithelial cells devoid of glandular or squamous differentiation. Scale bar represents 50 μm. K. Heatmap showing differentially accessible regions on the chromatin of normal human pulmonary epithelial cells and lung adenocarcinoma cells. L. TF motifs enriched in the newly open regions (with log2 FC > 4) in human lung adenocarcinoma.
Figure 2.
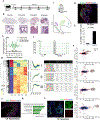
Figure 2.. Pharmacological inhibition of AP-1 reduces proliferation of Kras-mutant AEC2 cells in vitro and in vivo.
(A-B) Normal AEC2 cells from SK mice were plated in matrigel containing 4-OHT to induce KrasG12D expression for 24 hours. They were also treated with AP-1 inhibitor SR 11302 or DMSO (vehicle control) and colony (spheroid) formation ability of the cells was assayed after 8 days. A. Representative IF images showing the sphere formation ability. Scale bar represents 500 μm. B. Quantification of spheroid size and number (n=3 independent experiments). (C-D) Normal AEC2 cells from Sftpc-CreER; R26R-tdTomato mice were plated in matrigel. They were treated with AP-1 inhibitor SR 11302 or DMSO (vehicle control) and colony (spheroid) formation ability of the cells was assayed after 8 days. C. Representative IF images showing the sphere formation ability. Scale bar represents 500 μm. D. Quantification of spheroid size and number (n=3 independent experiments). (E-F) Normal AEC2 cells from SK mice were plated in matrigel containing 4-OHT to induce KrasG12D expression for 24 hours. They were also treated with AP-1 inhibitor T-5224 or DMSO (vehicle control) and colony (spheroid) formation ability of the cells was assayed after 8 days. E. Representative IF images showing the sphere formation ability. Scale bar represents 500 μm. F. Quantification of spheroid size and number (n=3 independent experiments). (G-H) Normal AEC2 cells from Sftpc-CreER; R26R-tdTomato mice were plated in matrigel. They were treated with AP-1 inhibitor T-5224 or DMSO (vehicle control) and colony (spheroid) formation ability of the cells was assayed after 8 days. G. Representative IF images showing the sphere formation ability. Scale bar represents 500 μm. H. Quantification of spheroid size and number (n=3 independent experiments). I. Schematic showing the experimental design. J. Representative IF images showing Ki67 in red and tdTomato in green in mice treated with DMSO or SR 11302. DAPI in blue labels nuclei and scale bar represents 50 μm. K. The bar plot shows the percent of Ki67+ cells among the lineage labelled population in SR 11302 and DMSO treated mice (n=5 mice/condition).
Figure 3.
Figure 3.. FOSL1 based AP-1 complex recruits mSWI/SNF to displace nucleosomes in Kras-mutant cells.
A. Bar plot summarising the changes to expression levels of AP-1 genes in the SK model as detected by RNA-seq. * indicates statistical significance (q value < 0.05 and |FC| > 1.5). B. Representative IF images showing the expression of Fosl1 (red) and tdTomato (green) in SC (WT) and SK 4w lungs. DAPI (blue) shows nuclei and the scale bar represents 100 μm. Zoomed-in single-channel images are shown for the regions highlighted by inset-squares. C. Quantification of FOSL1+ lineage-labelled cells from Fig. 3B (n=3 mice/condition). (D-E) FOSL1 was immunoprecipitated from A549-Fosl1-Flag cell line. A549 WT was used as control. D. Representative Western Blot images showing the detection of Flag tag and FOSL1 protein. E. AP-1 and mSWI/SNF complex proteins co-immunoprecipitated with FOSL1 as identified by MS. F. Schematic showing the experimental design. G. (right) FACS gating used to isolate GFP+ population among lineage labelled (tdTomato+) cells from SFK mice at 4 weeks post Cre induction. (left) SK 4w neoplastic cells were used as a negative control. H. BaGFoot analysis of ATAC-seq data from AEC2 and SFK 4w neoplastic cells (tdTom+ GFP+). AP-1 transcription factors are circled. I. BaGFoot analysis of ATAC-seq data from SK 4w neoplastic cells and SFK 4w neoplastic cells (tdTom+ GFP+). AP-1 transcription factors are circled. J. FOSL1 ChIP-seq tracks at Lym1 locus. ATAC-seq signal track is shown for reference. Common peak has been shaded. K. FOSL1 binding sites, identified by ChIP-seq, in differentially accessible regions are shown in red in the MA-plot from Fig. 1D.
Figure 4.
Figure 4.. De-multiplexing cellular plasticity and proliferative signal in club cell origin tumours.
A. Schematic showing the experimental design. B. Representative H&E images of lung sections from CK mice at 4, 10, 16 and 22 weeks after tamoxifen doses. Scale bar represents 1 mm (whole-lobe images) and 100 μm (zoomed-in regions). C. PCA of ATAC-seq data from normal club cells and neoplastic cells from CK (4w, 10w, 16w and 22w) mouse lungs. Arrow indicates tumour progression. D. Representative IF image showing the expression of FOSL1 (green) and fGFP (red) in CK 22w lungs. DAPI (blue) shows nuclei and the scale bar represents 25 μm. E. Quantification of FOSL1+ lineage-labelled cells from Fig. 4D (n=3 mice/condition). F. BaGFoot analysis of ATAC-seq data from club and CK neoplastic cells. AP-1 transcription factors are circled. G. Plot showing the normalised ATAC-seq read count of CK 22w and club cells at the AP-1 motif sites present in differentially accessible regions. H. Heatmap shows the differentially accessible regions on the chromatin of club and CK neoplastic cells. Hierarchical clustering of these regions yields three groups with distinct temporal dynamics. The tables on the right show the top enriched TF motifs found in the respective cluster. I. ATAC-seq signal tracks at the Ccnd1 locus. Newly open region is shaded. * indicates the presence of AP-1 motif site in the peak. J. Representative IF image showing the expression of NKX2.1 (red) and fGFP (green) in CK 22w hyperplastic regions. DAPI (blue) shows nuclei and the scale bar represents 50 μm. K. Gene Ontology terms, obtained from GREAT analysis, for the peaks in Cluster III (Figure 4H) harbouring an NKX2.1 motif. L. Representative image showing the expression of SPC (red) and fGFP (green) cells in CK 4w hyperplastic cells. DAPI, shown in blue, labels the nuclei and the scale represents 50 μm. Zoomed-in single-channel images are shown for the regions highlighted in the inset.
Figure 5.
Figure 5.. Analysis of CK tumours at single-cell resolution.
A. UMAP visualisation of normal epithelial and neoplastic cells from CC and CK models. B. UMAP showing various cell-types identified by scRNA-seq. C. UMAP showing the expression of Scgb1a1. D. UMAP showing the expression of Sftpc. E. UMAP plots showing the expression of indicated genes. F. Heatmap showing the expression of differentially expressed genes in normal epithelial and neoplastic cell-types. G. Heatmap showing pathways enriched in neoplastic cell clusters. H. Bar-plot showing the pathways upregulated in club-like neoplastic cells when compared to normal club cells. I. RNA velocity analysis showing cellular trajectories in CK neoplastic cell populations. (J-L) Four doses of tamoxifen were injected to CK mice and lungs were harvested after 2 days. Lysotracker fGFP+ cells were isolated by FACS and plated with MRC5 fibroblasts in matrigel. The cells were cultured for ten days before fixation. J. Representative IF image showing the organoids. fGFP is shown in green, brightfield in grey and scale bar represents 200 μm. K. Representative IF image showing the expression of SFTPC (red) and fGFP (green). DAPI (blue) shows nuclei and the scale bar represents 50 μm. L. Quantification showing the fraction of SPC+ cells in an organoid from Fig. 5K (n= 3 independent experiments).
Figure 6.
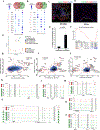
Figure 6.. Cell of origin influences the neoplastic cell state.
A. (top) Venn diagram showing the number of overlapping newly open regions that harbour an AP-1 motif in SK 4w and CK 22w neoplastic cells. (bottom) Bubble plot showing the top enriched motifs in the neighbourhood of putative AP-1 binding sites. B. (top) Venn diagram showing the number of overlapping newly open regions that harbour an AP-1 motif in SK 4w and CK 16w neoplastic cells. (bottom) Bubble plot showing the top enriched motifs in the neighbourhood of putative AP-1 binding sites. C. Representative IF image showing the level of NICD (green) in CK 22w lungs. Lineage label fGFP is shown in red and DAPI (blue) represents nuclei. Scale bar represents 25 μm. D. Representative IF image showing the level of NICD (green) in SK 4w lungs. E-cadherin is shown in red and DAPI (blue) represents nuclei. Scale bar represents 50 μm. E. Quantification of NICD+ cells in hyperplastic regions of SK 4w and CK (16w and 22w) lungs from Fig. 6B–C (n=3 mice/condition). F. GSEA of RNA-seq data shows that Notch activity has reduced in SK 4w neoplastic cells when compared to AEC2. G. PCA of ATAC-seq data from normal and neoplastic cells collected from SC (AEC2), CC (Club, CC10+ AEC2 and CC10 AEC2), SK (4w) and CK (4w, 10w, 16w, 22w and 22w tumour-excised) mouse lungs. H. BaGFoot analysis of ATAC-seq data from CC10− AEC2 and Club cells. I. BaGFoot analysis of ATAC-seq data from SK 4w and CK 16w neoplastic cells. J. BaGFoot analysis of ATAC-seq data from SK 4w and CK 22w neoplastic cells. (K-P) ATAC-seq signal tracks at Foxi1 (K), Trp73 (L), Fmnl2 (M), Sox2 (N), Scgb1a1 (O) and Hey1 (P) loci.
Figure 7.
Figure 7.. Identification of a mutant-Kras epigenetic signature conserved across tissues.
A. Plot showing nucleosome occupancy computed from ATAC-seq of HF stem cells and neoplastic cells derived from them (Lgr5 EpCAM+) at AP-1 (left) and CTCF (right) motif sites in constitutive and newly open peaks. Data from (Latil et al., 2017). B. ATAC-seq heatmap showing conserved regions with increased accessibility in Kras-mutant neoplastic cells derived from AEC2, club, HF stem and intra-follicular epidermal stem cells, and harbouring an AP-1 motif. C. GREAT analysis of the regions shown in Figure 7B. D. Schematic showing the experimental design. E. Representative H&E images of intestinal sections from LK mice. Scale bar represents 100 μm. F. BaGFoot analysis of ATAC-seq data from early stage (5w) Kras mutant and WT Lgr5+ stem cells. AP-1 transcription factors are circled. G. BaGFoot analysis of ATAC-seq data from late stage (17–25w) Kras mutant and WT Lgr5+ stem cells. AP-1 transcription factors are circled.

Comment in

Similar articles

Cited by

References

    1. Adamson JS, Senior RM, and Merrill T (1969). Alveolar cell carcinoma: An electron microscopic study. American Review of Respiratory Disease 100, 550–557. - PubMed
    1. Aivado M, Gynes M, Gorelov V, Schmidt W, Röher H, and Goretzki P (2000). “ Field cancerization”--an additional phenomenon in development of colon tumors? K-ras codon 12 mutations in normal colonic mucosa of patients with colorectal neoplasms. Der Chirurg; Zeitschrift fur alle Gebiete der operativen Medizen 71, 1230–1234; discussion 1234–1235. - PubMed
    1. Allen J, Hao S, Sears CL, and Timp W (2019). Epigenetic changes induced by Bacteroides fragilis toxin. Infection and immunity 87, e00447–00418. - PMC - PubMed
    1. Ardito CM, Grüner BM, Takeuchi KK, Lubeseder-Martellato C, Teichmann N, Mazur PK, DelGiorno KE, Carpenter ES, Halbrook CJ, and Hall JC (2012). EGF receptor is required for KRAS-induced pancreatic tumorigenesis. Cancer cell 22, 304–317. - PMC - PubMed
    1. Avila PC (2011). Plasticity of airway epithelial cells. Journal of Allergy and Clinical Immunology 128, 1225–1226. - PMC - PubMed

Publication types

MeSH terms