. 2022 Mar:568:56-71.
doi: 10.1016/j.virol.2022.01.011. Epub 2022 Feb 2.

Analysis of SARS-CoV-2 synonymous codon usage evolution throughout the COVID-19 pandemic

Affiliations

Analysis of SARS-CoV-2 synonymous codon usage evolution throughout the COVID-19 pandemic

Ezequiel G Mogro et al. Virology. 2022 Mar.

Abstract

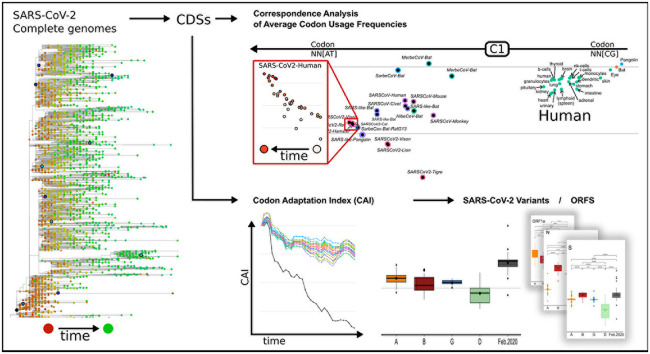
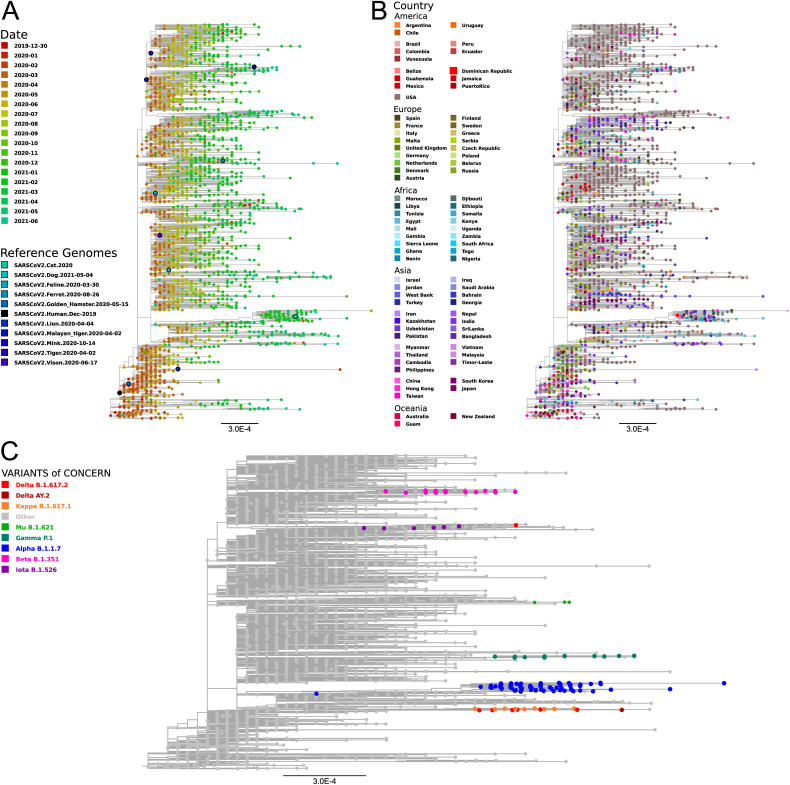
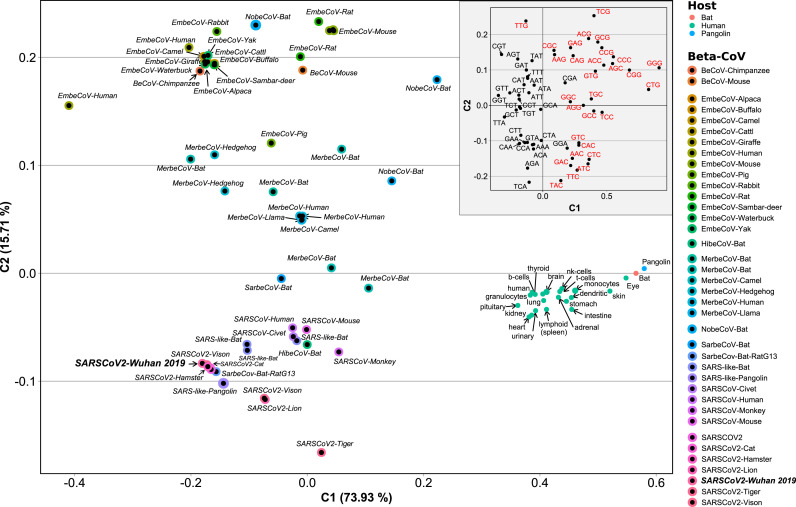
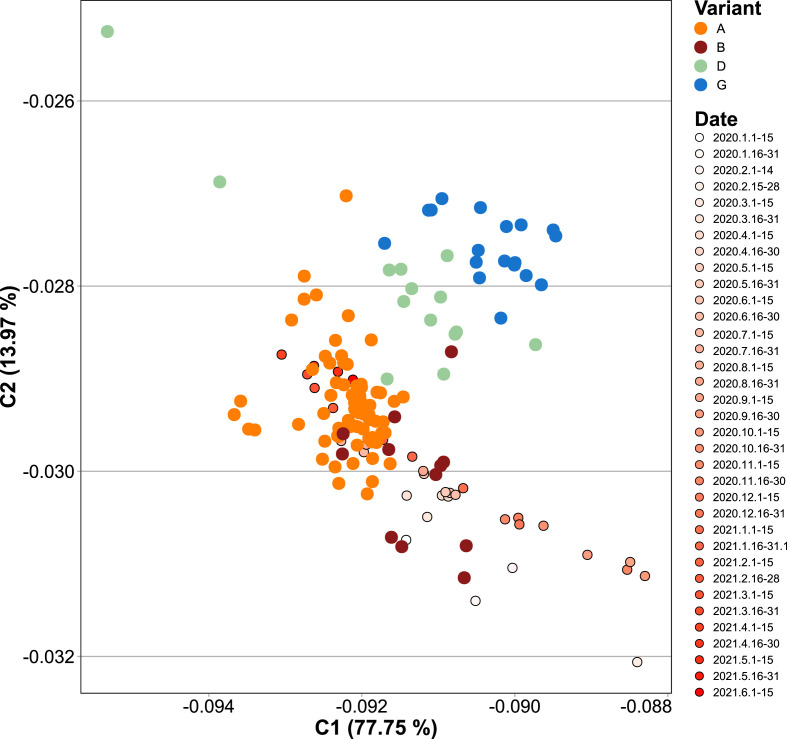
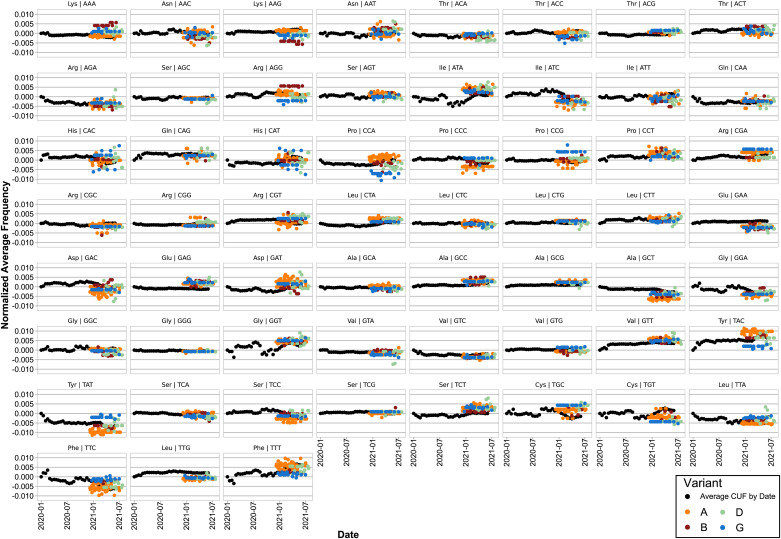
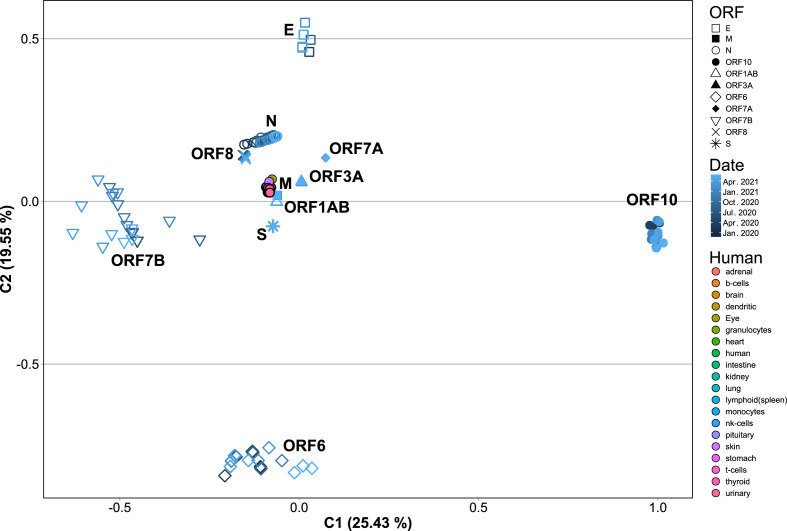
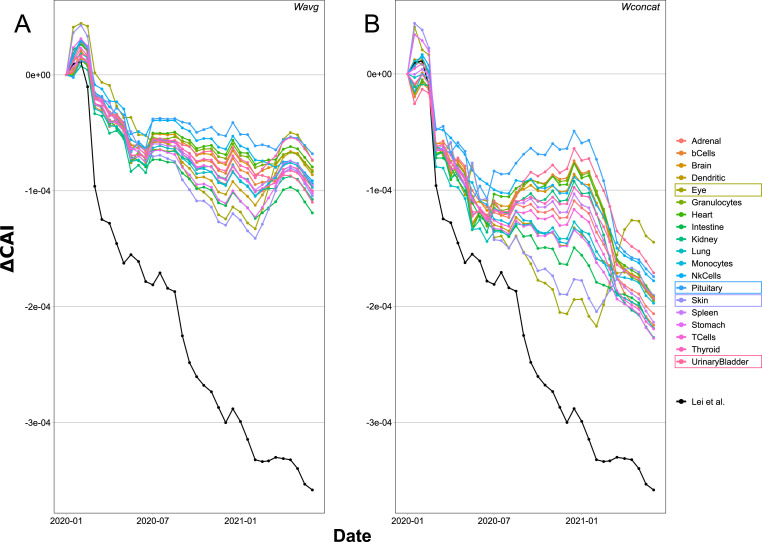
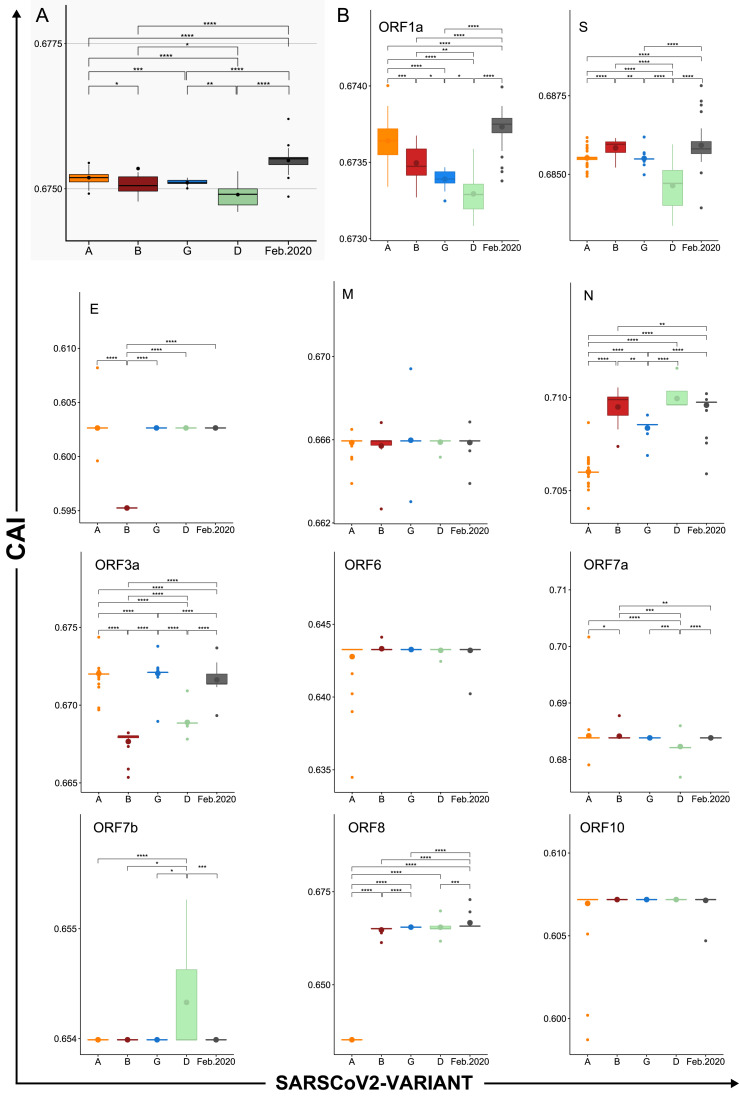
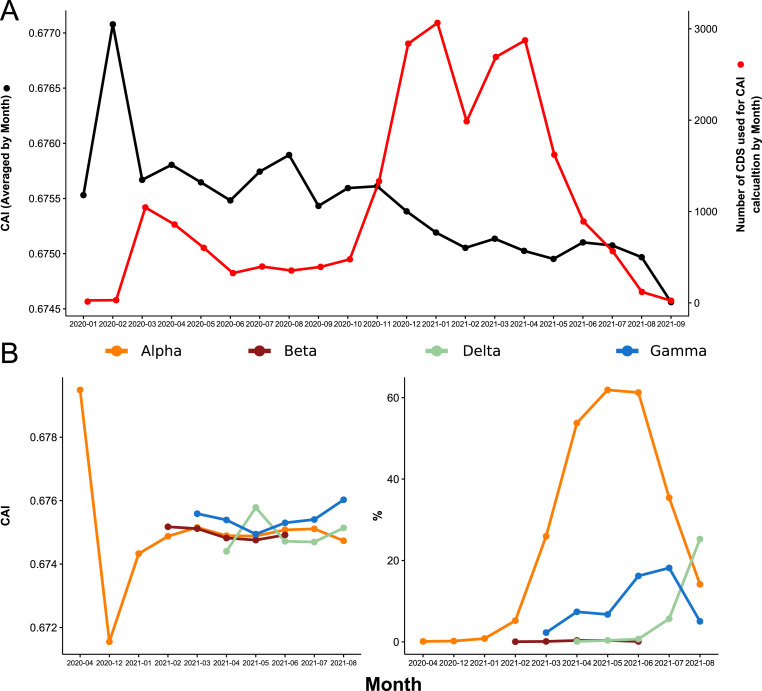
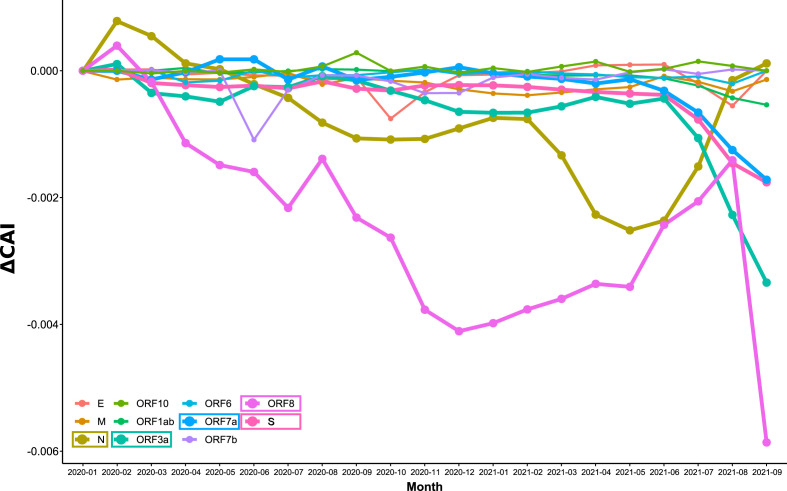
SARS-CoV-2, the seventh coronavirus known to infect humans, can cause severe life-threatening respiratory pathologies. To better understand SARS-CoV-2 evolution, genome-wide analyses have been made, including the general characterization of its codons usage profile. Here we present a bioinformatic analysis of the evolution of SARS-CoV-2 codon usage over time using complete genomes collected since December 2019. Our results show that SARS-CoV-2 codon usage pattern is antagonistic to, and it is getting farther away from that of the human host. Further, a selection of deoptimized codons over time, which was accompanied by a decrease in both the codon adaptation index and the effective number of codons, was observed. All together, these findings suggest that SARS-CoV-2 could be evolving, at least from the perspective of the synonymous codon usage, to become less pathogenic.

Keywords: Betacoronavirus; COVID-19; Codon usage bias; SARS-CoV-2.


Conflict of interest statement

The authors declare that they have no known competing financial interests or personal relationships that could have appeared to influence the work reported in this paper.

Figures

Image 1
Graphical abstract
Fig. 1
Fig. 1
Maximum Likelihood Phylogenetic tree of Betacoronavirus. Maximum Likelihood phylogenetic tree constructed using full genomes of betacoronaviruses belonging to the subgenuses Sarbecovirus, Nobecovirus, Merbecovirus and Embecovirus. Genomic sequences were downloaded from NCBI Virus database, aligned with MAFFT and a ML phylogenetic tree was constructed with IQTree. The most relevant Beta-CoV isolates are highlighted with different colors. Blue: human SARS-CoV-2 Wuhan 2019 isolate. Purple: Pangolin-CoVs and Bat RaTG13, SL-CoVZC45 and SL-CoVZXC21 isolates. Red: human SARS-CoV Tor2 isolate. Teal: human MERS-CoV isolates. Orange: Human CoVs from the Embecovirus subgenus. Numbers represent the bootstrap support for each node.
Fig. 2
Fig. 2
SARS-CoV-2 Maximum Likelihood phylogenetic tree constructed with Fasttree using full genomes of isolates with different collection dates and geographic origins. Genomic sequences were downloaded from NCBI virus database, selecting isolates from different geographic regions, SARS-CoV-2 variants and collection dates. Nucleotide sequences were aligned with MAFFT and a ML phylogenetic tree was constructed with Fasttree. A) Leaves colored by time. Different colors from red (Dic-2019) to green (Jun-2021). Reference sequences correspond to SARS-CoV-2 isolated from human (Wuhan isolate 2019) and different animals. B). Leaves colored by geographic region. C) Leaves colored by SARS-CoV-2 variant. Only Alpha, Beta Gamma, Delta, Mu, Iota and Kappa are shown.
Fig. 3
Fig. 3
Correspondence Analysis of Average Codon Usage Frequencies (ACUF) for Betacoronavirus and their hosts: Human, Bat, and Pangolin. Coding sequences for SARS-CoV-2 and human genes were downloaded from NCBI and ACUFs were calculated and used in a Correspondence Analysis as described in the Material and Methods section. The first two components representing 89% of the total inertia are shown. The Inner plot (light gray shading) corresponds to the column variables (codons). Red: Codons with C or G in the third position. Black: Codons with A or T in the third position.
Fig. 4
Fig. 4
Correspondence Analysis of Average Codon Usage Frequencies (ACUF) for SARS-CoV-2 time-series and human tissues. Coding sequences for SARS-CoV-2, Human, Bat, and Pangolin genes were downloaded from NCBI and ACUFs were calculated and used in a Correspondence Analysis as described in the Material and Methods section. On this figure, only the points corresponding to the concatenated SARS-CoV-2 coding sequences binned by date, and human genes with elevated expression in different tissues are shown. The Inner plot shows an amplification of the SARS-CoV-2 region of the graph. Colors represent the collection date, from Jan-2020 to Jun-2021.
Fig. 5
Fig. 5
Correspondence Analysis of Average Codon Usage Frequencies (ACUF) for SARS-CoV-2 time-series and selected variants of interest. Coding sequences for SARS-CoV-2 time-series, and for a manual selection of genomes representing Alpha (A), Beta (B), Gamma (G), and Delta (D) variants were downloaded, their ACUFs calculated, and a correspondence analysis was performed as described in the Material and Methods section. The first two components representing 91% of the total inertia are shown.
Fig. 6
Fig. 6
Evolution of the Average Codon Usage Frequency (ACUF) for each codon over time. ACUFs were calculated for concatenated SARS-CoV-2 genes grouped by fortnight, and normalized by subtracting the values registered for the first half of January 2020. Black points represent the ACUF for SARS-CoV-2 isolates from the time series dataset. Color points correspond to selected SARS-CoV-2 variants of interest: A (Alpha) orange, B (Beta) dark red, D (Delta) light green, and G (Gamma) blue.
Fig. 7
Fig. 7
Correspondence analysis of ACUF for each SARS-CoV-2 ORF from the time-series dataset averaged by month. The coding sequences corresponding to ORF1ab, S, M, N, E, ORF3a, ORF6, ORF7a, ORF7b, ORF8, and ORF10 were extracted from the SARS-CoV-2 time-series dataset, their ACUF were calculated, averaged by month and a CA was performed. Shapes indicate the different ORFs. Dark to light blue colors indicate dates from Jan-2020 to Jun-2021. Human: colors indicate the ACUF for genes with elevated expression in different tissues.
Fig. 8
Fig. 8
Correspondence Analysis of Codon Usage Frequencies for each SARS-CoV-2 ORF from Alpha, Beta, Gamma and Delta variants. The coding sequences corresponding to ORF1ab, S, M, N, E, ORF3a, ORF6, ORF7a, ORF7b, ORF8, and ORF10 were extracted from the genomes of SARS-CoV-2 Alpha (A), Beta (B), Gamma (G), and Delta (D) variants, their codon usage frequencies were calculated and a CA was performed. Shapes indicate the different ORFs. Human: colors indicate the ACUF for genes with elevated expression in different tissues.
Fig. 9
Fig. 9
Evolution of the Codon Adaptation Index (CAI) over time for SARS-CoV-2 calculated in reference to different human tissues. CAI was calculated for the concatenated SARS-CoV-2 genes using elevated proteins on each human tissue as reference set, and averaged by month. The figure shows the difference of CAI for each month with the values calculated for Jan-2020 (ΔCAI). Human highly expressed proteins for each tissue were obtained from the human protein atlas. A) CAI values obtained using Wavg. B) CAI values obtained using Wconcat. The black line corresponds to CAI values calculated using WLei.
Fig. 10
Fig. 10
Differences in CAI between SARS-CoV-2 variants and their ORFs. CAI values calculated for concatenated SARS-CoV-2 genes using WLei for a selection of genomes representing different dates, variants and geographic locations. A) Box plot of CAI values grouped by variant. B) Box plots of CAI values calculated for the indicated ORFs and grouped by variant. Horizontal lines represent medians. Bigger dots represent mean values. Asterisks represent significant differences. Alpha (A), Beta (B), Gamma (G), and Delta (D) variants. P values were calculated using Wilcoxon rank sum test (* < 0.05, ** < 0.01, *** < 0.001, **** < 0.0001).
Fig. 11
Fig. 11
Evolution of CAI over time for the California dataset. CAI was calculated for concatenated SARS-CoV-2 genes using WLei and averaged by month. A) CAI calculated for the complete dataset. Black line, Evolution of average CAI values over time. Red line, total number of coding sequences (CDS) analyzed for each month. B) Left, CAI values for selected variants of interest. Right, percentage of coding sequences belonging to each variant.
Fig. 12
Fig. 12
Evolution of CAI over time for each SARS-CoV-2 ORF of the California dataset. CAI values were calculated for each SARS-CoV-2 ORF using WLei and averaged by month. In the figure, the difference of CAI with respect to Jan-2020 is represented (ΔCAI). Lines for the ORFs with greater variation over time are thicker (N, S, ORF3a, ORF7a, and ORF8).

Similar articles

Cited by

References

    1. Alonso A.M., Diambra L. SARS-CoV-2 codon usage bias downregulates host expressed genes with similar codon usage. Front. Cell Dev. Biol. 2020:831. doi: 10.3389/FCELL.2020.00831. 0. - DOI - PMC - PubMed
    1. Andersen K.G., Rambaut A., Lipkin W.I., Holmes E.C., Garry R.F. The proximal origin of SARS-CoV-2. Nat. Med. 2020;264(26):450–452. doi: 10.1038/s41591-020-0820-9. 2020. - DOI - PMC - PubMed
    1. Bulmer M. The selection-mutation-drift theory of synonymous codon usage. Genetics. 1991;129:897–907. - PMC - PubMed
    1. Butt A.M., Nasrullah I., Qamar R., Tong Y. 2019. Evolution of Codon Usage in Zika Virus Genomes Is Host and Vector Specific. 107. - PMC - PubMed
    1. Callaway E. Heavily mutated Omicron variant puts scientists on alert. Nature. 2021;600:21. doi: 10.1038/d41586-021-03552-w. 21. - DOI - PubMed

Publication types