

Assessing the validity of plasma phospholipid fatty acids as biomarkers of dairy fat intake using data from a randomized controlled intervention trial
- PMID: 35134818
- PMCID: PMC9170464
- DOI: 10.1093/ajcn/nqac029
Assessing the validity of plasma phospholipid fatty acids as biomarkers of dairy fat intake using data from a randomized controlled intervention trial
Abstract
Background: Plasma phospholipid pentadecanoic acid (C15:0), heptadecanoic acid (C17:0), and trans-palmitoleic acid (trans-C16:1n-7) are correlates of dairy fat intake. However, their relative concentrations may be influenced by other endogenous factors, such as liver fat content, and their validity as biomarkers of dairy fat intake has yet to be established.
Objectives: We investigated whether liver fat content modifies relations between concentrations of C15:0, C17:0, and trans-C16:1n-7 (alone and in combination with iso-C17:0) and known dairy fat intake in the context of a randomized controlled intervention study. We further examined the proportion of dairy fat intake explained by these fatty acids on their own and when considering liver fat content.
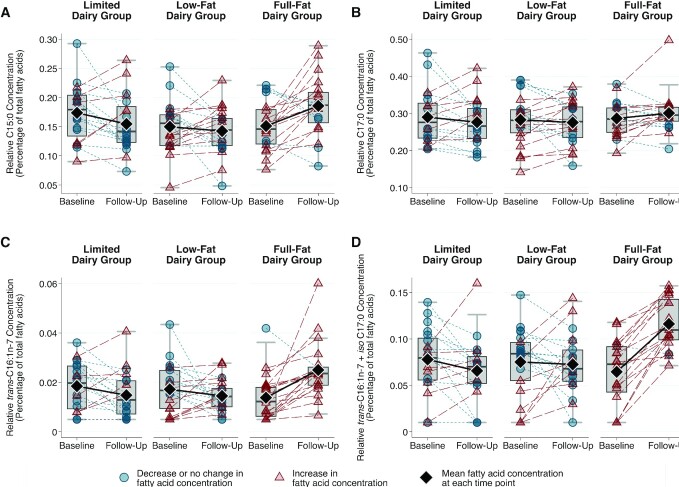
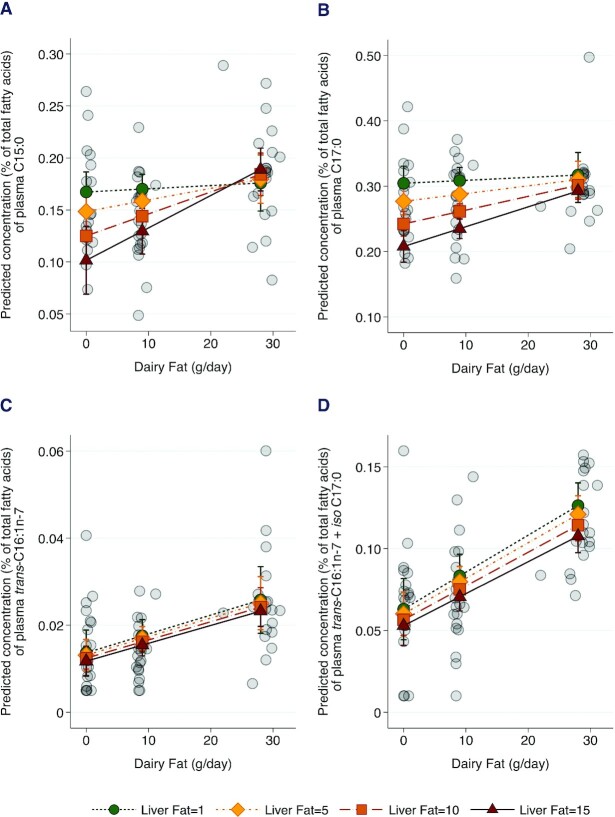
Methods: We used data from a 12-wk intervention trial in which participants (n = 62) consumed diets limited in dairy (0.3 g/d of dairy fat), rich in low-fat dairy (8.7 g/d of dairy fat), or rich in full-fat dairy (28.5 g/d of dairy fat). We used linear regression models to examine relations between relative fatty acid concentrations and grams per day of dairy fat intake, liver fat percentage, and their interaction.
Results: Only trans-C16:1n-7 in isolation (β: 0.0004 ± 0.0002, P = 0.03) and combined with iso-C17:0 (β: 0.002 ± 0.0005, P < 0.0001) were consistently positively associated with dairy fat intake regardless of liver fat content. Trans-C16:1n-7 combined with iso-C17:0 also explained the greatest proportion of variation (35.4%) in dairy fat intake. C15:0 and C17:0 were not associated with dairy fat intake after adjusting for liver fat and were predicted to be higher in relation to increased dairy fat intake only among individuals with elevated liver fat.
Conclusions: The potential for liver fat to affect relative plasma phospholipid concentrations of C15:0 and C17:0 raises questions about their validity as biomarkers of dairy fat intake. Of the fatty acid measures tested, trans-C16:1n-7 combined with iso-C17:0, especially with adjustment of liver fat, age, and sex, may provide the most robust estimate of dairy fat consumption.
Keywords: biomarker; dairy; full-fat dairy; liver fat; plasma phospholipid fatty acids.
© The Author(s) 2022. Published by Oxford University Press on behalf of the American Society for Nutrition.
Figures
Similar articles
-
Evaluation of plasma and erythrocyte fatty acids C15:0, t-C16:1n-7 and C17:0 as biomarkers of dairy fat consumption in adolescents.Prostaglandins Leukot Essent Fatty Acids. 2019 Oct;149:24-29. doi: 10.1016/j.plefa.2019.07.007. Epub 2019 Jul 3. Prostaglandins Leukot Essent Fatty Acids. 2019. PMID: 31421524 Clinical Trial.
-
Plasma Fatty Acid Biomarkers of Dairy Consumption Are Associated with Sex-Dependent Effects on Metabolic Syndrome Components in Mexican Adolescents.Ann Nutr Metab. 2023;79(4):343-354. doi: 10.1159/000531972. Epub 2023 Aug 22. Ann Nutr Metab. 2023. PMID: 37607502 Free PMC article.
-
Potential Biomarkers for Fat from Dairy and Fish and Their Association with Cardiovascular Risk Factors: Cross-sectional Data from the LifeLines Biobank and Cohort Study.Nutrients. 2019 May 17;11(5):1099. doi: 10.3390/nu11051099. Nutrients. 2019. PMID: 31108924 Free PMC article.
-
Fatty acids as biomarkers of total dairy and dairy fat intakes: a systematic review and meta-analysis.Nutr Rev. 2019 Jan 1;77(1):46-63. doi: 10.1093/nutrit/nuy048. Nutr Rev. 2019. PMID: 30307550
-
Can individual fatty acids be used as functional biomarkers of dairy fat consumption in relation to cardiometabolic health? A narrative review.Br J Nutr. 2022 Dec 28;128(12):2373-2386. doi: 10.1017/S0007114522000289. Epub 2022 Jan 28. Br J Nutr. 2022. PMID: 35086579 Free PMC article. Review.
Cited by
-
Fat and fatty acids - a scoping review for Nordic Nutrition Recommendations 2023.Food Nutr Res. 2024 Jan 12;68. doi: 10.29219/fnr.v68.9980. eCollection 2024. Food Nutr Res. 2024. PMID: 38327998 Free PMC article.
-
Potential benefits of metformin and pioglitazone combination therapy via gut microbiota and metabolites in high-fat diet-fed mice.Front Pharmacol. 2022 Oct 11;13:1004617. doi: 10.3389/fphar.2022.1004617. eCollection 2022. Front Pharmacol. 2022. PMID: 36304148 Free PMC article.
References
-
- Willett W. Nutritional epidemiology. New York: Oxford University Press; 1998.
-
- Smedman AE, Gustafsson IB, Berglund LG, Vessby BO. Pentadecanoic acid in serum as a marker for intake of milk fat: relations between intake of milk fat and metabolic risk factors. Am J Clin Nutr. 1999;69(1):22–9. - PubMed
-
- Wolk A, Furuheim M, Vessby B. Fatty acid composition of adipose tissue and serum lipids are valid biological markers of dairy fat intake in men. J Nutr. 2001;131(3):828–33. - PubMed
-
- Wolk A, Vessby B, Ljung H, Barrefors P. Evaluation of a biological marker of dairy fat intake. Am J Clin Nutr. 1998;68(2):291–5. - PubMed
-
- Pranger IG, Corpeleijn E, Muskiet FAJ, Kema IP, Singh-Povel C, Bakker SJL. Circulating fatty acids as biomarkers of dairy fat intake: data from the lifelines biobank and cohort study. Biomarkers. 2019;24(4):360–72. - PubMed
Publication types
MeSH terms
Substances
Grants and funding
LinkOut - more resources
Full Text Sources
Medical
