

Plotgardener: cultivating precise multi-panel figures in R
- PMID: 35134826
- PMCID: PMC8963281
- DOI: 10.1093/bioinformatics/btac057
Plotgardener: cultivating precise multi-panel figures in R
Abstract
Motivation: The R programming language is one of the most widely used programming languages for transforming raw genomic datasets into meaningful biological conclusions through analysis and visualization, which has been largely facilitated by infrastructure and tools developed by the Bioconductor project. However, existing plotting packages rely on relative positioning and sizing of plots, which is often sufficient for exploratory analysis but is poorly suited for the creation of publication-quality multi-panel images inherent to scientific manuscript preparation.
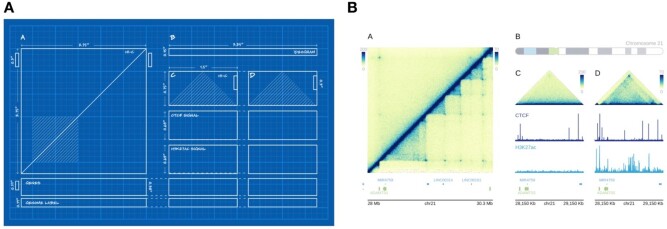
Results: We present plotgardener, a coordinate-based genomic data visualization package that offers a new paradigm for multi-plot figure generation in R. Plotgardener allows precise, programmatic control over the placement, esthetics and arrangements of plots while maximizing user experience through fast and memory-efficient data access, support for a wide variety of data and file types, and tight integration with the Bioconductor environment. Plotgardener also allows precise placement and sizing of ggplot2 plots, making it an invaluable tool for R users and data scientists from virtually any discipline.
Availability and implementation: Package: https://bioconductor.org/packages/plotgardener, Code: https://github.com/PhanstielLab/plotgardener, Documentation: https://phanstiellab.github.io/plotgardener/.
Supplementary information: Supplementary data are available at Bioinformatics online.
© The Author(s) 2022. Published by Oxford University Press. All rights reserved. For permissions, please e-mail: journals.permissions@oup.com.
Figures
Similar articles
-
DNAshapeR: an R/Bioconductor package for DNA shape prediction and feature encoding.Bioinformatics. 2016 Apr 15;32(8):1211-3. doi: 10.1093/bioinformatics/btv735. Epub 2015 Dec 14. Bioinformatics. 2016. PMID: 26668005 Free PMC article.
-
Sushi.R: flexible, quantitative and integrative genomic visualizations for publication-quality multi-panel figures.Bioinformatics. 2014 Oct;30(19):2808-10. doi: 10.1093/bioinformatics/btu379. Epub 2014 Jun 5. Bioinformatics. 2014. PMID: 24903420 Free PMC article.
-
karyoploteR: an R/Bioconductor package to plot customizable genomes displaying arbitrary data.Bioinformatics. 2017 Oct 1;33(19):3088-3090. doi: 10.1093/bioinformatics/btx346. Bioinformatics. 2017. PMID: 28575171 Free PMC article.
-
Orchestrating high-throughput genomic analysis with Bioconductor.Nat Methods. 2015 Feb;12(2):115-21. doi: 10.1038/nmeth.3252. Nat Methods. 2015. PMID: 25633503 Free PMC article. Review.
-
Orchestrating single-cell analysis with Bioconductor.Nat Methods. 2020 Feb;17(2):137-145. doi: 10.1038/s41592-019-0654-x. Epub 2019 Dec 2. Nat Methods. 2020. PMID: 31792435 Free PMC article. Review.
Cited by
-
Genetic coupling of enhancer activity and connectivity in gene expression control.Nat Commun. 2025 Jan 27;16(1):970. doi: 10.1038/s41467-025-55900-3. Nat Commun. 2025. PMID: 39870618 Free PMC article.
-
Three-dimensional chromatin re-organization during muscle stem cell aging.Aging Cell. 2023 Apr;22(4):e13789. doi: 10.1111/acel.13789. Epub 2023 Feb 2. Aging Cell. 2023. PMID: 36727578 Free PMC article.
-
Ribosome biogenesis disruption mediated chromatin structure changes revealed by SRAtac, a customizable end to end analysis pipeline for ATAC-seq.BMC Genomics. 2023 Sep 1;24(1):512. doi: 10.1186/s12864-023-09576-y. BMC Genomics. 2023. PMID: 37658321 Free PMC article.
-
Role of the Egr2 Promoter Antisense RNA in Modulating the Schwann Cell Chromatin Landscape.Biomedicines. 2024 Nov 13;12(11):2594. doi: 10.3390/biomedicines12112594. Biomedicines. 2024. PMID: 39595160 Free PMC article.
-
Dissection of a CTCF topological boundary uncovers principles of enhancer-oncogene regulation.Mol Cell. 2024 Apr 4;84(7):1365-1376.e7. doi: 10.1016/j.molcel.2024.02.007. Epub 2024 Mar 6. Mol Cell. 2024. PMID: 38452764 Free PMC article.
References
-
- Adobe Inc. (2019) Adobe Illustrator (CC 2019 (23.0.3)) [Computer software]. https://adobe.com/products/illustrator (3 December 2021, date last acces....
-
- Apple Inc. (n.d.) Keynote (Version 11.0.1) [MacOS]. https://www.apple.com/keynote/.
-
- Auguie B. (2017) gridExtra: miscellaneous Functions for “Grid” Graphics. https://CRAN.R-project.org/package=gridExtra (3 December 2021, date last....
-
- Auguie B. (2019) egg: extensions for “ggplot2”: custom Geom, Custom Themes, Plot Alignment, Labelled Panels, Symmetric Scales, and Fixed Panel Size. https://CRAN.R-project.org/package=egg (3 December 2021, date last acces....
Publication types
MeSH terms
Grants and funding
LinkOut - more resources
Full Text Sources
Other Literature Sources
