. 2023 Mar 17;119(1):236-251.
doi: 10.1093/cvr/cvac012.

Rapid neutrophil mobilization by VCAM-1+ endothelial cell-derived extracellular vesicles

Collaborators, Affiliations

Rapid neutrophil mobilization by VCAM-1+ endothelial cell-derived extracellular vesicles

Naveed Akbar et al. Cardiovasc Res. .

Abstract

Aims: Acute myocardial infarction rapidly increases blood neutrophils (<2 h). Release from bone marrow, in response to chemokine elevation, has been considered their source, but chemokine levels peak up to 24 h after injury, and after neutrophil elevation. This suggests that additional non-chemokine-dependent processes may be involved. Endothelial cell (EC) activation promotes the rapid (<30 min) release of extracellular vesicles (EVs), which have emerged as an important means of cell-cell signalling and are thus a potential mechanism for communicating with remote tissues.

Methods and results: Here, we show that injury to the myocardium rapidly mobilizes neutrophils from the spleen to peripheral blood and induces their transcriptional activation prior to arrival at the injured tissue. Time course analysis of plasma-EV composition revealed a rapid and selective increase in EVs bearing VCAM-1. These EVs, which were also enriched for miRNA-126, accumulated preferentially in the spleen where they induced local inflammatory gene and chemokine protein expression, and mobilized splenic-neutrophils to peripheral blood. Using CRISPR/Cas9 genome editing, we generated VCAM-1-deficient EC-EVs and showed that its deletion removed the ability of EC-EVs to provoke the mobilization of neutrophils. Furthermore, inhibition of miRNA-126 in vivo reduced myocardial infarction size in a mouse model.

Conclusions: Our findings show a novel EV-dependent mechanism for the rapid mobilization of neutrophils to peripheral blood from a splenic reserve and establish a proof of concept for functional manipulation of EV-communications through genetic alteration of parent cells.

Keywords: Exosome; Myocardial infarction; Programming; Spleen.


Conflict of interest statement

Conflict of interest: none declared.

Figures

Graphical Abstract
Graphical Abstract
Figure 1
Figure 1
Human peripheral blood neutrophils correlate with the extent of myocardial injury in AMI. (A) Pearson’s correlation of peripheral blood neutrophil number (109/L) in patients experiencing AMI significantly correlated with the extent of myocardial injury (T2-weight MRI) and (B) LGE MRI 6-months post-AMI (n=15). (C) Schematic representation of mouse AMI and tissue harvesting for flow cytometry. (D) Percentage of neutrophils in peripheral blood, spleen, bone marrow, and heart 2 h after AMI in mice relative to the levels of intact controls (controls n = 4, AMI n = 3). (E) Mean fluorescence intensity of CD62L/L-selectin on mouse neutrophils in peripheral blood, spleen, bone marrow, and heart 2 h after AMI relative to the levels of intact controls (controls n = 4, AMI n = 3). (F) Percentage of monocytes in peripheral blood, spleen, bone marrow, and heart 2 h after AMI in mice relative to the levels of intact uninjured controls (controls n = 4, AMI n=3). Pearson’s correlation was used in (A) and (B), dotted lines represent 95% confidence interval and an unpaired t-test was used in (D)–(F) for statistical analysis. Error bars represent mean ± SD **P < 0.01, ***P < 0.001.
Figure 2
Figure 2
VCAM-1+ plasma EVs are elevated in peripheral blood following AMI. (A) Human plasma-EV number (108/mL) at time of presentation following AMI and 6 months later in the same patients (n =15). (B) Size and concentration profile of human plasma EVs at time of presentation following AMI and 6 months later in the same patients (n =15) determined by Nanoparticle Tracking Analysis. Pearson’s correlation of human plasma EVs at time of presentation vs. and: (C) LGE MRI 6-months post-AMI, (D) number of peripheral blood neutrophils following AMI (109/L) (n =15) in the same patients. (E) Heat map showing human plasma-EV markers CD9, CD63, CD81, ALIX, TSG101, flotillin-1, annexin V and (F) heat map showing human plasma-EV EC markers thrombomodulin, VEGFR2, endoglin, MCAM, ICAM-1, VCAM-1, VE-cadherin, tissue factor and CD16 in the same patients at: presentation, immediately following post-PCI, 6, 24, and 48 h post-PCI and 6 months post-AMI (n = 10 per time point). A paired t-test was used for statistical analysis in (A). Error bars in (B) represent mean ± SD. Heat maps in (E) and (F) are group means per time point. Values were normalized to the 6-month time point per patient. Pearson’s correlation was used in (C) and (D), dotted lines represent 95% confidence interval for statistical analysis. **P < 0.01.
Figure 3
Figure 3
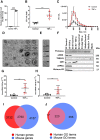
Human umbilical cord vein endothelial cells (HUVEC) release more EVs after inflammatory stimulation. (A) HUVECs: express more VCAM-1 following treatment with recombinant human TNF-α (10 ng/mL) (n = 9 per group); (B) release more EVs (n = 8 per group). (C) Size and concentration profile of HUVEC-derived EVs under basal conditions and after inflammatory stimulation with recombinant human TNF-α (n = 8 per group). (D) TEM of HUVEC-derived EVs (scale bar 100 nm) and (E) cryo-TEM HUVEC-derived EVs (scale bar 50 nm). (F) Ponceau stain and western blot of HUVEC-derived EV from basal and after inflammatory stimulation with TNF-α for eNOS, TSG101, CD9, ATP5A, and Histone H3. HUVEC cell pellets, EV-depleted cell culture supernatants (EV-dep), and cell culture media that was not exposed to cells (control media) were used as controls. EC-EV miRNA levels of (G) hsa-miRNA-126-3p and (H) hsa-miRNA-126-5p under basal conditions and after inflammatory stimulation with TNF-α (n = 8 per group). miRNA-126-mRNA targets in human and mouse and their target pathways. (I) Euler plot of miRNA-126-mRNA targets from TargetScanHuman, TargetScanMouse, miRWalk, miRDB for human and the mouse. (J) Euler plot of GO terms for miRNA-126-mRNA targets for the human and mouse. Shape areas are approximately proportional to number of genes. An unpaired t-test was used in (A), (B), (C), (G), and (H) for statistical analysis. Error bars represent mean ± SD **P < 0.01, ***P < 0.001.
Figure 4
Figure 4
RNA sequencing of human peripheral blood neutrophils. STEMI and NSTEMI patients at the time of presentation vs. a control sample obtained from the same patients 1 month post-AMI (n = 3 per group). MA plots show differential transcriptome at the time of presentation vs. a control sample obtained from the same patients 1 month post-AMI in (A) NSTEMI and (B) STEMI patients. Significantly altered genes are highlighted in red. (C) Euler plot showing similarity and differences in the number of differentially expressed (DE) genes in NSTEMI and STEMI patients at time of presentation vs. 1 month follow-control samples or between all NSTEMI and all STEMI patients (n = 3 per group). (D) miRNA-126 antagomiR treatment of WT mice prior to induction of AMI. (E) TTC staining of the myocardium 24 h post-AMI in scramble and antagomiR treated mice (scramble n = 7 and antagomiR n = 5 per group). Significant DE genes in (A)–(C) were determined by adjusted P-values below the 5% FDR threshold. Error bars represent mean ± SD **P < 0.01.
Figure 5
Figure 5
Mouse sEND.1 ECs release more EVs after inflammatory stimulation. (A) Mouse sEND.1 ECs express more VCAM-1 following treatment with recombinant mouse TNF-α (10 ng/mL) (n = 9 per group); (B) release more EVs (n = 11 per group). (C) Size and concentration profile of sEND.1-derived EVs under basal conditions (n = 3) and after inflammatory stimulation with recombinant mouse TNF-α (n = 4). (D) TEM of sEND.1-derived EVs (scale bar 1000 nm) and (E) cryo-TEM sEND.1-derived EVs (scale bar 1000 nm). (F) Ponceau stain and western blot of sEND.1-derived EV from basal and after inflammatory stimulation with TNF-α for ALIX, TSG101, CD9, eNOS, VCAM-1, ATP5A, and Histone H3. sEND1 cell pellets, EV-depleted cell culture supernatants (EV-dep), and cell culture media that was not exposed to cells (control) were used as controls. EC-EV miRNA levels of (G) hsa-miRNA-126-3p and (H) hsa-miRNA-126-5p under basal conditions (n= 8) and after inflammatory stimulation with TNF-α (n = 7). An unpaired t-test was used in (A), (B), (C), (G), and (H) for statistical analysis. Error bars represent mean ± SD **P < 0.01, ***P < 0.001.
Figure 6
Figure 6
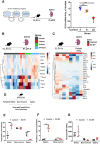
Mouse EC-EVs localize to the spleen in WT mice and influence gene and protein expression and mobilize splenic-neutrophils. (A) RT–qPCR detection of EC-EV labelled with miRNA-39-3p in the spleen of mice following intravenous injection of 1×10⁹ EVs by tail vein at: 2 (n = 4) and 6 h (n = 4) post-injection and control injections (n = 5); and 24 h (n = 6) post-injection and control injections (n = 5). Control represents a media only preparation with no EC-EVs. (B) Heat map showing gene expression in the spleen of mice following intravenous injection of 1×10⁹ EVs by tail vein at 2 (n = 4) and 6 h (n = 4) post-injection and control injections (n = 5); and 24 h (n = 6) post-injection and control injections (n = 5). Control represents a media only preparation with no EC-EVs. Data shown as ΔΔCt values normalized to row mean ΔΔCt value for each gene. (C) Heat map showing protein expression in the spleen of mice following intravenous injection of 1×10⁹ EVs by tail vein at 2 h (n = 4) post-injection. Control (n = 4) represents a media only preparation with no EC-EVs. Data shown are chemokine array dot blot density values normalized to mean row value for each protein. (D) Schematic of experiment. (E) Percentage of neutrophils as a proportion of the total leukocytes (live, CD45+, CD11b+, and Ly6G+) in peripheral blood, bone marrow, and spleen (n = 5 per group). (F) Splenic-neutrophil mobilization ratio (peripheral blood neutrophils/spleen neutrophils) shows net contributions of neutrophil reserves to mobilized peripheral blood neutrophils following intravenous injections of EC-EV (1×10⁹ EVs/mL) injections (n = 5 per group). (G) Mean fluorescent intensity of CD62L/L-selectin on neutrophils in peripheral blood, spleen, and bone marrow 2 h after (n = 5 per group) intravenous injections of EC-EV (1×10⁹ EVs/mL). A one-way ANOVA with post-hoc Bonferroni correction was used in (A), (B), and an unpaired t-test was used in (C). An unpaired t-test was used in (E)–(G). Error bars represent mean ± SD *P < 0.05, **P < 0.01, ***P < 0.001.
Figure 7
Figure 7
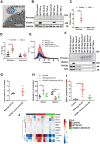
EV VCAM-1 is necessary for EC-EV splenic-neutrophil mobilization in mice. (A) TEM of a VCAM-1+ plasma EV bound to a magnetic bead of iron oxide conjugated with anti-human VCAM-1 antibodies, scale bar is 200 nm. (B/C) Western blot of sEND.1 WT and CRISPR-cas9 base-edited VCAM-1 KO cell pellets under basal conditions (WT n = 4 and VCAM-1 KO n = 4 per group) and after inflammatory stimulation with recombinant mouse tumour necrosis (TNF-α). (D) The number of mouse sEND.1 EC-EVs from WT and CRISPR-cas9 base-edited VCAM-1 KOs under basal conditions (WT n = 12 and VCAM-1 KO n = 11 per group) and after inflammatory stimulation with recombinant mouse TNF-α (n = 8 per group). (E) Size and concentration profile of mouse sEND.1 EC-EVs from WT and CRISPR/Cas9 base-edited VCAM-1 KOs under basal conditions (WT n = 12 and VCAM-1 KO n = 11 per group) and after inflammatory stimulation with recombinant mouse TNF-α (n = 8 per group). (F) Ponceau stain and western blot of WT and CRISPR-case9 base-edited VCAM-1 KO sEND.1-derived EVs from basal and after inflammatory stimulation with recombinant mouse TNF-α for TSG101, CD9, and VCAM-1. Inflammatory stimulated sEND1 cell pellets and EV-depleted cell culture supernatants were used as controls. (G) RT–qPCR detection of WT sEND.1 and CRISPR-cas9 base-edited VCAM-1 KOs EC-EV labelled with miRNA-39-3p in the spleen of mice following intravenous injection of 1×10⁹ EVs by tail vein at 2 h post-injection (n = 5 per group). (H/I) Percentage of neutrophils as a proportion of the total leukocytes (live, CD45+, CD11b+, and Ly6G+) in peripheral blood and spleen (control and VCAM-1 KO EC-EV n = 4 and WT EC-EV n = 5 per group). (I) Splenic-neutrophil mobilization ratio (peripheral blood neutrophils/spleen neutrophils) shows net contributions of splenic reserves to mobilized peripheral blood neutrophils following intravenous injections of WT or CRISPR-cas9 base-edited VCAM-1 KO EC-EVs 1×10⁹ EVs by tail vein at 2 h post-injection. Control represents a media only preparation with no EC-EVs (control and VCAM-1 KO EC-EV n = 3 and WT EC-EV n = 5 per group). (J) Heat map showing mRNA expression in the spleen of mice following intravenous injection of WT or CRISPR-cas9 base-edited VCAM-1 KO EC-EVs 1×10⁹ EVs by tail vein at 2 h post-injection. Control represents a media only preparation with no EC-EVs (n = 5 per group). Data shown as ΔΔCt values normalized to row mean ΔΔCt value for each gene. One-way (HJ) and two-way (BE) ANOVA with post-hoc Bonferroni correction was used for statistical analysis. An unpaired t-test was used in (F). Error bars represent mean ± SD *P < 0.05, **P < 0.01, ***P < 0.001, ****P < 0.0001.

Comment in

Similar articles

Cited by

References

    1. Schloss MJ, Horckmans M, Nitz K, Duchene J, Drechsler M, Bidzhekov K, Scheiermann C, Weber C, Soehnlein O, Steffens S.. The time-of-day of myocardial infarction onset affects healing through oscillations in cardiac neutrophil recruitment. EMBO Mol Med 2016;8:937–948. - PMC - PubMed
    1. Guo T-M, Cheng B, Ke L, Guan S-M, Qi B-L, Li W-Z, Yang B.. Prognostic value of neutrophil to lymphocyte ratio for in-hospital mortality in elderly patients with acute myocardial infarction. Curr Med Sci 2018;38:354–359. - PubMed
    1. Kong T, Kim TH, Park YS, Chung SP, Lee HS, Hong JH, Lee JW, You JS, Park I.. Usefulness of the delta neutrophil index to predict 30-day mortality in patients with ST segment elevation myocardial infarction. Sci Rep 2017;7:15718. - PMC - PubMed
    1. Sreejit G, Abdel-Latif A, Athmanathan B, Annabathula R, Dhyani A, Noothi SK, Quaife-Ryan GA, Al-Sharea A, Pernes G, Dragoljevic D, Lal H, Schroder K, Hanaoka BY, Raman C, Grant MB, Hudson JE, Smyth SS, Porrello ER, Murphy AJ, Nagareddy PR.. Neutrophil-derived S100A8/A9 amplify granulopoiesis after myocardial infarction. Circulation 2020;141:1080–1094. - PMC - PubMed
    1. Chia S, Nagurney JT, Brown DFM, Raffel OC, Bamberg F, Senatore F, Wackers FJT, Jang I-K.. Association of leukocyte and neutrophil counts with infarct size, left ventricular function and outcomes after percutaneous coronary intervention for ST-elevation myocardial infarction. Am J Cardiol 2009;103:333–337. - PubMed

Publication types

MeSH terms

Substances