

metaboprep: an R package for preanalysis data description and processing
- PMID: 35134881
- PMCID: PMC8963298
- DOI: 10.1093/bioinformatics/btac059
metaboprep: an R package for preanalysis data description and processing
Abstract
Motivation: Metabolomics is an increasingly common part of health research and there is need for preanalytical data processing. Researchers typically need to characterize the data and to exclude errors within the context of the intended analysis. Whilst some preprocessing steps are common, there is currently a lack of standardization and reporting transparency for these procedures.
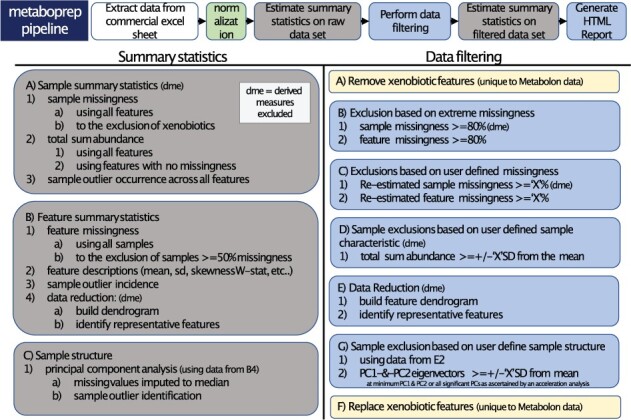
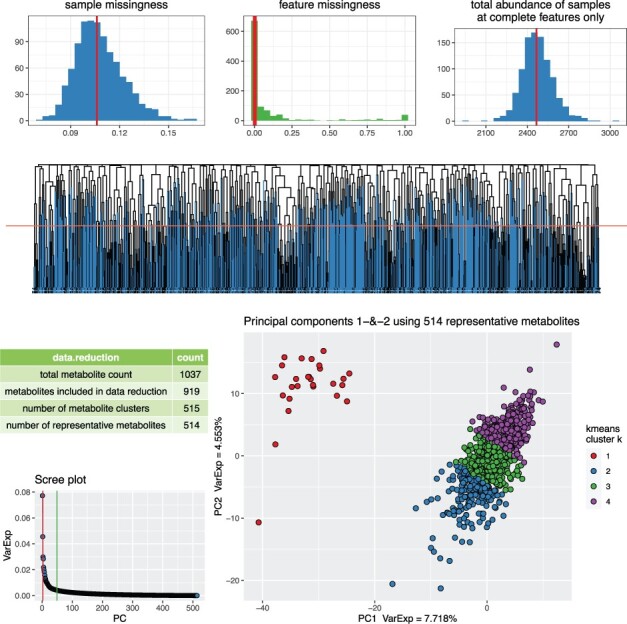
Results: Here, we introduce metaboprep, a standardized data processing workflow to extract and characterize high quality metabolomics datasets. The package extracts data from preformed worksheets, provides summary statistics and enables the user to select samples and metabolites for their analysis based on a set of quality metrics. A report summarizing quality metrics and the influence of available batch variables on the data are generated for the purpose of open disclosure. Where possible, we provide users flexibility in defining their own selection thresholds.
Availability and implementation: metaboprep is an open-source R package available at https://github.com/MRCIEU/metaboprep.
Supplementary information: Supplementary data are available at Bioinformatics online.
© The Author(s) 2022. Published by Oxford University Press.
Figures
References
-
- Ala-Korpela M. (2015) Serum nuclear magnetic resonance spectroscopy: one more step toward clinical utility. Clin. Chem., 61, 681–683. - PubMed
-
- Barnes S. (2020) Overview of experimental methods and study design in metabolomics, and statistical and pathway considerations. Methods Mol. Biol., 2104, 1–10. - PubMed
-
- Begou O. et al. (2018) Quality control and validation issues in LC-MS metabolomics. Methods Mol. Biol., 1738, 15–26. - PubMed
Publication types
MeSH terms
Grants and funding
- 669545/ERC_/European Research Council/International
- NF-0616-10102/DH_/Department of Health/United Kingdom
- MC_PC_21038/MRC_/Medical Research Council/United Kingdom
- MC_PC_15018/MRC_/Medical Research Council/United Kingdom
- WT 217065/Z/19/Z/WT_/Wellcome Trust/United Kingdom
- MC_UU_00011/6/MRC_/Medical Research Council/United Kingdom
- FS/17/60/33474/BHF_/British Heart Foundation/United Kingdom
- WT101597MA/WT_/Wellcome Trust/United Kingdom
- 202802/Z/16/Z/WT_/Wellcome Trust/United Kingdom
- CH/F/20/90003/BHF_/British Heart Foundation/United Kingdom
- AA/18/7/34219/BHF_/British Heart Foundation/United Kingdom
- MR/N024397/1/MRC_/Medical Research Council/United Kingdom
- CS/16/4/32482/BHF_/British Heart Foundation/United Kingdom
- 29019/CRUK_/Cancer Research UK/United Kingdom
- MC_UU_00011/1/MRC_/Medical Research Council/United Kingdom
- C18281/A29019/CRUK_/Cancer Research UK/United Kingdom
