

A chromosome-level genome assembly and annotation of the desert horned lizard, Phrynosoma platyrhinos, provides insight into chromosomal rearrangements among reptiles
- PMID: 35134927
- PMCID: PMC8848323
- DOI: 10.1093/gigascience/giab098
A chromosome-level genome assembly and annotation of the desert horned lizard, Phrynosoma platyrhinos, provides insight into chromosomal rearrangements among reptiles
Abstract
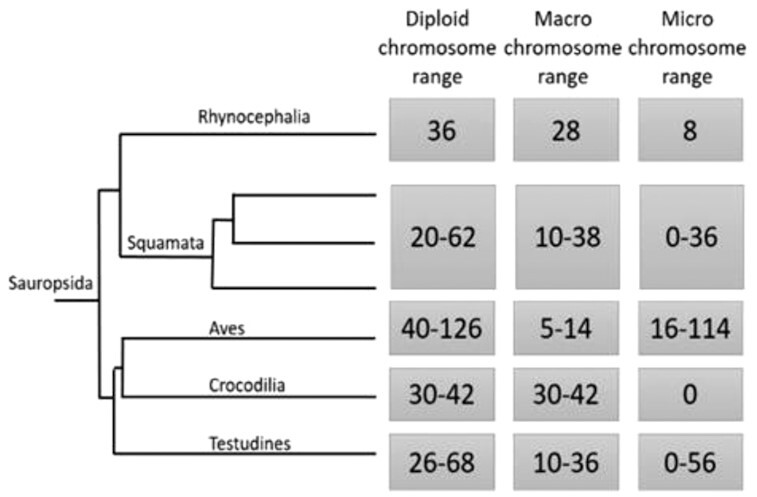
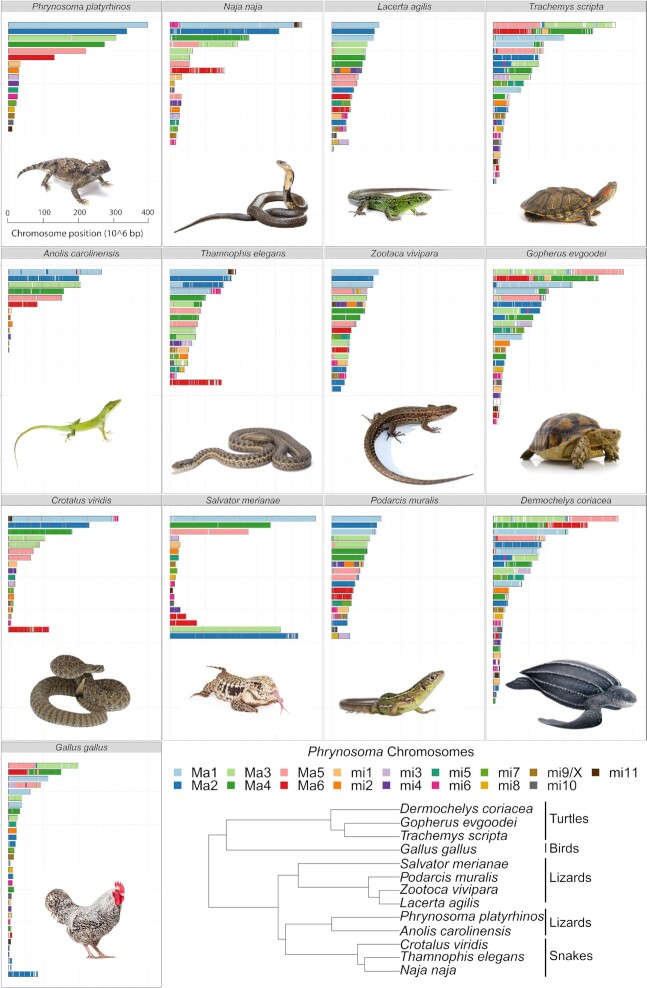
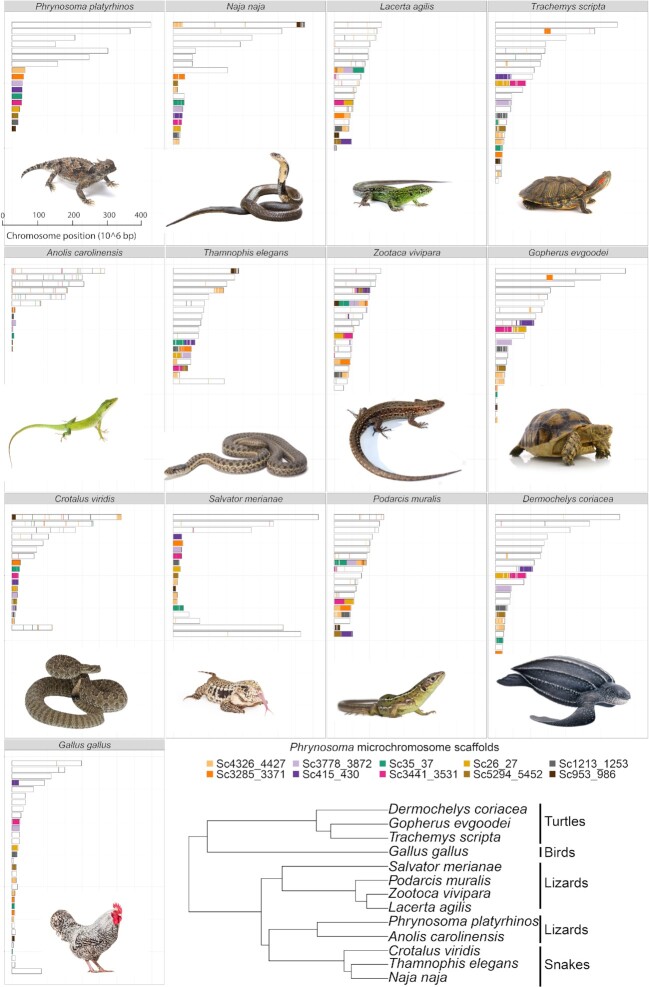
Background: The increasing number of chromosome-level genome assemblies has advanced our knowledge and understanding of macroevolutionary processes. Here, we introduce the genome of the desert horned lizard, Phrynosoma platyrhinos, an iguanid lizard occupying extreme desert conditions of the American southwest. We conduct analysis of the chromosomal structure and composition of this species and compare these features across genomes of 12 other reptiles (5 species of lizards, 3 snakes, 3 turtles, and 1 bird).
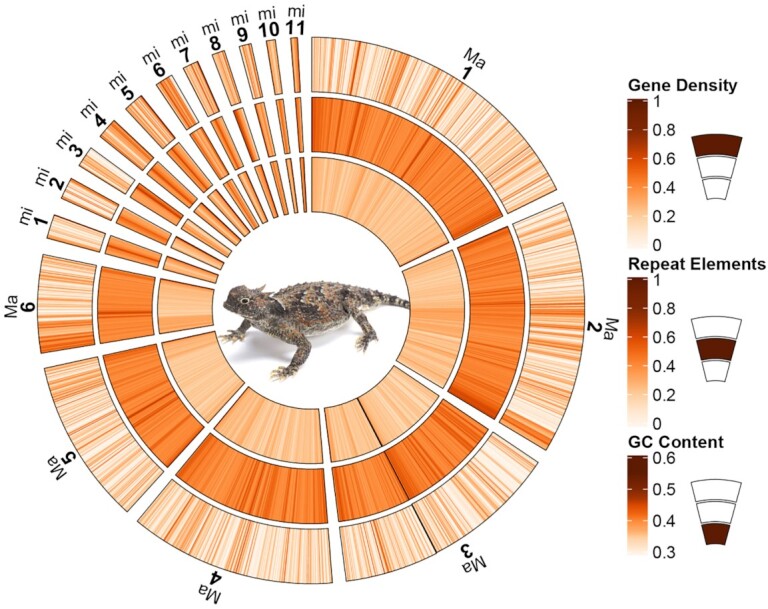
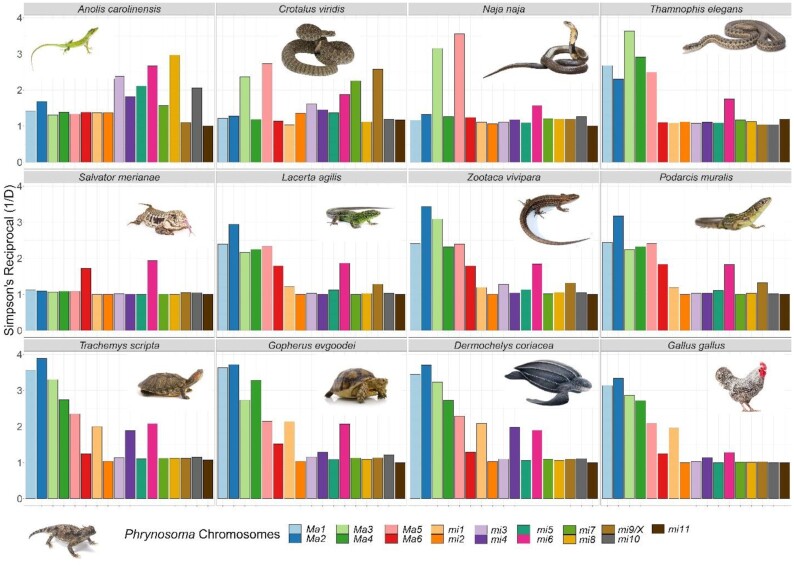
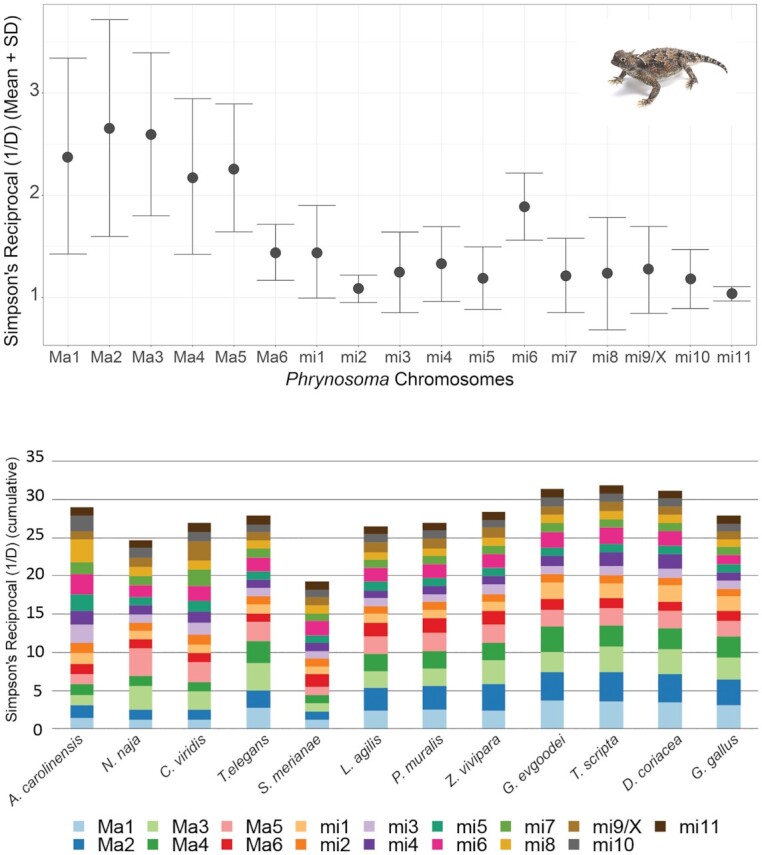
Findings: The desert horned lizard genome was sequenced using Illumina paired-end reads and assembled and scaffolded using Dovetail Genomics Hi-C and Chicago long-range contact data. The resulting genome assembly has a total length of 1,901.85 Mb, scaffold N50 length of 273.213 Mb, and includes 5,294 scaffolds. The chromosome-level assembly is composed of 6 macrochromosomes and 11 microchromosomes. A total of 20,764 genes were annotated in the assembly. GC content and gene density are higher for microchromosomes than macrochromosomes, while repeat element distributions show the opposite trend. Pathway analyses provide preliminary evidence that microchromosome and macrochromosome gene content are functionally distinct. Synteny analysis indicates that large microchromosome blocks are conserved among closely related species, whereas macrochromosomes show evidence of frequent fusion and fission events among reptiles, even between closely related species.
Conclusions: Our results demonstrate dynamic karyotypic evolution across Reptilia, with frequent inferred splits, fusions, and rearrangements that have resulted in shuffling of chromosomal blocks between macrochromosomes and microchromosomes. Our analyses also provide new evidence for distinct gene content and chromosomal structure between microchromosomes and macrochromosomes within reptiles.
Keywords: Reptilia; gene content; macrochromosome; microchromosome; synteny.
© The Author(s) 2022. Published by Oxford University Press GigaScience.
Conflict of interest statement
The authors declare that they have no competing interests.
Figures
Similar articles
-
Chromosome-Level Genome Assembly of the Blacktail Brush Lizard, Urosaurus nigricaudus, Reveals Dosage Compensation in an Endemic Lizard.Genome Biol Evol. 2023 Dec 1;15(12):evad210. doi: 10.1093/gbe/evad210. Genome Biol Evol. 2023. PMID: 38056449 Free PMC article.
-
Anchoring genome sequence to chromosomes of the central bearded dragon (Pogona vitticeps) enables reconstruction of ancestral squamate macrochromosomes and identifies sequence content of the Z chromosome.BMC Genomics. 2016 Jun 10;17:447. doi: 10.1186/s12864-016-2774-3. BMC Genomics. 2016. PMID: 27286959 Free PMC article.
-
Karyotype evolution in monitor lizards: cross-species chromosome mapping of cDNA reveals highly conserved synteny and gene order in the Toxicofera clade.Chromosome Res. 2013 Dec;21(8):805-19. doi: 10.1007/s10577-013-9398-0. Epub 2013 Dec 17. Chromosome Res. 2013. PMID: 24343421
-
A lizard is never late: Squamate genomics as a recent catalyst for understanding sex chromosome and microchromosome evolution.J Hered. 2023 Aug 23;114(5):445-458. doi: 10.1093/jhered/esad023. J Hered. 2023. PMID: 37018459 Free PMC article.
-
Understanding the Evolution of Reptile Chromosomes through Applications of Combined Cytogenetics and Genomics Approaches.Cytogenet Genome Res. 2019;157(1-2):7-20. doi: 10.1159/000495974. Epub 2019 Jan 16. Cytogenet Genome Res. 2019. PMID: 30645998 Review.
Cited by
-
Rethinking asexuality: the enigmatic case of functional sexual genes in Lepraria (Stereocaulaceae).BMC Genomics. 2024 Oct 26;25(1):1003. doi: 10.1186/s12864-024-10898-8. BMC Genomics. 2024. PMID: 39455957 Free PMC article.
-
Chromosome-length genome assembly of Uta stansburiana and gene expression data reveal fast pace-of-life comes with environmental stability.bioRxiv [Preprint]. 2025 Jun 9:2025.05.28.656178. doi: 10.1101/2025.05.28.656178. bioRxiv. 2025. PMID: 40501859 Free PMC article. Preprint.
-
Chromosome-Level Genome Assembly of the Blacktail Brush Lizard, Urosaurus nigricaudus, Reveals Dosage Compensation in an Endemic Lizard.Genome Biol Evol. 2023 Dec 1;15(12):evad210. doi: 10.1093/gbe/evad210. Genome Biol Evol. 2023. PMID: 38056449 Free PMC article.
-
Chromosome-level genome assembly of Phrynocephalus forsythii using third-generation DNA sequencing and Hi-C analysis.DNA Res. 2023 Apr 1;30(2):dsad003. doi: 10.1093/dnares/dsad003. DNA Res. 2023. PMID: 36882113 Free PMC article.
-
Elasmobranch genome sequencing reveals evolutionary trends of vertebrate karyotype organization.Genome Res. 2023 Sep;33(9):1527-1540. doi: 10.1101/gr.276840.122. Epub 2023 Aug 17. Genome Res. 2023. PMID: 37591668 Free PMC article.
References
-
- Deakin JE, Ezaz T. Understanding the evolution of reptile chromosomes through applications of combined cytogenetics and genomics approaches. Cytogenet Genome Res. 2019;157(1-2):7–20. - PubMed
-
- Burt DW. Origin and evolution of avian microchromosomes. Cytogenet Genome Res. 2002;96(1-4):97–112. - PubMed
Publication types
MeSH terms
LinkOut - more resources
Full Text Sources
Miscellaneous
