. 2022 Feb 4:11:giab093.
doi: 10.1093/gigascience/giab093.

Interpretable network-guided epistasis detection

Affiliations

Interpretable network-guided epistasis detection

Diane Duroux et al. Gigascience. .

Abstract

Background: Detecting epistatic interactions at the gene level is essential to understanding the biological mechanisms of complex diseases. Unfortunately, genome-wide interaction association studies involve many statistical challenges that make such detection hard. We propose a multi-step protocol for epistasis detection along the edges of a gene-gene co-function network. Such an approach reduces the number of tests performed and provides interpretable interactions while keeping type I error controlled. Yet, mapping gene interactions into testable single-nucleotide polymorphism (SNP)-interaction hypotheses, as well as computing gene pair association scores from SNP pair ones, is not trivial.

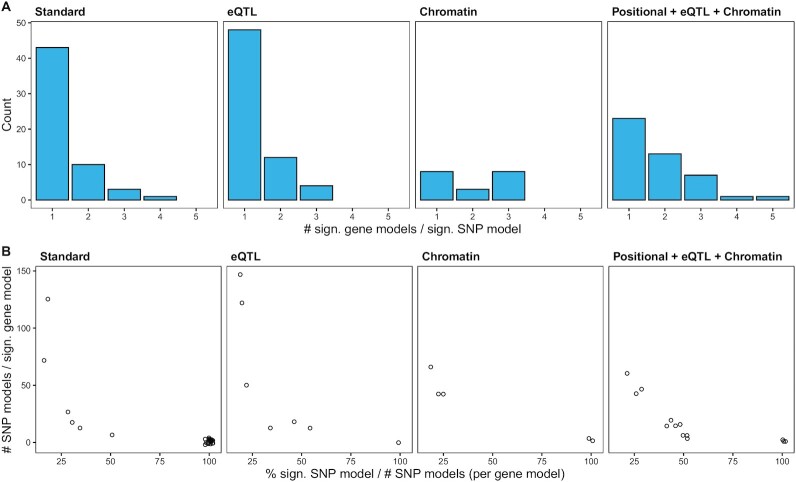
Results: Here we compare 3 SNP-gene mappings (positional overlap, expression quantitative trait loci, and proximity in 3D structure) and use the adaptive truncated product method to compute gene pair scores. This method is non-parametric, does not require a known null distribution, and is fast to compute. We apply multiple variants of this protocol to a genome-wide association study dataset on inflammatory bowel disease. Different configurations produced different results, highlighting that various mechanisms are implicated in inflammatory bowel disease, while at the same time, results overlapped with known disease characteristics. Importantly, the proposed pipeline also differs from a conventional approach where no network is used, showing the potential for additional discoveries when prior biological knowledge is incorporated into epistasis detection.

Keywords: biology-informed analysis; epistasis network; gene-gene interaction; inflammatory bowel disease; systems biology.


Conflict of interest statement

The authors declare that they have no competing interests.

Figures

Figure 1
Figure 1
: (A) Number of SNPs per gene for each of the 3 mappings described in section “From gene models to SNP models.” Each box shows the median number of SNPs mapped to the same gene (the bold line in the middle), with the second and the third quartiles below and above it, respectively; the whiskers represent the first and fourth quartiles; the outliers are indicated separately. (B) Ranking of genes with most SNPs mapped using any of the mappings, colored by mapping. Only genes with >100 SNPs mapped to it are displayed. (C–E) Comparison between the rank of each gene according to the number of SNPs mapped to it using each mapping.
Figure 2
Figure 2
: Epistasis networks built from derived significant gene models for the different analysis strategies. Genes associated with IBD in DisGeNET [23] are indicated in pink. An alternative layout of the networks is available in Supplementary Fig. S3.
Figure 3
Figure 3
: Relationship between the number of significant SNP models and the number of significant gene models. (A) Histogram of the number of significant gene models mapped to the same significant SNP model. (B) Relationship between the total number of SNP models mapped to the same significant gene model (y-axis), and the percentage of all the SNP models mapped to the same significant gene model that are significant themselves (x-axis). Because multiple points can stack, we introduced a little Gaussian noise on each of them to improve visualization.
Figure 4
Figure 4
: (A) Manhattan plot of the main effects, computed using logistic regression. In each subpanel, the SNPs selected via a significant SNP model, by each analysis, are indicated in black. For reference, the Bonferroni threshold of main effects significance is displayed with a red horizontal line. (B) Comparison between the P-values of the significant SNP-interactions, adjusted and unadjusted by main effects (x- and y-axis, respectively). P-values were not adjusted for multiple testing. To help interpretation, we added a y = x line. (C) Network containing all the SNP models significant in any of the analyses whose P-values after adjusting for PRS were lower than the original P-values. (D) Network containing all the gene models significant in any of the analyses that were mapped to 1 of the significant SNP models from panel C in its corresponding analysis. Genes associated with IBD in DisGeNET [23] are indicated in pink.
Figure 5
Figure 5
: Comparison of the proposed analysis with the relaxation of filters at different stages. (A) Effect of focusing on interactions mappable to Biofilter interactions. Proportion of the significant interactions that were detected using only the SNPs mappable to a Biofilter interaction, and using all of them. SNP interactions on top; gene interactions at the bottom. (B) Effect of focusing on 1 SNP-gene mapping at a time, or multiple mappings at once. Overlap between the significant interactions detected in the different analyses. SNP interactions on top; gene interactions at the bottom.
Figure 6
Figure 6
: Gene pairs produced within each mapping across 10 repetitions using 80% of the data, i.e., percentage of gene pairs detected with the entire dataset that are recovered in the 10 subsets with 80% of the individuals. Each box shows the median percentage of gene pairs (the bold line in the middle), with the second and the third quartiles below and above it, respectively; the whiskers represent the first and fourth quartiles; the outliers are indicated separately.
Figure 7
Figure 7
: (A) Overview of the investigated gene-gene interaction detection protocols, described in section “Gene interaction detection procedure.” (B) Summary of the procedure to obtain SNP and gene models using FUMA and Biofilter, described in section “Co-function gene and SNP networks.” (C) Permutation procedure to obtain the SNP model P-value threshold, described in section “SNP-level epistasis detection and multiple testing correction.” (D) Overview of the adaptive truncated product methodology, described in section “From SNP-level to gene-level epistasis.”

References

    1. Buniello A, MacArthur JA, Cerezo M, et al. The NHGRI-EBI GWAS Catalog of published genome-wide association studies, targeted arrays and summary statistics 2019. Nucleic Acids Res. 2019;47(D1):D1005–12. - PMC - PubMed
    1. Gordon H, Trier Moller F, Andersen V, et al. Heritability in inflammatory bowel disease: from the first twin study to genome-wide association studies. Inflamm Bowel Dis. 2015;21(6):1428–34. - PMC - PubMed
    1. Ellinghaus D, Jostins L, Spain SL, et al. Analysis of five chronic inflammatory diseases identifies 27 new associations and highlights disease-specific patterns at shared loci. Nat Genet. 2016;48(5):510. - PMC - PubMed
    1. Shaw KA, Cutler DJ, Okou D, et al. Genetic variants and pathways implicated in a pediatric inflammatory bowel disease cohort. Genes Immun. 2019;20(2):131–42. - PMC - PubMed
    1. Manolio TA, Collins FS, Cox NJ, et al. Finding the missing heritability of complex diseases. Nature. 2009;461(7265):747–53. - PMC - PubMed

Publication types

MeSH terms