. 2022 Feb 8;28(1):20.
doi: 10.1186/s10020-022-00443-2.

NK cell frequencies, function and correlates to vaccine outcome in BNT162b2 mRNA anti-SARS-CoV-2 vaccinated healthy and immunocompromised individuals

Affiliations

NK cell frequencies, function and correlates to vaccine outcome in BNT162b2 mRNA anti-SARS-CoV-2 vaccinated healthy and immunocompromised individuals

Angelica Cuapio et al. Mol Med. .

Abstract

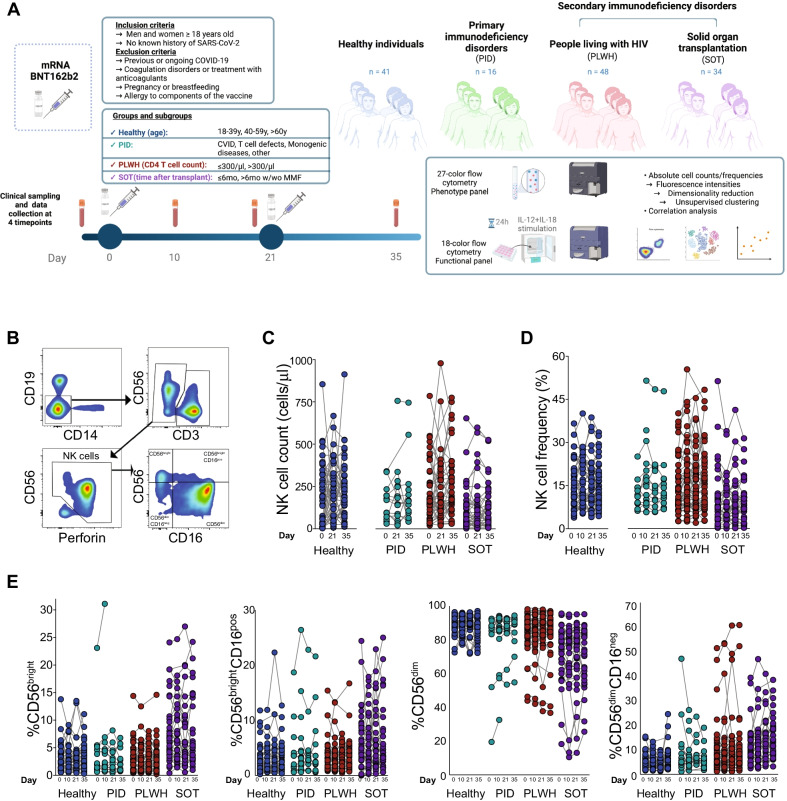
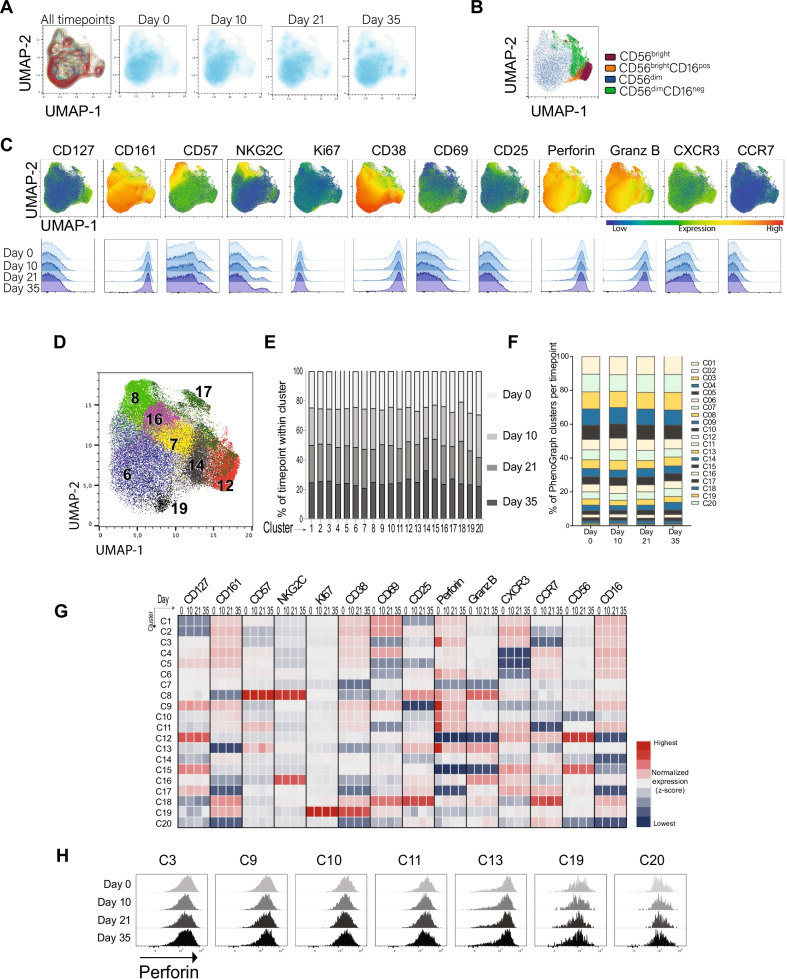
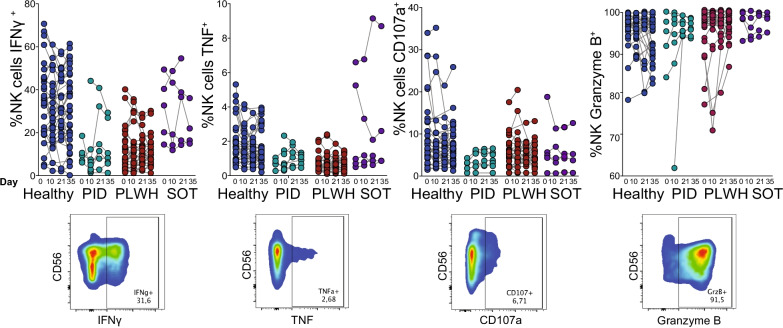
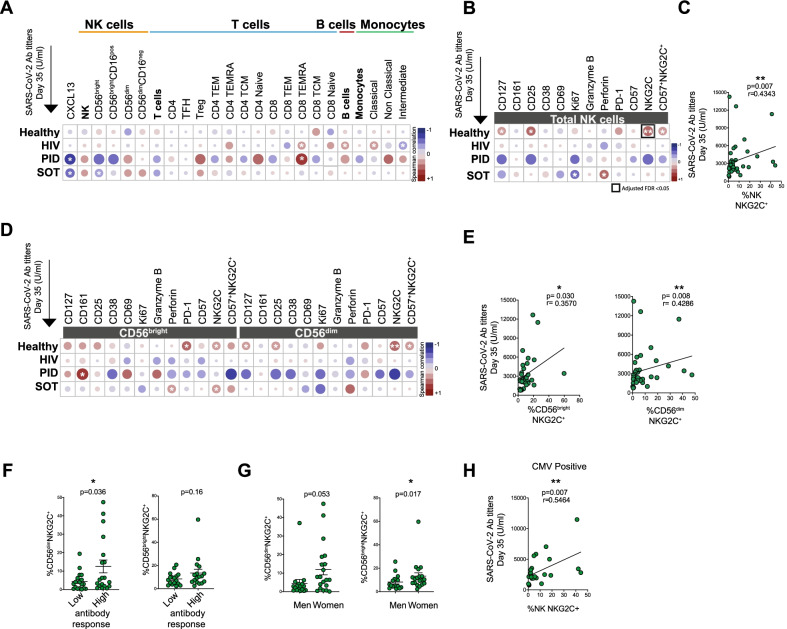
Adaptive immune responses have been studied extensively in the course of mRNA vaccination against COVID-19. Considerably fewer studies have assessed the effects on innate immune cells. Here, we characterized NK cells in healthy individuals and immunocompromised patients in the course of an anti-SARS-CoV-2 BNT162b2 mRNA prospective, open-label clinical vaccine trial. See trial registration description in notes. Results revealed preserved NK cell numbers, frequencies, subsets, phenotypes, and function as assessed through consecutive peripheral blood samplings at 0, 10, 21, and 35 days following vaccination. A positive correlation was observed between the frequency of NKG2C+ NK cells at baseline (Day 0) and anti-SARS-CoV-2 Ab titers following BNT162b2 mRNA vaccination at Day 35. The present results provide basic insights in regards to NK cells in the context of mRNA vaccination, and have relevance for future mRNA-based vaccinations against COVID-19, other viral infections, and cancer.Trial registration: The current study is based on clinical material from the COVAXID open-label, non-randomized prospective clinical trial registered at EudraCT and clinicaltrials.gov (no. 2021-000175-37). Description: https://clinicaltrials.gov/ct2/show/NCT04780659?term=2021-000175-37&draw=2&rank=1 .

Keywords: Anti-SARS-CoV-2 antibodies; BNT162b2 mRNA vaccine; COVID-19; Clinical trial; Innate immunity; NK cells; NKG2C; SARS-CoV-2; mRNA vaccine.


Conflict of interest statement

H.G.L. has served on the UK-CIC COVID-19 Oversight Committee, and leads the Karolinska Institutet COVID-19 vaccine group. H.G.L. is the Director of the NextGenNK Competence Center supported by Sweden’s Innovation Agency. Together with E.A., he is the founder and board member of XNK Therapeutics and Vycellix Inc. None of the other authors have declared any conflicts of interest in relation to the present study.

Figures

Fig. 1
Fig. 1
NK cell frequencies and immunophenotypes after BNT162b2 mRNA vaccine administration. A Study design, experimental and analytical workflow on PBMC samples from healthy individuals and select patient groups with immunodeficiency disorders receiving two doses of the BNT162b2 mRNA vaccine according to label. B Gating strategy to identify natural killer (NK) cells and their subsets by flow cytometry. C NK cell absolute numbers based on the basal absolute lymphocyte count at Days 0, 21 and 35 in healthy study subjects (left panel) and immunocompromised patients (right panels). D Frequency of total NK cells based on the lymphocyte gate obtained by flow cytometry analysis at Days 0, 10, 21 and 35 in the healthy study subjects (left panel) and immunocompromised patients (right panels). E Frequency of NK cell subsets in healthy study subjects and immunocompromised patients. Healthy individuals (Day 0 n = 37, Day 10 n = 38, Day 21 n = 36, Day 35 n = 37), PLWH (Day 0 n = 48, Day 10 n = 46, Day 21 n = 44, Day 35 n = 44), PID (Day 0 n = 12, Day 10 n = 16, Day 21 n = 14, Day 35 n = 12), SOT (Day 0 n = 34, Day 10 n = 33, Day 21 n = 33, Day 35 n = 30). Statistical analysis for C, D and E was performed using a Kruskal–Wallis test followed by a Dunn´s multiple comparisons test. No statistical significance difference was observed within each respective group (i.e., when comparing days 0, 10, 21 and 35)
Fig. 2
Fig. 2
Manual and automated analysis of NK cells in healthy study subjects. A UMAP plots from manual gating analysis on concatenated files of total NK cells in healthy study subjects grouped together and separated by Days 0, 10, 21 and 35. B UMAP of CD56bright, CD56brightCD16pos, CD56dim and CD56dimCD16neg within pooled NK cells from healthy controls at all timepoints. C Expression of the indicated functional and phenotypic markers on total NK cells in the healthy control group represented in UMAP plots (upper panel) and corresponding histograms at Days 0, 10, 21 and 35 (lower panel). D Automated analysis showing UMAP of total NK cells depicting selected PhenoGraph overlaid clusters. E Distribution of the different timepoints analyzed (Days 0, 10, 21 and 35) within each PhenoGraph cluster. F Percentage of 20 PhenoGraph clusters within total NK cells at Days 0, 10, 21 and 35. G Heatmap of the mean fluorescence intensity (MFI) of the phenotypic markers used to characterize NK cells across PhenoGraph clusters at Days 0, 10, 21 and 35 (quantification of median expression values as column-z score). H Flow cytometry histograms showing expression of Perforin within the selected clusters. Healthy individuals (Day 0 n = 37, Day 10 n = 38, Day 21 n = 36, Day 35 n = 37)
Fig. 3
Fig. 3
NK cell functional status at baseline and its correlation to anti-SARS-CoV-2 Ab titers. Functional characterization of total NK cells from healthy study subjects and select patient groups with immunodeficiency disorders receiving two doses of the BNT162b2 mRNA vaccine according to label. Samples at Days 0, 10, 21 and 35 show the frequencies of IFNγ-, TNF-, Granzyme B-, and CD107a-positive NK cells after 24 h of IL-12 (10 ng/ml) and IL-18 (100 ng/ml) stimulation (upper panel). Representative flow cytometry plots of functional markers expressed on NK cells (lower panel). Healthy controls (Day 0 n = 30, Day 10 n = 30, Day 21 n = 26, Day 35 n = 35), PLWH (Day 0 n = 25, Day 10 n = 24, Day 21 n = 24, Day 35 n = 23), PID (Day 0 n = 5, Day 10 n = 8, Day 21 n = 7, Day 35 n = 7), SOT (Day 0 n = 5, Day 10 n = 5, Day 21 n = 5, Day 35 n = 4). Statistical analysis was performed using a Kruskal–Wallis test followed by a Dunn’s multiple comparisons test. No statistical significance difference was observed within each respective group (i.e., when comparing days 0, 10, 21 and 35)
Fig. 4
Fig. 4
NK cell immune phenotypic characterization at baseline and its correlation to anti-SARS-CoV-2 Ab titers. A Heatmap displaying Spearman correlations between different lymphocytic (NK, T and B cells and their subsets), monocytic cell subsets, and markers expressed on total NK cells at baseline (Day 0) and anti-SARS-CoV-2 Ab titers at Day 35 in healthy study subjects and immunocompromised patients. Heatmaps depicting Spearman correlation between the expression of immune phenotypical markers at Day 0 on total NK cells (B), CD56bright and CD56dim cells D in healthy study subjects and immunocompromised patients, and the anti-SARS-CoV-2 Ab levels at Day 35. Spearman correlation between the NKG2C expression at Day 0 on total NK cells (C), CD56bright and CD56dim cells E in healthy study subjects and anti-SARS-CoV-2 Ab titers at Day 35 (n = 37). For the heatmaps diplaying Spearman correlation, false discovery rate (FDR) corrections were performed using the Benjamini–Hochberg test at an FDR < 0.05 significance threshold. Frequencies of NKG2C positive cells among CD56dim and CD56bright NK cells in healthy study subjects stratified into individuals with lower (50%) or higher (50%) anti-SARS-Cov-2 Ab titers F and in men and women G (n = 37). H Spearman correlation between the NKG2C expression at Day 0 on total NK cells and anti-SARS-CoV-2 Ab titers at Day 35 (n = 26) in healthy study subjects with a positive CMV serostatus. For Figs. 4A, B, D: Healthy individuals (n = 39), PLWH (n = 48), PID (n = 12), SOT (n = 34). For C and E Healthy individuals (n = 39). Mann–Whitney U test used to evaluate differences between two groups. Color in heatmaps indicates the r value, i.e. the strength of the correlation from the Spearman test, and asterisks show the statistical p value followed by FDR correction (highlighted in a black square if < 0.05). Significance level: *p < 0.05, **p < 0.01, ***p < 0.001

References

    1. Arunachalam PS, Scott MKD, Hagan T, Li C, Feng Y, Wimmers F, et al. Systems vaccinology of the BNT162b2 mRNA vaccine in humans. Nature. 2021;596(7872):410–416. doi: 10.1038/s41586-021-03791-x. - DOI - PMC - PubMed
    1. Baden LR, El Sahly HM, Essink B, Kotloff K, Frey S, Novak R, et al. Efficacy and Safety of the mRNA-1273 SARS-CoV-2 Vaccine. N Engl J Med. 2021;384(5):403–416. doi: 10.1056/NEJMoa2035389. - DOI - PMC - PubMed
    1. Bergman P, Blennow O, Hansson L, Mielke S, Nowak P, Chen P, et al. Safety and efficacy of the mRNA BNT162b2 vaccine against SARS-CoV-2 in five groups of immunocompromised patients and healthy controls in a prospective open-label clinical trial. EBioMedicine. 2021;74:103705. - PMC - PubMed
    1. Bjorkstrom NK, Lindgren T, Stoltz M, Fauriat C, Braun M, Evander M, et al. Rapid expansion and long-term persistence of elevated NK cell numbers in humans infected with hantavirus. J Exp Med. 2011;208(1):13–21. doi: 10.1084/jem.20100762. - DOI - PMC - PubMed
    1. Bjorkstrom NK, Strunz B, Ljunggren HG. Natural killer cells in antiviral immunity. Nat Rev Immunol. 2021;22:112–123. 10.1038/s41577-021-00558-3. - PMC - PubMed

Publication types

MeSH terms

Associated data