. 2022 Feb 8;54(1):11.
doi: 10.1186/s12711-022-00702-0.

Genetic analysis of disease resilience of wean-to-finish pigs under a natural disease challenge model using reaction norms

Affiliations

Genetic analysis of disease resilience of wean-to-finish pigs under a natural disease challenge model using reaction norms

Jian Cheng et al. Genet Sel Evol. .

Abstract

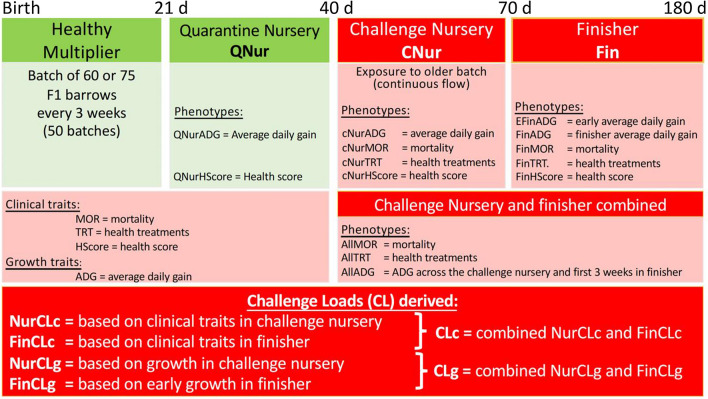
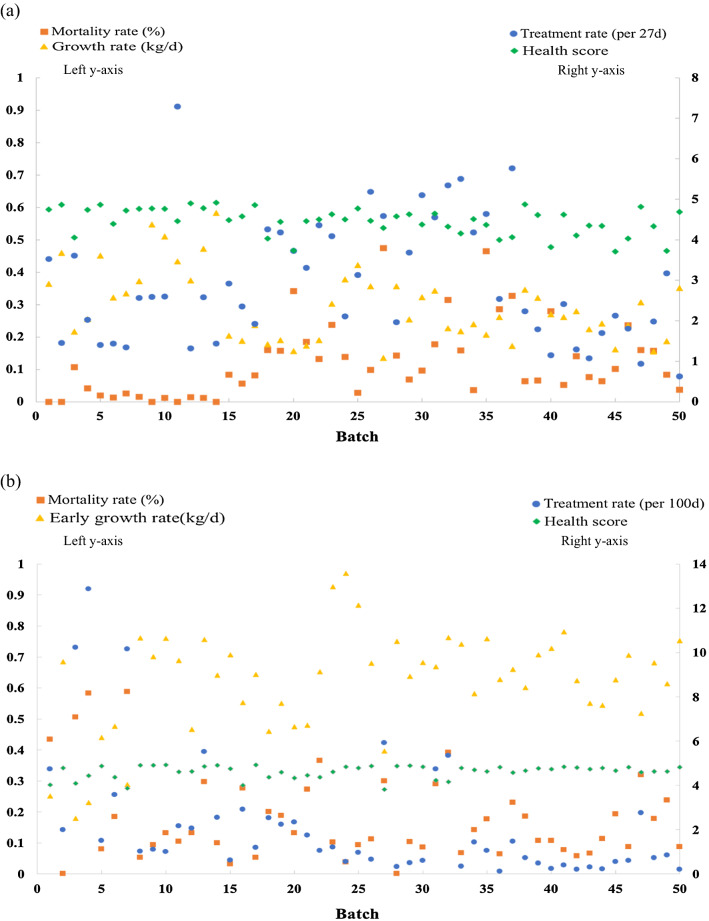
Background: Disease resilience is the ability to maintain performance across environments with different disease challenge loads (CL). A reaction norm describes the phenotypes that a genotype can produce across a range of environments and can be implemented using random regression models. The objectives of this study were to: (1) develop measures of CL using growth rate and clinical disease data recorded under a natural polymicrobial disease challenge model; and (2) quantify genetic variation in disease resilience using reaction norm models.

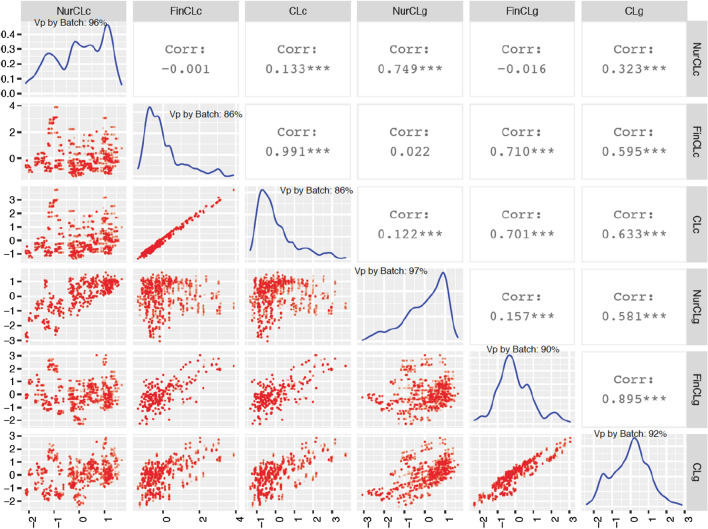
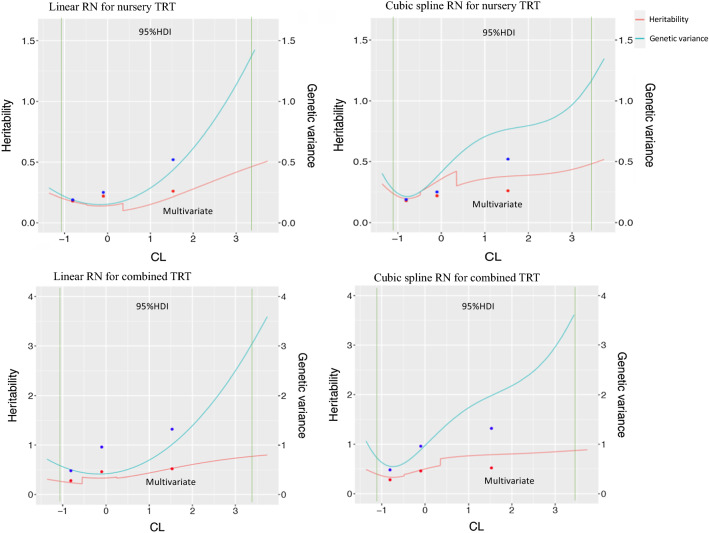
Methods: Different CL were derived from contemporary group effect estimates for average daily gain (ADG) and clinical disease phenotypes, including medical treatment rate (TRT), mortality rate, and subjective health scores. Resulting CL were then used as environmental covariates in reaction norm analyses of ADG and TRT in the challenge nursery and finisher, and compared using model loglikelihoods and estimates of genetic variance associated with CL. Linear and cubic spline reaction norm models were compared based on goodness-of-fit and with multi-variate analyses, for which phenotypes were separated into three traits based on low, medium, or high CL.

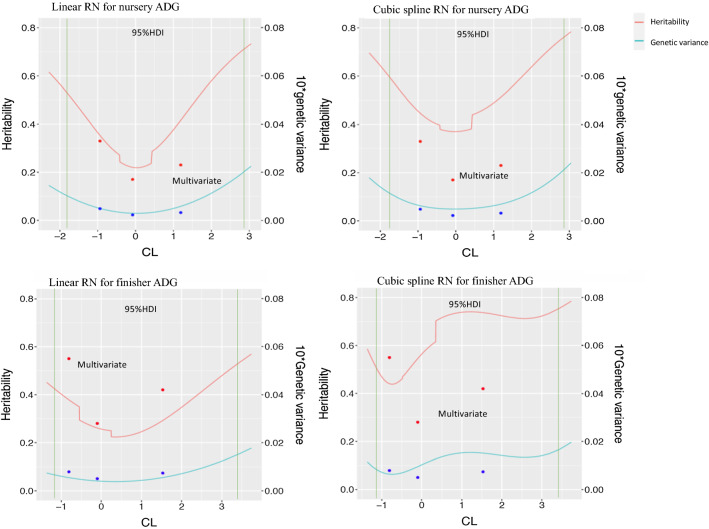
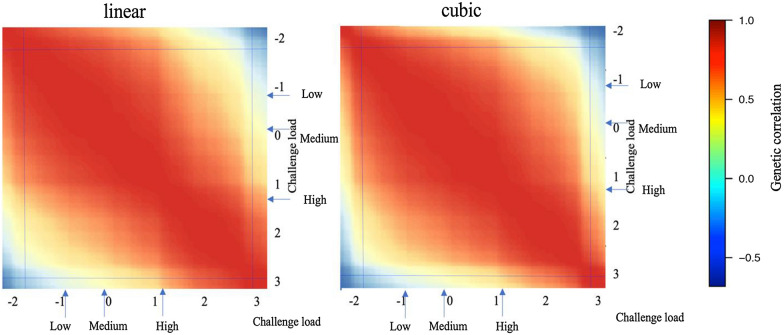
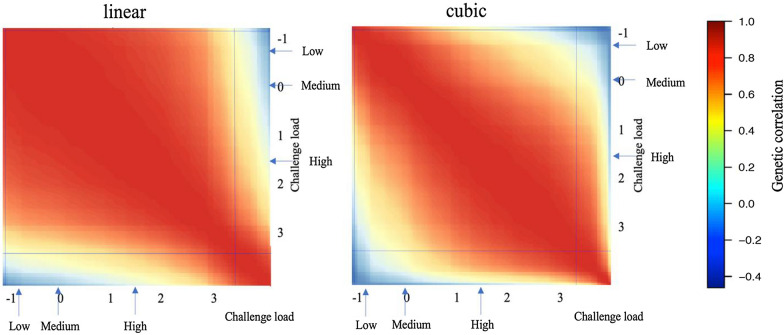
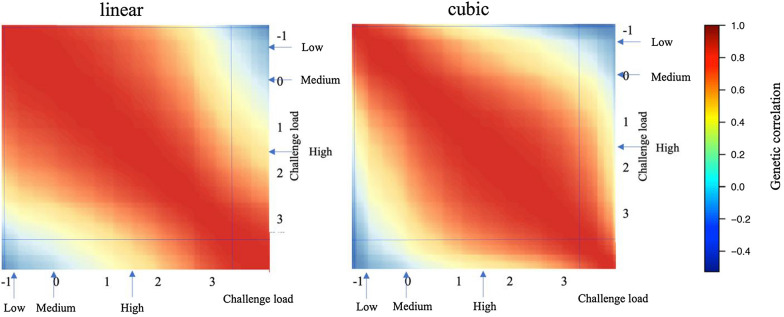
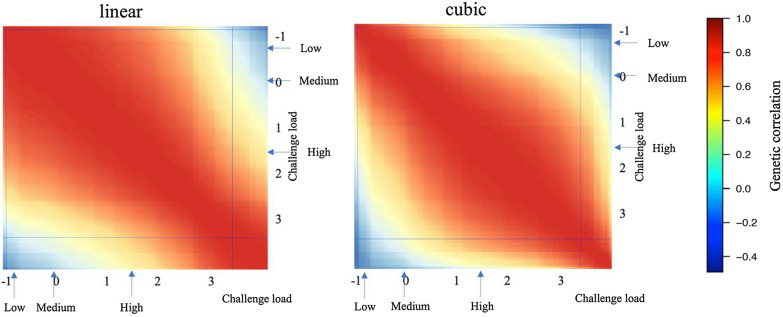
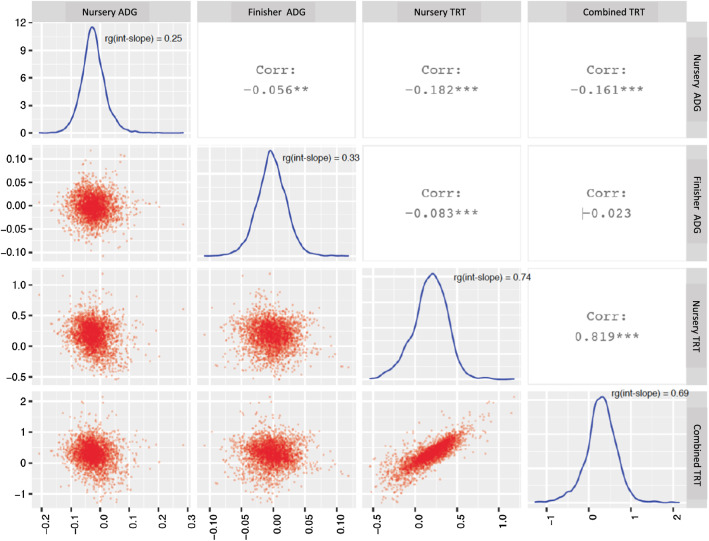
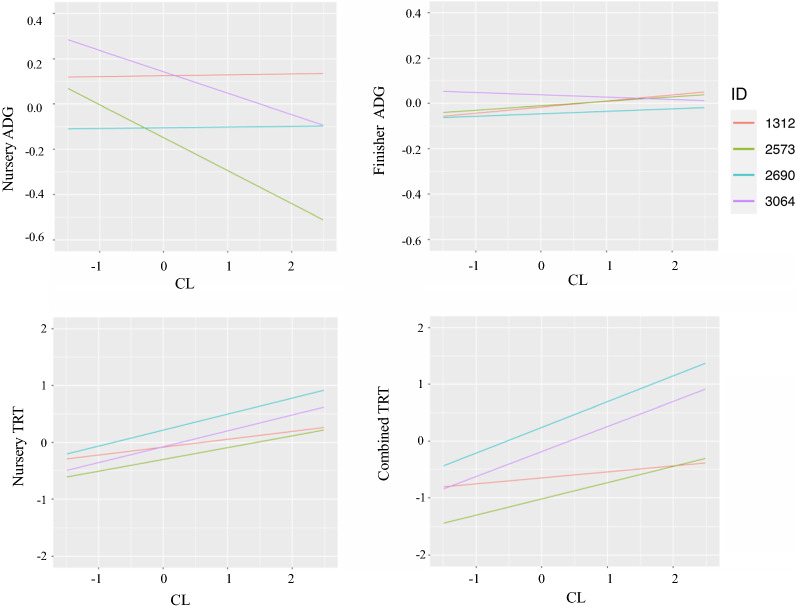
Results: Based on model likelihoods and estimates of genetic variance explained by the reaction norm, the best CL for ADG in the nursery was based on early ADG in the finisher, while the CL derived from clinical disease traits across the nursery and finisher was best for ADG in the finisher and for TRT in the nursery and across the nursery and finisher. With increasing CL, estimates of heritability for nursery and finisher ADG initially decreased, then increased, while estimates for TRT generally increased with CL. Genetic correlations for ADG and TRT were low between high versus low CL, but high for close CL. Linear reaction norm models fitted the data significantly better than the standard genetic model without genetic slopes, while the cubic spline model fitted the data significantly better than the linear reaction norm model for most traits. Reaction norm models also fitted the data better than multi-variate models.

Conclusions: Reaction norm models identified genotype-by-environment interactions related to disease CL. Results can be used to select more resilient animals across different levels of CL, high-performance animals at a given CL, or a combination of these.


Conflict of interest statement

The authors declare that they have no competing interests.

Figures

Fig. 1
Fig. 1
Natural disease challenge protocol, phenotypes, and challenge loads. Green = healthy. Red = challenged
Fig. 2
Fig. 2
Treatment and mortality rates and average health scores and growth rates by batch in the challenge nursery (a) and in the finisher (b)
Fig. 3
Fig. 3
Distributions and relationships of challenge loads by pen within batch derived from the growth and clinical disease phenotypes. Vp by Batch: proportion of phenotypic variance explained by Batch for each CL; NurCLc = challenge load derived from the clinical disease traits in the challenge nursery; FinCLc = challenge load derived from the clinical disease traits in early finisher; CLc = weighted challenge load of NurCLc and FinCLc; NurCLg = challenge load derived from the growth rate in the challenge nursery; FinCLg = challenge load derived from the growth rate in early finisher; CLg = weighted challenge load of NurCLg and FinCLg
Fig. 4
Fig. 4
Estimates of heritability and genetic variance as a function of challenge load (CL) based on the linear and cubic spline reaction norm (RN) models for average daily gain (ADG, kg/day) in the challenge nursery and finisher. Dots indicate estimates from multi-variate analyses with phenotypes under low, intermediate, and high CL treated as different traits. Green vertical lines indicate the 95% highest density interval for the challenge load. Nursery ADG was analyzed based on CL derived from early finisher growth rate, while finisher ADG was based on CL derived from the clinical disease traits across the challenge nursery and finisher
Fig. 5
Fig. 5
Estimates of heritability and genetic variance as a function of challenge load (CL) based on the linear and cubic spline reaction norm (RN) models for treatment rate in the challenge nursery and across challenge nursery and finisher. Dots indicate estimates from multi-variate analysis with phenotypes under low, intermediate, and high CL treated as different traits. Green vertical lines indicate the 95% highest density interval for the CL. TRT: medical treatment rate; combined TRT: medical treatment rate across the challenge nursery and finisher; both nursery and combined TRT were analyzed based on CL derived from the clinical disease traits across the challenge nursery and finisher
Fig. 6
Fig. 6
Estimates of genetic correlations from the linear and the cubic spline reaction norm model for average daily gain (ADG, kg/day) in the challenge nursery using challenge load derived from early finisher growth rate. Horizontal and vertical lines on the heatmaps indicate 95% highest density interval for the challenge load; Arrows on the heatmap scales indicate the mean challenge load for the low, medium, and high categories used for the multi-trait analyses
Fig. 7
Fig. 7
Estimates of genetic correlations from the linear and the cubic spline reaction norm model for average daily gain (ADG, kg/day) in the finisher using challenge load derived from the clinical disease traits across the challenge nursery and finisher. Horizontal and vertical lines on the heatmaps indicate 95% highest density interval for the challenge load; Arrows on the heatmap scales indicate the mean challenge load for the low, medium, and high categories used for the multi-trait analyses
Fig. 8
Fig. 8
Estimates of genetic correlations from the linear and the cubic spline reaction norm model for treatment rate in the challenge nursery using challenge load derived from the clinical disease traits across the challenge nursery and finisher. Horizontal and vertical lines on the heatmaps indicate 95% highest density interval for the challenge load; Arrows on the heatmap scales indicate the mean challenge load for the low, medium, and high categories used for the multi-trait analyses
Fig. 9
Fig. 9
Estimates of genetic correlations from the linear and the cubic spline reaction norm model for treatment rate across the challenge nursery and finisher using challenge load derived from the clinical disease traits across the challenge nursery and finisher. Horizontal and vertical lines on the heatmaps indicate 95% highest density interval for the challenge load; Arrows on the heatmap scales indicate the mean challenge load for the low, medium, and high categories used for the multi-trait analyses
Fig. 10
Fig. 10
Distribution and relationships of estimated breeding values for slope from the linear reaction norm model for average daily gain (ADG, kg/day) and treatment rate (TRT) in or across (combined) the challenge nursery and finisher. rg(int-slope) on the diagonal refers to the estimate of the genetic correlation between the intercept and slope for that trait
Fig. 11
Fig. 11
Estimates of breeding values for four animals as a function of challenge load from the linear reaction norm model for average daily gain (ADG, kg/day) and treatment rate (TRT) in or across (combined) the challenge nursery and finisher. Challenge load was derived using clinical disease traits across the challenge nursery and finisher

References

    1. Wientjes YCJ, Calus MPL. Board Invited Review: the purebred-crossbred correlation in pigs: a review of theory, estimates, and implications. J Anim Sci. 2017;95:3467–3478. - PubMed
    1. Albers GAA, Gray GD, Piper LR, Barker JSF, Le Jambre LF, Barger IA. The genetics of resistance and resilience to Haemonchus contortus infection in young merino sheep. Int J Parasitol. 1987;17:1355–1363. doi: 10.1016/0020-7519(87)90103-2. - DOI - PubMed
    1. Bisset SA, Morris CA. Feasibility and implications of breeding sheep for resilience to nematode challenge. Int J Parasitol. 1996;26:857–868. doi: 10.1016/S0020-7519(96)80056-7. - DOI - PubMed
    1. Bishop SC, Stear MJ. Modeling of host genetics and resistance to infectious diseases: understanding and controlling nematode infections. Vet Parasitol. 2003;115:147–166. doi: 10.1016/S0304-4017(03)00204-8. - DOI - PubMed
    1. Bishop SC. A consideration of resistance and tolerance for ruminant nematode infections. Front Genet. 2012;3:168. - PMC - PubMed