. 2022 Feb 8;21(1):41.
doi: 10.1186/s12943-022-01495-y.

circPTEN1, a circular RNA generated from PTEN, suppresses cancer progression through inhibition of TGF-β/Smad signaling

Affiliations

circPTEN1, a circular RNA generated from PTEN, suppresses cancer progression through inhibition of TGF-β/Smad signaling

Lin Zheng et al. Mol Cancer. .

Abstract

Background: PTEN is one of the most frequently mutated genes in human cancer. Although the roles of canonical PTEN protein and PTEN isoforms have been extensively explored, the current understanding of PTEN family members cannot fully illustrate the diversity of their roles in biological processes and tumor development. Notably, the function of noncoding RNAs arising from PTEN has been less elucidated.

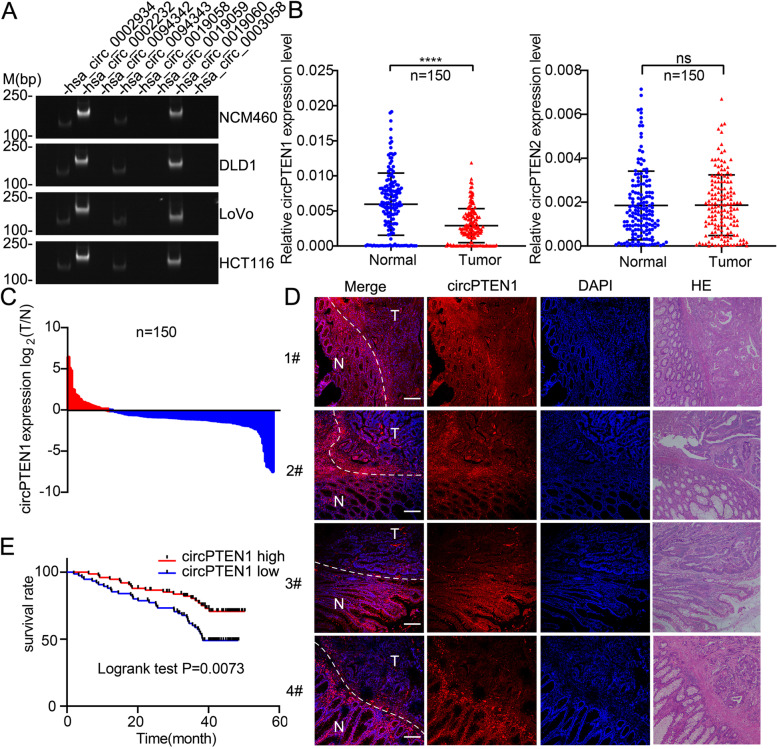
Methods: We searched circBase and circInteractome to analyze the potential of PTEN for generating circRNAs. Then, Sanger sequencing, RNase R and Actinomycin D assays were used to verify the ring structure of circPTEN1. In situ hybridization and qRT-PCR were used to determine the level of circPTEN1 in peritumor and tumor tissues of colorectal cancer (CRC). Furthermore, functional experiments, including Transwell assay, 3D multicellular tumor spheroid invasion assay and metastasis models, were performed using circPTEN1 knockdown and overexpression cell lines in vitro and in vivo to investigate the effects of circPTEN1 on tumor metastasis in CRC. Mechanistically, luciferase reporter assay, fluorescence in situ hybridization, electrophoretic mobility shift assay, RNA immunoprecipitation, RNA pull-down and mass spectrometry were executed.

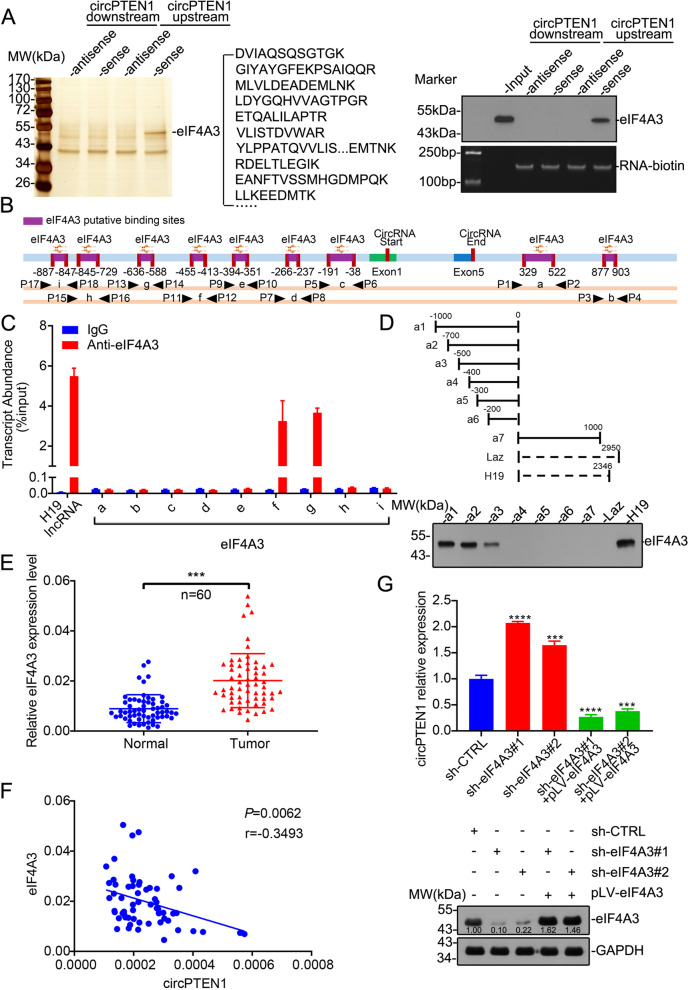
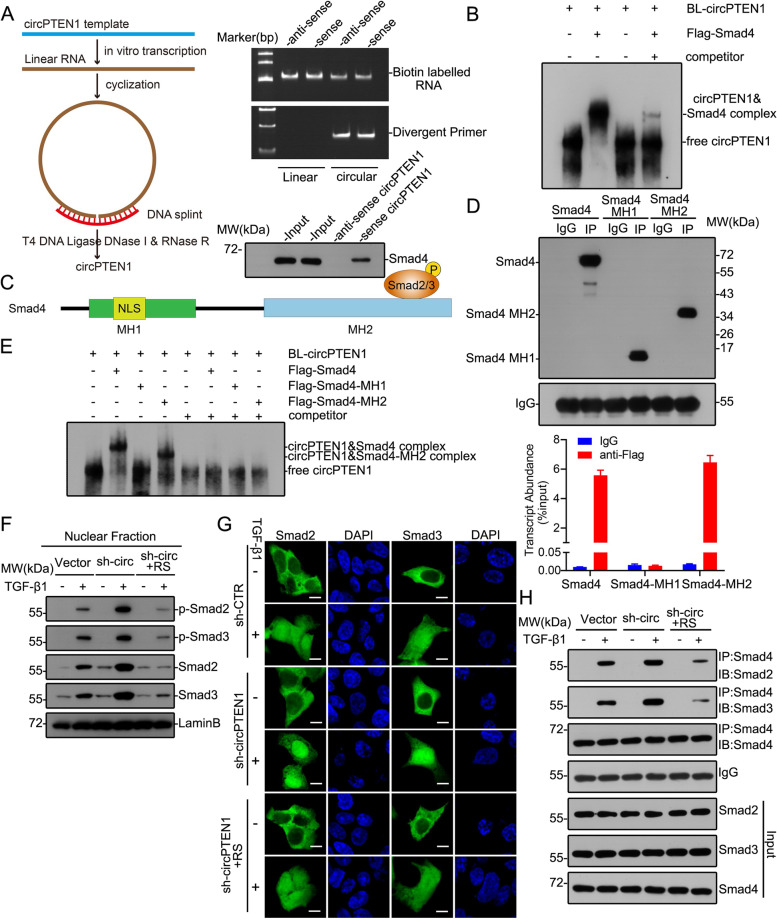
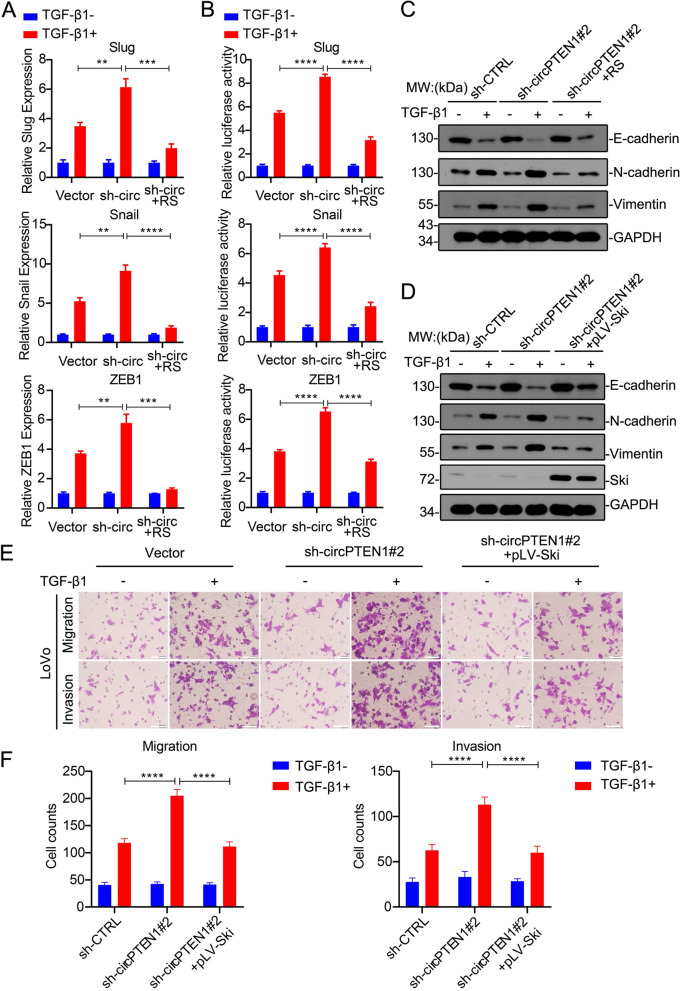
Results: We identified a circular RNA generated from the PTEN gene, designated circPTEN1, that is frequently downregulated in colorectal cancer, and decreased expression of circPTEN1 predicts poor survival. Low expression of circPTEN1 promotes metastasis in PDX models in vivo and accelerates cancer cell invasion in vitro, whereas overexpression of circPTEN1 reveals opposite roles. Mechanically, we found that circPTEN1 is capable of binding the MH2 domain of Smad4 to disrupt its physical interaction with Smad2/3, which reduces the formation and subsequent nucleus translocation of Smad complexes and consequently suppresses the expression of its downstream genes associated with epithelial-mesenchymal transition upon TGF-β stimulation. Furthermore, we found that eIF4A3 suppresses the cyclization of circPTEN1 by directly binding to the circPTEN1 flanking region.

Conclusions: Our study uncovered a novel PTEN gene-generated circRNA with a tumor suppression function, and further revealed the mechanism of circPTEN1 in CRC metastasis mediated by TGF-β. The identification of circPTEN1 provides a new direction for PTEN investigation, and elucidation of circPTEN1/TGF-β/Smad signaling may pave the way for the development of a potential therapeutic strategy for the suppression of cancer progression.

Keywords: Colorectal cancer; PTEN; TGF-β/Smad signaling; Tumor metastasis; circRNA.


Conflict of interest statement

The authors declare no competing financial interests.

Figures

Fig. 1
Fig. 1
Identification analysis of a novel circular RNA generated from the PTEN gene. A. The expression profiles of circRNAs derived from the PTEN gene in the normal human colonic epithelial cell line NCM460 and colon cancer cell lines. B. qRT-PCR assay showing the relative levels of circPTEN1 and circPTEN2 (normalized to β-actin) in the peritumor and tumor tissues of colon cancer (n = 150). ****, P < 0.0001. ns: no statistically significance. C. circPTEN1 expression was significantly lower in tumor tissues than in peritumor tissues in 80% of colon cancer patients. D. Fluorescence in situ hybridization assay was conducted to determine the expression of circPTEN1 in the peritumor and tumor tissues of colon cancer. N: peritumor tissue, T: tumor tissue. The scale bars represent 200 μm. E. Kaplan-Meier analysis of correlations between circPTEN1 expression levels and OS (overall survival) of 150 colon cancer patients
Fig. 2
Fig. 2
The identification and characteristics of circPTEN1 in colon cancer. A. Schematic illustration showing the PTEN exon 1 (partial)-exon 5 circularization forming circPTEN1. The presence of circPTEN1 was validated by RT-PCR, followed by Sanger sequencing. Black arrow represents “head-to-tail” circPTEN1 splicing sites. B. The presence of circPTEN1 was validated in DLD1 and LoVo cell lines by RT-PCR. Divergent primers amplified circPTEN1 in cDNA but not in genomic DNA. β-actin was used as a negative control. C. Northern blotting analysis of circPTEN1 and PTEN mRNA levels in LoVo cells by hybridization with exon 5 (top, left) and exon 5-exon 1 junction (top, right) probes with and without RNase R treatment. GAPDH mRNA with or without RNase R treatment was detected as a control. D. qRT-PCR analysis of the expression of circPTEN1 and PTEN mRNA after treatment with RNase R in DLD1 and LoVo cells. ****, P < 0.0001. E. qRT-PCR for the abundance of circPTEN1, PTEN mRNA and GAPDH mRNA in DLD1 and LoVo cells treated with Actinomycin D at the indicated time points. F. The levels of circPTEN1 in the nuclear and cytoplasmic fractions of DLD1 and LoVo cells. G. FISH detection of circPTEN1 in colon cancer cells. Nuclei were stained with DAPI. Scale bar, 10 μm
Fig. 3
Fig. 3
EIF4A3 suppresses circPTEN1 expression. A. Left, identification of proteins pulled down by circPTEN1 upstream or downstream sequences with protein extracts from LoVo cells. The arrow indicates the additional band containing eIF4A3. Right, immunoblot analysis of eIF4A3 after pull-down assay showing its specific association with circPTEN1 upstream flanking sequence (upper panel); the enriched RNA labeled with biotin was evaluated by RT-PCR (lower panel). B. The binding sites of eIF4A3 were predicted in the flanking region of circPTEN1 using CircInteractome. C. The RIP assay was performed to verify the binding sites of eIF4A3 on circPTEN1 upstream sequences. H19 lncRNA was used as the positive control. D. The RNA pull-down assay was performed to analyze the interaction between eIF4A3 and several circPTEN1 upstream truncations (a1-a6). Laz was a nonsense sequence used as the negative control, and H19 was used as the positive control. E. qRT-PCR assay showing the relative levels of eIF4A3 (normalized to β-actin) in the peritumor and tumor tissues of colon cancer (n = 60). ***, P < 0.001. F. The correlation between eIF4A3 and circPTEN1 (n = 60). G. LoVo cells were infected with lentivirus expressing eIF4A3 shRNA, or scramble shRNA. A rescue experiment was conducted by infecting eIF4A3-knockdown cells with pLV-eIF4A3. The expression of eIF4A3 was validated by western blot, and the ratio of the grayscale value of the eIF4A3 band to the grayscale value of the corresponding GAPDH band was labeled (lower panel). The circPTEN1 level was evaluated by qRT-PCR (upper panel)
Fig. 4
Fig. 4
CircPTEN1 suppresses TGF-β-mediated CRC metastasis. A. Identification of the circPTEN1-protein complex pulled down by the circPTEN1 junction probe with protein extracts from LoVo cells. The arrow indicates the band containing Smad4. B. RIP assays showing the association of Smad4 with circPTEN1. Left, IP efficiency of Smad4 antibody shown by western blot. Right, relative enrichment representing RNA levels associated with Smad4 relative to an input control. IgG served as a control. C. Colocalization analysis of Smad4 and circPTEN1 using protein IF and RNA FISH assays, respectively. Scale bar, 10 μm. D and E. The indicated cells were treated with 5 ng/mL TGF-β1 for 48 h, and motility was sequentially evaluated through Transwell migration assays and invasion assays. (D) Representative images. Scale bar, 40 μm. (E) Migrated cells were counted in five random fields per well. Upper, DLD1. Lower, LoVo. RS: pLCDH-circPTEN1-RS. ****, p < 0.0001. F. Cells treated with TGF-β1 as indicated in Fig. 4D were subjected to the 3D multicellular tumor spheroids invasion assay. Upper, representative images. Lower, the invading area of 15 cells was analyzed per group. ****, p < 0.0001. The scale bars represent 600 μm. RS: pLCDH-circPTEN1-RS. G and H. Increased or decreased tumor metastasis formed in the lungs of mice through vein tail injection (G) or in the livers of mice through inferior hemispleen implantation (H) of circPTEN1 knockdown cells and circPTEN1 overexpression cells treated with TGF-β1 as indicated in Fig. 4D. Left panel, representative bioluminescent images. Right panel, statistical analysis of bioluminescent tracking plots. **, p < 0.01. ***, p < 0.001. ****, p < 0.0001
Fig. 5
Fig. 5
Direct interaction between circPTEN1 and Smad4 inhibits the TGF-β1/Smad signaling pathway. A. Left, schematic illustrating the cyclization of linear RNA generated in vitro. Right, top, RT-PCR analysis of linear and cyclized circPTEN1 RNAs. Right, bottom, RNA-protein pull-down assays were conducted with FLAG-Smad4 purified from 293 T cells transfected with pCMV-tag-2b-Smad4 against cyclized circPTEN1. B. Electrophoretic mobility shift analysis of interactions between circPTEN1 and FLAG-Smad4. C. The Smad4 protein is characterized by the presence of Mad homology domain-1 (MH1) and Mad homology domain-2 (MH2). D. RIP assays showing the association of full-length Smad4 or Smad4 truncations with circPTEN1. Top, IP efficiency of FLAG-antibody shown by western blot. Down, relative enrichment representing RNA levels associated with full-length Smad4 or Smad4 truncations relative to an input control. IgG antibody served as a control. E. Electrophoretic mobility shift analysis of interactions between circPTEN1 and FLAG-Smad4 or FLAG-Smad4 truncations. F. The distribution of Smad2, Smad3, p-Smad2 and p-Smad3 in the nuclear fraction. LoVo cells with circPTEN1 knockdown or overexpression as indicated in Supplementary Fig. 6C and 6E were treated with 5 ng/mL TGF-β1 for 1 h. Nuclear proteins were extracted to detect the expression of the indicated proteins. Lamin B was used as a nuclear marker. RS: pLCDH-circPTEN1-RS. G. Subcellular localization of Smad2 or Smad3. C-terminal GFP-tagged Smad2 or Smad3 was introduced into circPTEN1 knockdown or overexpression LoVo cells, prior to be treated with 5 ng/mL TGF-β1 for 1 h. Cells were then stained with DAPI, followed by imaging with confocal microscopy. The scale bars represent 5 μm. RS: pLCDH-circPTEN1-RS. H. circPTEN1 inhibits the formation of Smad2-Smad4 and Smad3-Smad4 complexes. Western blot analysis of Smad2 and Smad3 following immunoprecipitation of Smad4 from circPTEN1 knockdown or overexpression LoVo cells as indicated in Supplementary Fig. 6C and 6E, which were treated with 5 ng/mL TGF-β1 for 1 h. RS: pLCDH-circPTEN1-RS
Fig. 6
Fig. 6
circPTEN1 suppresses CRC metastasis by inhibiting TGF-β/Smad-mediated EMT. A. The expression of Snail, Slug and ZEB1 in circPTEN1 knockdown or overexpressed LoVo cells as indicated in Supplementary Fig. 6C and Supplementary Fig. 6E treated with TGF-β1 was analyzed by qRT-PCR. RS: pLCDH-circPTEN1-RS. **, p < 0.01. ***, p < 0.001. ****, p < 0.0001. B. Dual-luciferase reporter assays of LoVo cells as indicated in Supplementary Fig. 6C and Supplementary Fig. 6E transfected with Snail, Slug or ZEB1 promoters in the presence or absence of TGF-β1 for 24 h. RS: pLCDH-circPTEN1-RS. C. LoVo cells, as indicated in Supplementary Fig. 6C and Supplementary Fig. 6E were treated with TGF-β1 for 24 h. The expression of E-cadherin, N-cadherin and vimentin was determined by immunoblot analysis. RS: pLCDH-circPTEN1-RS. D. circPTEN1 knockdown LoVo cells, circPTEN1 knockdown LoVo cells overexpressing Ski, or control cells were treated with TGF-β1 for 24 h. The expression of E-cadherin, N-cadherin, vimentin and Ski was determined by immunoblot analysis. E. circPTEN1 knockdown LoVo cells, circPTEN1 knockdown LoVo cells overexpressing Ski, or control cells were treated with TGF-β1 for 48 h, and the motility of these cells was sequentially evaluated through Transwell migration assays and invasion assays. Scale bar, 40 μm. F. Migrated cells in Fig. 6E were counted in five random fields per well to calculate cell migration and invasion ability. ****, p < 0.0001

References

    1. Hopkins BD, Hodakoski C, Barrows D, Mense SM, Parsons RE. PTEN function: the long and the short of it. Trends Biochem Sci. 2014;39:183–190. - PMC - PubMed
    1. Lee YR, Chen M, Pandolfi PP. The functions and regulation of the PTEN tumour suppressor: new modes and prospects. Nat Rev Mol Cell Biol. 2018;19:547–562. - PubMed
    1. Zhang Q, et al. PTENepsilon suppresses tumor metastasis through regulation of filopodia formation. EMBO J. 2021;40:e105806. - PMC - PubMed
    1. Liang H, et al. PTENbeta is an alternatively translated isoform of PTEN that regulates rDNA transcription. Nat Commun. 2017;8:14771. - PMC - PubMed
    1. Liang H, et al. PTENalpha, a PTEN isoform translated through alternative initiation, regulates mitochondrial function and energy metabolism. Cell Metab. 2014;19:836–848. - PMC - PubMed

Publication types

MeSH terms