Randomized Controlled Trial
. 2022 Feb 9;20(1):56.
doi: 10.1186/s12916-022-02254-y.

Effects of personalized diets by prediction of glycemic responses on glycemic control and metabolic health in newly diagnosed T2DM: a randomized dietary intervention pilot trial

Affiliations
Randomized Controlled Trial

Effects of personalized diets by prediction of glycemic responses on glycemic control and metabolic health in newly diagnosed T2DM: a randomized dietary intervention pilot trial

Michal Rein et al. BMC Med. .

Abstract

Background: Dietary modifications are crucial for managing newly diagnosed type 2 diabetes mellitus (T2DM) and preventing its health complications, but many patients fail to achieve clinical goals with diet alone. We sought to evaluate the clinical effects of a personalized postprandial-targeting (PPT) diet on glycemic control and metabolic health in individuals with newly diagnosed T2DM as compared to the commonly recommended Mediterranean-style (MED) diet.

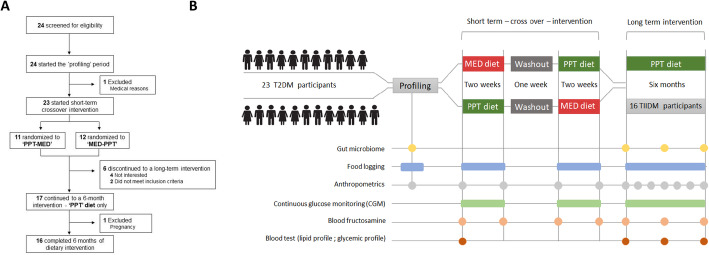
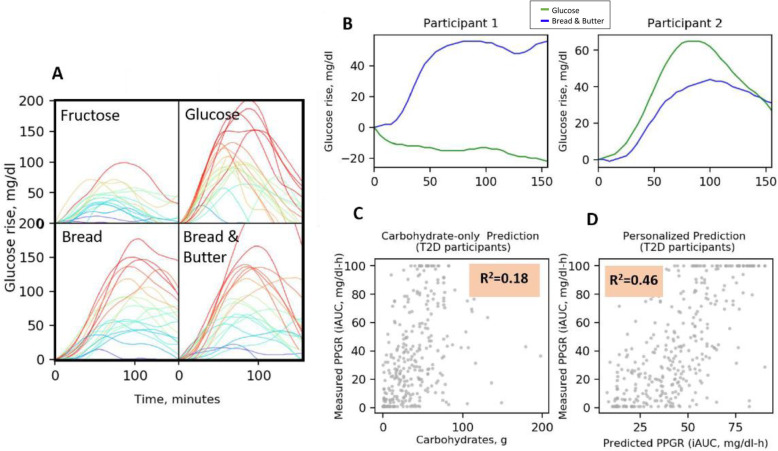
Methods: We enrolled 23 adults with newly diagnosed T2DM (aged 53.5 ± 8.9 years, 48% males) for a randomized crossover trial of two 2-week-long dietary interventions. Participants were blinded to their assignment to one of the two sequence groups: either PPT-MED or MED-PPT diets. The PPT diet relies on a machine learning algorithm that integrates clinical and microbiome features to predict personal postprandial glucose responses (PPGR). We further evaluated the long-term effects of PPT diet on glycemic control and metabolic health by an additional 6-month PPT intervention (n = 16). Participants were connected to continuous glucose monitoring (CGM) throughout the study and self-recorded dietary intake using a smartphone application.

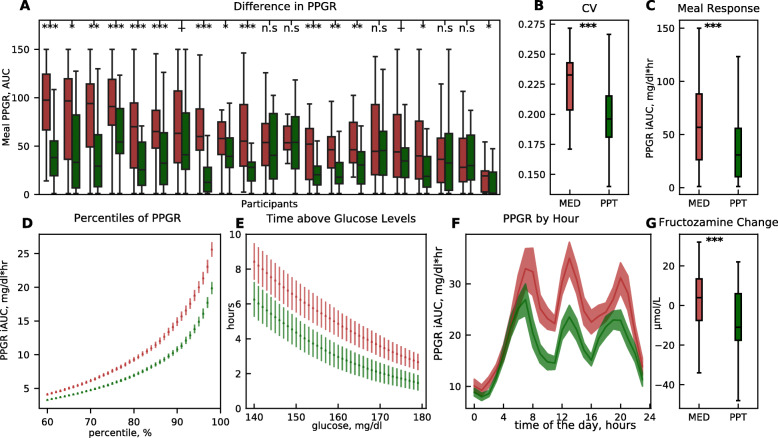
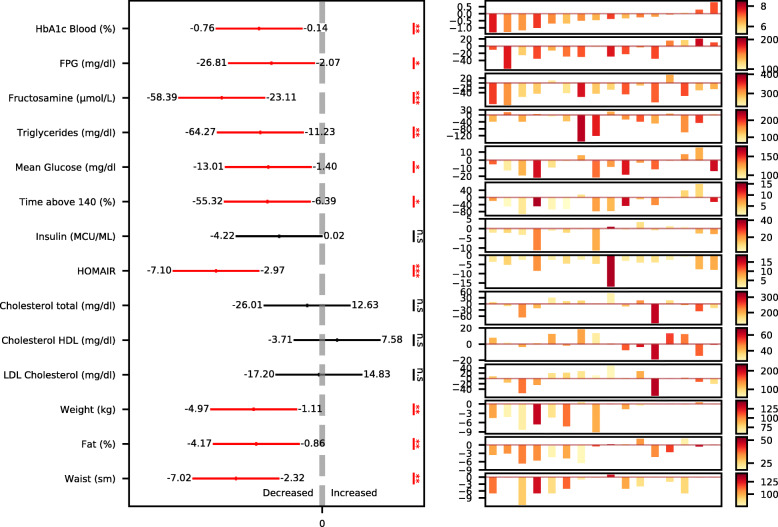
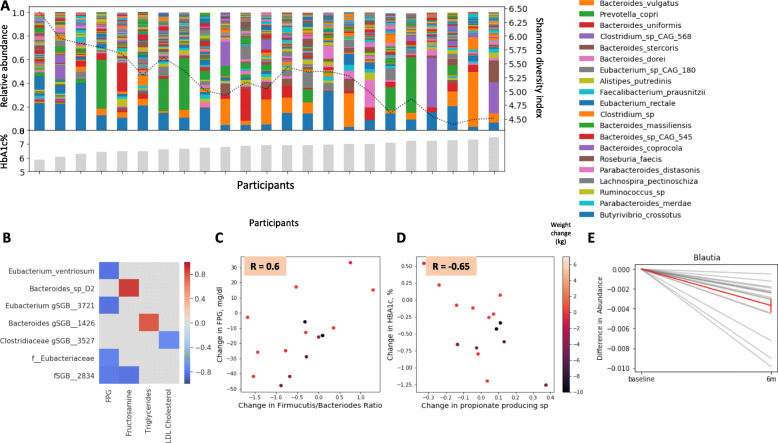
Results: In the crossover intervention, the PPT diet lead to significant lower levels of CGM-based measures as compared to the MED diet, including average PPGR (mean difference between diets, - 19.8 ± 16.3 mg/dl × h, p < 0.001), mean glucose (mean difference between diets, - 7.8 ± 5.5 mg/dl, p < 0.001), and daily time of glucose levels > 140 mg/dl (mean difference between diets, - 2.42 ± 1.7 h/day, p < 0.001). Blood fructosamine also decreased significantly more during PPT compared to MED intervention (mean change difference between diets, - 16.4 ± 37 μmol/dl, p < 0.0001). At the end of 6 months, the PPT intervention leads to significant improvements in multiple metabolic health parameters, among them HbA1c (mean ± SD, - 0.39 ± 0.48%, p < 0.001), fasting glucose (- 16.4 ± 24.2 mg/dl, p = 0.02) and triglycerides (- 49 ± 46 mg/dl, p < 0.001). Importantly, 61% of the participants exhibited diabetes remission, as measured by HbA1c < 6.5%. Finally, some clinical improvements were significantly associated with gut microbiome changes per person.

Conclusion: In this crossover trial in subjects with newly diagnosed T2DM, a PPT diet improved CGM-based glycemic measures significantly more than a Mediterranean-style MED diet. Additional 6-month PPT intervention further improved glycemic control and metabolic health parameters, supporting the clinical efficacy of this approach.

Trial registration: ClinicalTrials.gov number, NCT01892956.

Keywords: Dietary intervention; Gut microbiome; Personalized nutrition; Postprandial glucose responses; Type 2 diabetes mellitus.


Conflict of interest statement

The authors declare that they have no competing interests.

Figures

Fig. 1
Fig. 1
Trial flow and study outline. A Diagram of trial flow. B Illustration of the experimental design, comparing the effects of following a 2-week long MED diet vs. a PPT diet on glucose levels and the effect of an additional 6-month PPT intervention program on multiple metabolic parameters
Fig. 2
Fig. 2
High interpersonal variability in the postprandial glucose responses of subjects with T2DM. Patterns and predictions of postprandial glucose responses (PPGR) in a subset cohort of subjects with newly diagnosed T2DM from a previous study [21]. A Glucose response after consuming standardized meals (bread, bread and butter, glucose, and fructose, each consisting of 50 g of available carbohydrates). Each line represents a different participant; participants are colored according to the level of glucose as measured by the CGM. Range of PPGRs from 0 to 100 mg/dl × h. B Example of the PPGR to two standardized meals for two participants exhibiting opposite PPGRs. Each meal contains 50 g of carbohydrates. C PPGR predictions across 22 newly diagnosed T2DM participants. Dots represent predicted (x-axis) and CGM-measured PPGR (y-axis) for meals, based only on the meal’s carbohydrate content. D The same as C, but here, the model was based on our predictor evaluated in leave-one person-out cross-validation on 22 newly diagnosed T2DM participants
Fig. 3
Fig. 3
A PPT diet improves glycemic outcomes compared to the MED diet. Comparison of CGM-based glucose measures and fructosamine in the PPT diet (green) vs. MED diet (red), across all participants. A Boxplot of meal PPGRs during the MED diet (red) and PPT diet (green) interventions for all participants. Statistical significance is marked (Mann-Whitney U test ***p < 0.001, **p < 0.01, *p < 0.05, +p < 0.1; n.s, not significant). B As in A but for blood glucose fluctuations (coefficient of variation) across all participants during each of the diets. Defined as the ratio between the standard deviation and the mean of blood glucose levels during each of the diets (LMM, p < 0.001). C As in A but for the average meal PPGR across all participants during each of the diets (LMM, p < 0.001). D Percentiles of PPGRs from continuous glucose measurements across all participants throughout the MED diet (red) and the PPT diet (green) interventions. E Number of daily hours (y-axis) above glucose level thresholds (x-axis), across all participants throughout the MED diet (red) and PPT diet (green) interventions. F Average PPGR (y-axis) during hours of the day (x-axis) across all participants throughout the MED diet (red) and PPT diet (green) interventions. G As in A but for the average change in blood fructosamine across all participants during each of the diets (LMM, p < 0.001)
Fig. 4
Fig. 4
A PPT diet improves metabolic outcomes after 6 months. Illustration of changes in multiple metabolic outcomes across all participants and per participant. Left: changes in the outcomes across all participants (n = 16), presented as the 95% confidence interval (CI) of the change in outcomes at 6 months time point vs. baseline. Statistical significance is marked (one-sample t-test for all parameters except for HOMA-IR, which we used the Mann-Whitney U test, ***p < 0.001, **p < 0.01, *p < 0.05; n.s, not significant). Right: changes in the outcomes per participant, presented with a waterfall-like scheme, where each bar represents a participant. The color scale refers to bars, indicating the level of baseline value of each outcome for each participant. Participants are sorted by the 6-month change in HbA1c
Fig. 5
Fig. 5
Gut microbiome composition associates with clinical outcomes. A Per participant distributions of microbial taxa relative abundances at baseline. Colors indicate bacterial taxa according to the legend on the right. Participants are sorted by baseline HbA1c levels, presented as gray bars at the bottom. Microbiome diversity (Shannon Diversity Index) is illustrated with a dashed line, using a 5-person rolling average, indicating a negative association with HbA1c levels. B Heatmap of significant associations across all (n = 16) participants (p < 0.05, FDR corrected) between changes in microbial taxa (rows) and changes in clinical outcomes (columns) over the 6-month intervention period. C Correlation between 6-month change in FPG and 6-month change in Firmicutes/Bacteroidetes ratio. Dots represent participants, with color indicating weight loss in kilograms. D Correlation between change in HbA1c and change in propionate-producing bacteria over the 6-month intervention period. Dots represent participants, with color indicating weight loss in kilograms. E Change in the relative abundance of Blautia between baseline and 6 months after the intervention started (p < 0.05, FDR corrected). Shown is the average reduction in the relative abundance of Blautia genus across all participants (red line) and change per participant (gray lines)

Similar articles

Cited by

References

    1. American Diabetes Association Standards of medical care in diabetes-2018 abridged for primary care providers. Clin Diabetes. 2018;36(1):14–37. doi: 10.2337/cd17-0119. - DOI - PMC - PubMed
    1. Selvin E, Lazo M, Chen Y, Shen L, Rubin J, McEvoy JW, Hoogeveen RC, Sharrett AR, Ballantyne CM, Coresh J. Diabetes mellitus, prediabetes, and incidence of subclinical myocardial damage. Circulation. 2014;130(16):1374–1382. doi: 10.1161/CIRCULATIONAHA.114.010815. - DOI - PMC - PubMed
    1. Ogurtsova K, da Rocha Fernandes JD, Huang Y, Linnenkamp U, Guariguata L, Cho NH, Cavan D, Shaw JE, Makaroff LE. IDF Diabetes Atlas: global estimates for the prevalence of diabetes for 2015 and 2040. Diabetes Res Clin Pract. 2017;128:40–50. doi: 10.1016/j.diabres.2017.03.024. - DOI - PubMed
    1. Neeland IJ, Patel KV. Diabetes. In: Biomarkers in cardiovascular disease. Elsevier; 2019. p. 41–51.
    1. American Diabetes Association 6. Glycemic targets: standards of medical care in diabetes-2019. Diabetes Care. 2019;42(Supplement_1):S61–S70. doi: 10.2337/dc19-S006. - DOI - PubMed

Publication types

Associated data