. 2022 Feb 8;19(1):13.
doi: 10.1186/s12987-021-00299-4.

CNS endothelial derived extracellular vesicles are biomarkers of active disease in multiple sclerosis

Affiliations

CNS endothelial derived extracellular vesicles are biomarkers of active disease in multiple sclerosis

Michael Mazzucco et al. Fluids Barriers CNS. .

Abstract

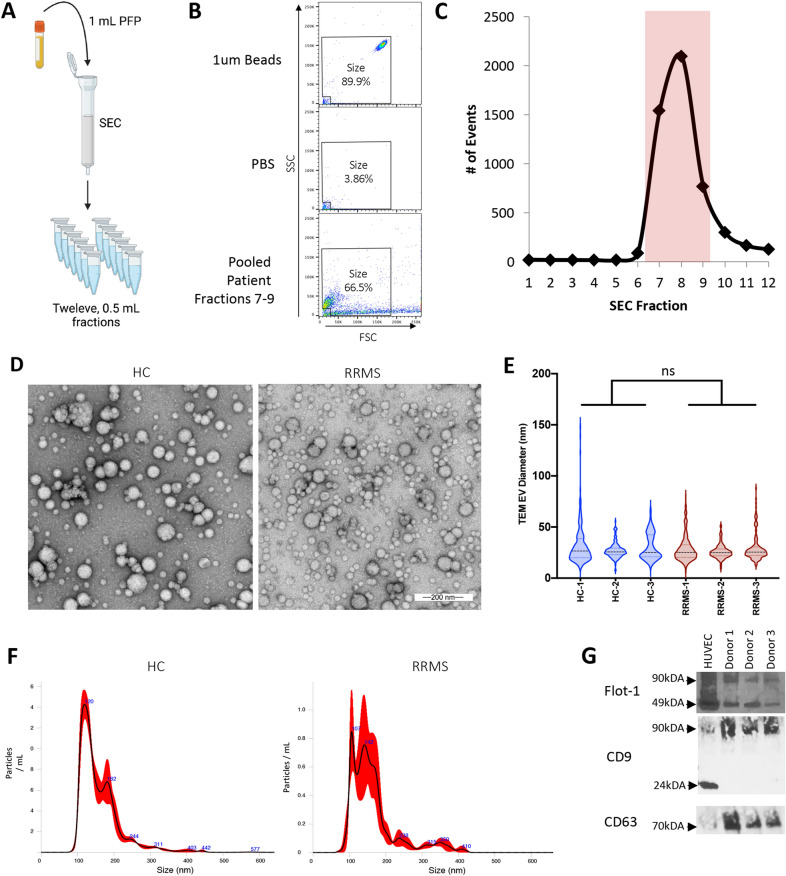
Background: Multiple sclerosis (MS) is a complex, heterogenous disease characterized by inflammation, demyelination, and blood-brain barrier (BBB) permeability. Currently, active disease is determined by physician confirmed relapse or detection of contrast enhancing lesions via MRI indicative of BBB permeability. However, clinical confirmation of active disease can be cumbersome. As such, disease monitoring in MS could benefit from identification of an easily accessible biomarker of active disease. We believe extracellular vesicles (EV) isolated from plasma are excellent candidates to fulfill this need. Because of the critical role BBB permeability plays in MS pathogenesis and identification of active disease, we sought to identify EV originating from central nervous system (CNS) endothelial as biomarkers of active MS. Because endothelial cells secrete more EV when stimulated or injured, we hypothesized that circulating concentrations of CNS endothelial derived EV will be increased in MS patients with active disease.

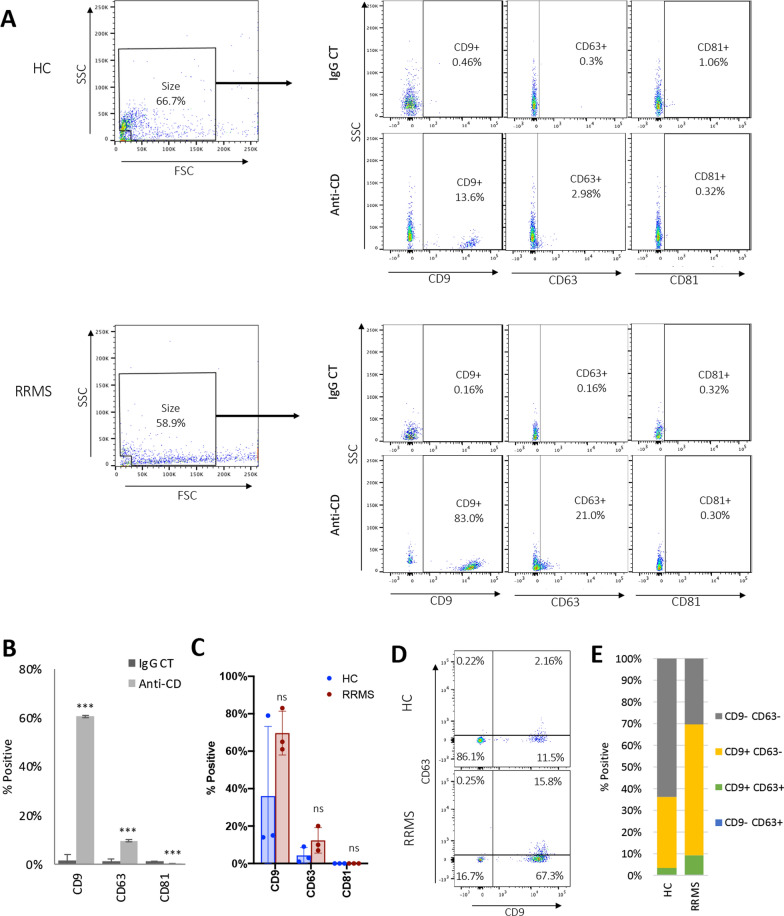
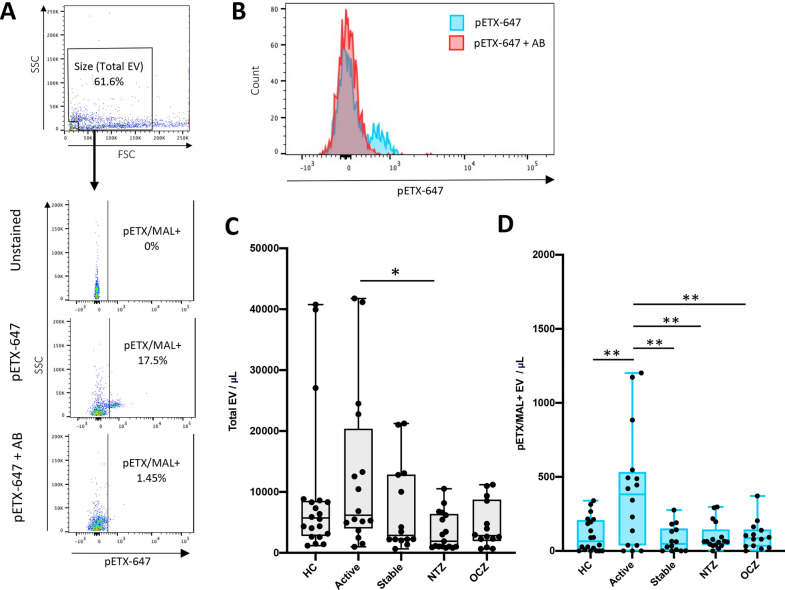
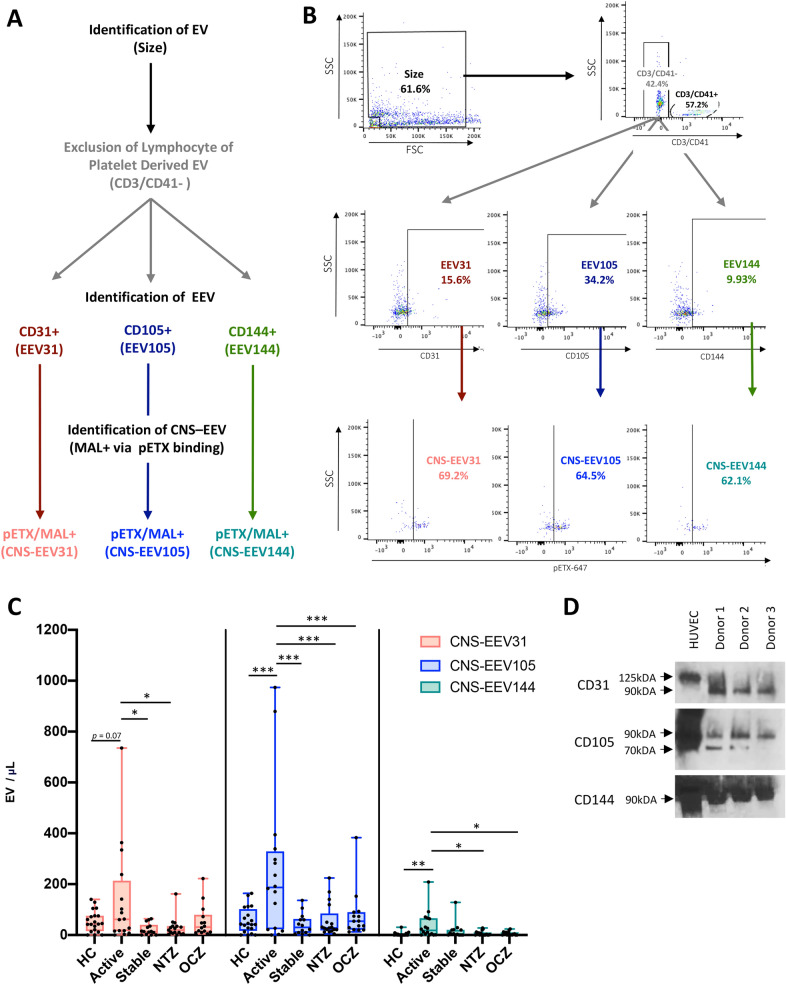
Methods: To test this, we developed a novel method to identify EV originating from CNS endothelial cells isolated from patient plasma using flow cytometry. Endothelial derived EV were identified by the absence of lymphocyte or platelet markers CD3 and CD41, respectively, and positive expression of pan-endothelial markers CD31, CD105, or CD144. To determine if endothelial derived EV originated from CNS endothelial cells, EV expressing CD31, CD105, or CD144 were evaluated for expression of the myelin and lymphocyte protein MAL, a protein specifically expressed by CNS endothelial cells compared to endothelial cells of peripheral organs.

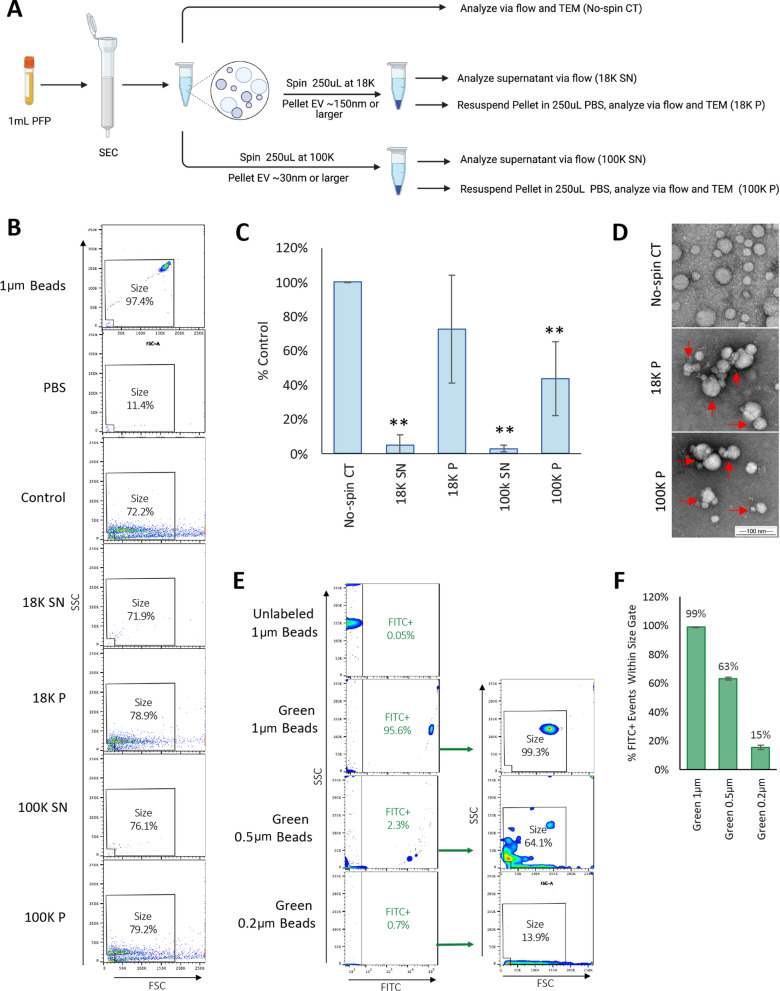
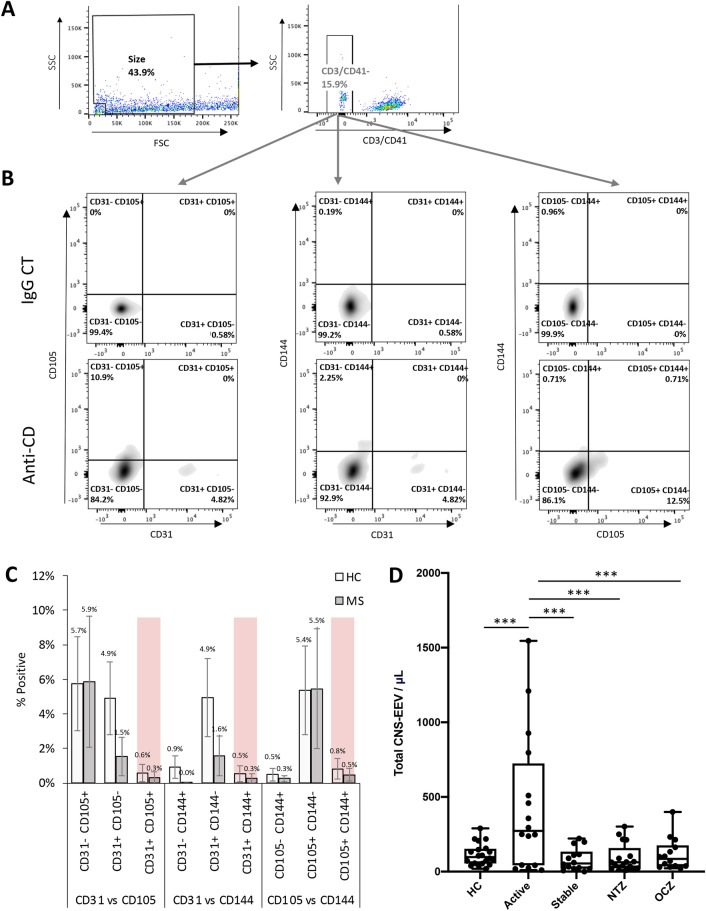
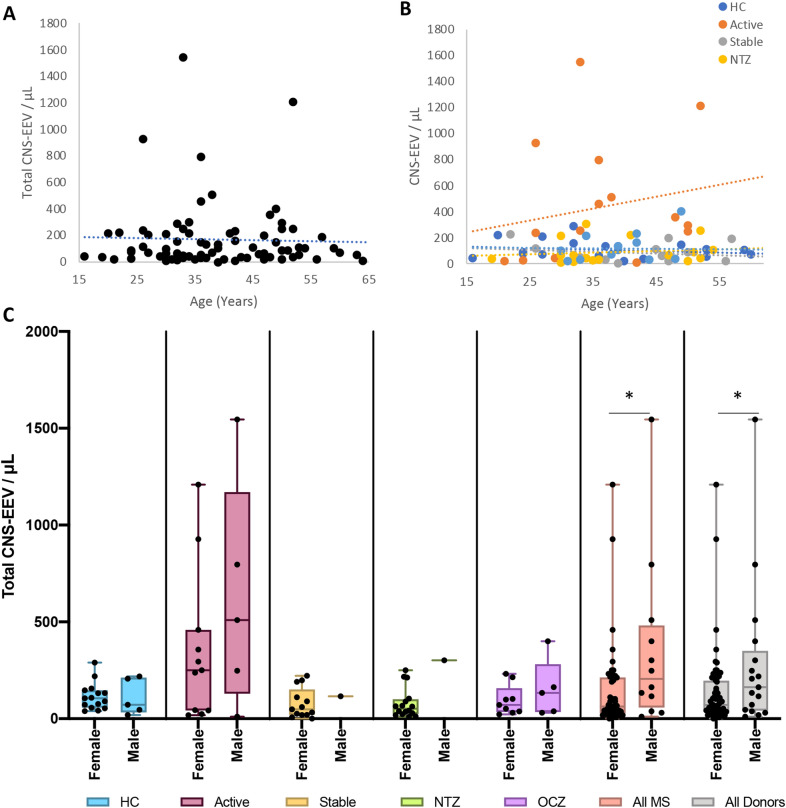
Results: Quality control experiments indicate that EV detected using our flow cytometry method are 0.2 to 1 micron in size. Flow cytometry analysis of EV isolated from 20 healthy controls, 16 relapsing-remitting MS (RRMS) patients with active disease not receiving disease modifying therapy, 14 RRMS patients with stable disease not receiving disease modifying therapy, 17 relapsing-RRMS patients with stable disease receiving natalizumab, and 14 RRMS patients with stable disease receiving ocrelizumab revealed a significant increase in the plasma concentration of CNS endothelial derived EV in patients with active disease compared to all other groups (p = 0.001).

Conclusions: For the first time, we have identified a method to identify CNS endothelial derived EV in circulation from human blood samples. Results from our pilot study indicate that increased levels of CNS endothelial derived EV may be a biomarker of BBB permeability and active disease in MS.

Keywords: Biomarker; Blood–brain barrier; Endothelial cells; Extracellular vesicles; Multiple sclerosis.


Conflict of interest statement

Antibody JL004 used in this publication is the subject of granted and pending patent applications.

Figures

Fig. 1
Fig. 1
Identification of SEC fractions for EV analysis via flow cytometry. A Schematic of experimental design. Twelve, 0.5 mL aliquots were collected after 1 mL of PFP was applied to SEC. B SEC fractions were analyzed via flow cytometry after FSC and SSC voltage was adjusted to reliably detect 1 μm beads (polystyrene microspheres) (top) and excluding mechanical noise observed in PBS alone (middle). Example of pooled SEC fractions seven, eight, and nine pooled from an individual donor (bottom). C The number of events within the size gate for each individual 0.5 ml SEC fractions was determine via flow cytometry. Fractions seven, eight, and nine (highlighted in red) contained the majority of detectable events and were pooled together for future analysis. D TEM analysis of pooled fractions from HC and RRMS patient. E Violin plots of EV diameter measured from TEM images for three HC and three RRMS patients. ns = nonsignificant determined by t-test. F Representative examples of NTA results of EV isolated from a HC and RRMS patient. G Western blot analysis of indicated proteins from purified EV lysates from three separate donors. HUVEC lysate was used as a positive control
Fig. 2
Fig. 2
Determination of flow cytometry size resolution limits. A Schematic of experimental approach for high-speed centrifugation experiments. EV from 1 mL PFP were isolated in 1.5 mL PBS using SEC as described. A control aliquot (no spin CT) was immediately analyzed via flow cytometry and TEM. Equal portions of isolated EV in PBS (250 uL) were centrifuged at 18,000 g (18 K) or 100,000 g (100 K) for one h to pellet large EV (~ 150 and larger) or small EV (~ 30 nm and larger), respectively. Supernatants (SN) were harvested, and EV enumerated via flow. EV Pellets (P) were resuspended in 250 uL PBS and then analyzed via flow and TEM. B Representative dot plots for each condition using size gate. 1um beads (polystyrene microspheres) and PBS are shown as controls. C Counts were normalized to no-spin controls and expressed as percent control. Results represent the mean ± STDEV of four separate donors. ** p < 0.01 versus control determined by one-way ANOVA with post-hoc Tukey HSD Test. D TEM analysis of EV in no-spin controls or after resuspension from 18 and 100 K pellets. Red arrows point to EV aggregates observed in resuspended EV pellets. E Flow cytometry analysis of unlabeled 1, 0.5, and 0.2 μm green-fluorescent beads (polystyrene microspheres). Unlabeled 1 μm beads were used as negative controls. Events positive for green fluorescence measured on the FITC channel (FITC +) were analyzed using the size gate determined in previous experiments. F Quantification of the percentage of FITC + events detected within the size gate. Results represents the mean ± STDEV of three replicates
Fig. 3
Fig. 3
Characterization of EV isolated from patient plasma samples. A SEC isolated EV were examined for expression of common EV markers CD9, CD63, and CD81 via flow cytometry. Representative dot plots from a healthy control (HC) and RRMS patient. FSC and SSC was used to select events of appropriate size using the size gate determined as previously described. Events from the size gate were analyzed for expression for expression CD9, CD63, or CD81 via staining with corresponding anti-CD antibodies (anti-CD). EV stained with appropriate isotype control (IgG CT) were used as negative controls. Positive gates were determined using IgG-stained controls for each individual donor. B Representative results from a single donor for the percentage of size events positive for indicated surface markers when stained with anti-CD markers or isotype controls (IgG CT). Results represents the mean ± STDEV of four replicates. *** p ≤ 0.001 determined by t-test. C Percentage of size events positive for indicated surface markers from HC or RRMS patients. Results represents the mean ± STDEV of three separate donors. Each dot is an individual donor. ns = not significant determined by t-test. D Representative dot plots comparing size events positive for CD9 or CD63 isolated from a HC or RRMS patient. E Percentage of size events negative for CD9 and CD63 (CD9−, CD63−), positive for CD9 and negative for CD63 (CD9+ , CD63−), positive for CD9 and CD63 (CD9+ , CD63+) or negative for CD9 and positive for CD63 (CD9−, CD63+) from HC or RRMS patients. Results represents the mean of three separate donors. Percent of events were not significantly different between HC and RRMS patients as determined by t-test
Fig. 4
Fig. 4
Detection of MAL expression on EV by pETX-647 binding. A Gating strategy for identification of pETX/MAL+ EV. SEC isolated EV were probed with pETX-647 or pETX-647 pretreated with a neutralizing antibody (pETX-647 + AB) which inhibits pETX-647 binding to MAL as a negative control. Unstained EV were used as an additional control. EV of appropriate size were analyzed for pETX-647 binding. B Histogram representation of pETX-647 fluorescence when EV are stained with pETX-647 or pETX-647 pretreated with the neutralizing antibody (pETX-647 + AB). C Enumeration of total EV identified from the size gate per μL of plasma for different patient groups including HC, active RRMS patients not receiving DMT (Active), stable RRMS patients not receiving DMT (Stable), or stable RRMS patients receiving natalizumab (NTZ) or ocrelizumab (OCZ). D Enumeration of pETX/MAL+ EV concentrations from indicated patient groups. Results are displayed as box and whisker plots with each individual patient represented as a dot. * p ≤ 0.05, ** p ≤ 0.01 determined by one-way ANOVA with post-hoc Tukey HSD Test
Fig. 5
Fig. 5
Phenotyping Strategy and enumeration of CNS-EEV from different patient populations. Diagram (A) and representative dot plots (B) of gating strategy to detect EV derived from CNS endothelial cells. EV of appropriate size were analyzed for the presence of CD3 or CD41 to determine if they were of lymphocyte or platelet origin, respectively. EV negative for CD3 and CD41 (CD3/CD41-) were analyzed for the presence of pan-endothelial markers CD31, CD105, and CD144. EV positive for CD31, CD105, or CD144 are referred to as EEV31, EEV105, and EEV144, respectively (Reviewed in Table 2). To determine if EEV31, EEV105, and EEV144 are derived from CNS endothelial cells, these events were analyzed for the expression of MAL via pETX-647 binding. EEV31, EEV105, and EEV144 positive for pETX/MAL are referred to as CNS-EEV31, CNS-EEV105, and CNS-EEV144, respectively (Reviewed in Table 2). Representative scatter plots of anti-CD-stained EV and their isotype controls are depicted in Additional file 1: Fig. S1. C Enumeration of CNS-EEV31, CNS-EEV105, and CNS-EEV144 per μL of plasma from different patient groups including HC, active RRMS patients not receiving DMT (Active), stable RRMS patients not receiving DMT (Stable), or stable RRMS patients receiving natalizumab (NTZ) or ocrelizumab (OCZ). Results are displayed as box and whisker plots with each dot representing an individual patient. * p ≤ 0.05, ** p ≤ 0.01, *** p ≤ 0.001 determined by one-way ANOVA with post-hoc Tukey HSD Test. D Western blot analysis of EV lysates for CD31, CD105, and CD144. HUVEC lysate was used as controls
Fig. 6
Fig. 6
CNS-EEV populations are unique and are increased in RRMS patients with active disease. A Gating strategy for analysis of CD3/CD41- EV for expression of multiple endothelial markers. B Representative density plots of CD3/CD41- EV positive for CD31 versus CD105 (left), CD31 versus CD144 (center), or CD105 versus CD144 (right) when stained with anti-CD antibodies or appropriate isotype controls (IgG CT). C Percent of CD3/CD41- EV positive for indicated marker combinations. Results are expressed as a mean ± the STEDV of seven healthy controls (HC) or seven RRMS donors. Note that less than 1% of EV are positive for multiple markers, highlighted in red. D Total number of CNS-EEV per μL plasma was calculated by adding the levels of CSN-EEV31, CNS-EEV105, CNS-EEV144 for each separate donor. Calculated total CNS-EEV per μL of plasma for different patient groups including HC, active RRMS patients not receiving DMT (Active), stable RRMS patients not receiving DMT (Stable), or stable RRMS patients receiving natalizumab (NTZ) or ocrelizumab (OCZ). Results are displayed as box and whisker plots with each dot representing an individual donor. *** p ≤ 0.001 determined by one-way ANOVA with post-hoc Tukey HSD Test
Fig. 7
Fig. 7
Detailed analysis of active RRMS patients. A Comparison of total CNS-EEV concentrations of active RRMS patients who had received steroids within 35 days prior to blood draw (+ steroids) (n = 6) or those who had not (- steroids) (n = 8). Results are displayed as box and whisker plots with each dot representing an individual donor. p value determined by unpaired students t-test. Correlation analysis of total CNS-EEV concentrations for active RRMS patients versus EDSS score (n = 16) (B) or days between MRI and blood draw (n = 11) (C). D Correlation analysis of total CNS-EEV concentrations for active RRMS patients CNS-EEV31, CNS-EEV105, and CNS-EEV144 concentrations. *** p ≤ 0.001, *** p ≤ 0.0001 determined by Pearson’s r analysis. Pearson’s correlation coefficient (r) and r2 values are indicated in graphs for significant correlations. Paired t test plots for comparison of CNS-EEV31 versus CNS-EEV105 (E), CNS-EEV31 versus CNS-EEV144 (F), and CNS-EEV105 versus CNS-EEV144 (G) for individual active RRMS patients. Each pair represents an individual active RRMS patient. * p ≤ 0.05, ** p ≤ 0.01
Fig. 8
Fig. 8
CNS-EEV correlation analysis. Correlation analysis of total EV concentrations versus total CNS-EEV concentrations of all donors (A) or when separated into different patient groups including (B) HC, active RRMS patients not receiving DMT (Active), stable RRMS patients not receiving DMT (Stable), or stable RRMS patients receiving natalizumab (NTZ) or ocrelizumab (OCZ). Note the data in C and D are identical but have been analyzed differently. Correlation analysis of total EEV levels versus total CNS-EEV levels for all donors (C) or when broken into different patient groups (D) as previously described. Note the data in C and D are identical but have been analyzed differently. * p ≤ 0.05, ** p ≤ 0.01, *** p ≤ 0.001, **** p ≤ 0.0001 determined by Pearson’s r analysis. Pearson’s correlation coefficient (r) and r2 values are indicated in graphs for significant correlations
Fig. 9
Fig. 9
Age and gender analysis for total CNS-EEV concentrations. Correlation analysis of patient age in years and total CNS-EEV concentration for all donors as a single group (A) or when separated into different patient groups (B). Note the data in A and B are identical but have been analyzed differently. Patient groups include HC, active RRMS patients not receiving DMT (Active), stable RRMS patients not receiving DMT (Stable), or stable RRMS patients receiving natalizumab (NTZ) or ocrelizumab (OCZ). No significant correlations were determined using Pearson’s r analysis. (C) Comparison of total CNS-EEV concentrations in female or male donors for indicated patient groups. Analysis was also performed when all MS patients were grouped together (All MS) or when all donors including HC were grouped together (All Donors). Results are displayed as box and whisker plots with each individual patient represented as a dot. * p ≤ 0.05 determined by unpaired student’s t-tests

Similar articles

Cited by

References

    1. Doyle LM, Wang MZ. Overview of extracellular vesicles, their origin, composition, purpose, and methods for exosome isolation and analysis. Cells. 2019;8(7):727. - PMC - PubMed
    1. Colombo M, Raposo G, Thery C. Biogenesis, secretion, and intercellular interactions of exosomes and other extracellular vesicles. Annu Rev Cell Dev Biol. 2014;30:255–289. - PubMed
    1. Andaloussi SE, Mäger I, Breakefield XO, Wood MJ. Extracellular vesicles: biology and emerging therapeutic opportunities. Nat Rev Drug Discov. 2013;12(5):347–357. - PubMed
    1. van Niel G, D'Angelo G, Raposo G. Shedding light on the cell biology of extracellular vesicles. Nat Rev Mol Cell Biol. 2018;19(4):213–228. - PubMed
    1. Thery C, Witwer KW, Aikawa E, Alcaraz MJ, Anderson JD, Andriantsitohaina R, et al. Minimal information for studies of extracellular vesicles 2018 (MISEV2018): a position statement of the International Society for Extracellular Vesicles and update of the MISEV2014 guidelines. J Extracell Vesicles. 2018;7(1):1535750. - PMC - PubMed