. 2022 May 2;12(5):1233-1247.
doi: 10.1158/2159-8290.CD-21-1119.

Zenocutuzumab, a HER2xHER3 Bispecific Antibody, Is Effective Therapy for Tumors Driven by NRG1 Gene Rearrangements

Affiliations

Zenocutuzumab, a HER2xHER3 Bispecific Antibody, Is Effective Therapy for Tumors Driven by NRG1 Gene Rearrangements

Alison M Schram et al. Cancer Discov. .

Abstract

NRG1 rearrangements are recurrent oncogenic drivers in solid tumors. NRG1 binds to HER3, leading to heterodimerization with other HER/ERBB kinases, increased downstream signaling, and tumorigenesis. Targeting ERBBs, therefore, represents a therapeutic strategy for these cancers. We investigated zenocutuzumab (Zeno; MCLA-128), an antibody-dependent cellular cytotoxicity-enhanced anti-HER2xHER3 bispecific antibody, in NRG1 fusion-positive isogenic and patient-derived cell lines and xenograft models. Zeno inhibited HER3 and AKT phosphorylation, induced expression of apoptosis markers, and inhibited growth. Three patients with chemotherapy-resistant NRG1 fusion-positive metastatic cancer were treated with Zeno. Two patients with ATP1B1-NRG1-positive pancreatic cancer achieved rapid symptomatic, biomarker, and radiographic responses and remained on treatment for over 12 months. A patient with CD74-NRG1-positive non-small cell lung cancer who had progressed on six prior lines of systemic therapy, including afatinib, responded rapidly to treatment with a partial response. Targeting HER2 and HER3 simultaneously with Zeno is a novel therapeutic paradigm for patients with NRG1 fusion-positive cancers.

Significance: NRG1 rearrangements encode chimeric ligands that activate the ERBB receptor tyrosine kinase family. Here we show that targeting HER2 and HER3 simultaneously with the bispecific antibody Zeno leads to durable clinical responses in patients with NRG1 fusion-positive cancers and is thus an effective therapeutic strategy. This article is highlighted in the In This Issue feature, p. 1171.


Figures

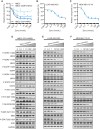
Figure 1. Zeno inhibits growth and blocks signal transduction in cell lines with NRG1 fusions. A–C, Cells were treated with the indicated concentrations of Zeno for 96 hours and then growth was determined using AlamarBlue viability dye. Values are expressed relative to the vehicle-treated control (100%). Data were analyzed by nonlinear regression to determine IC50 for inhibition of growth (see Supplementary Fig. S2A for IC50 values). Results represent the mean ± SD of three replicate determinations in one experiment. D–F, For Western blot analyses, cells were deprived of serum for 24 hours and then treated with the indicated concentrations of Zeno for 1.5 hours prior to preparation of whole-cell extracts and immunoblotting. Representative immunoblots are shown with GAPDH expression used as a western blotting loading control. At least two independent experiments were conducted.
Figure 1.
Zeno inhibits growth and blocks signal transduction in cell lines with NRG1 fusions. A–C, Cells were treated with the indicated concentrations of Zeno for 96 hours, and then growth was determined using AlamarBlue viability dye. Values are expressed relative to the vehicle-treated control (100%). Data were analyzed by nonlinear regression to determine IC50 for inhibition of growth (see Supplementary Fig. S2A for IC50 values). Results represent the mean ± SD of three replicate determinations in one experiment. D–F, For Western blot analyses, cells were deprived of serum for 24 hours and then treated with the indicated concentrations of Zeno for 1.5 hours prior to preparation of whole-cell extracts and immunoblotting. Representative immunoblots are shown, with GAPDH expression used as a Western blotting loading control. At least two independent experiments were conducted.
Figure 2. Zeno is effective in preclinical pancreatic cancer models. NRG1 fusion cDNAs were expressed in the immortalized pancreatic ductal epithelial cell line H6c7. A, Phosphokinase array showing kinases activated in H6c7 cells expressing an empty vector (EV) or ATP1B1–NRG1 fusion. B, The arrays in A were quantitated by densitometry and a volcano plot of phosphorylation, and P value data are shown. Data above the horizontal dashed line represent a significantly different level of phosphorylation. Increased phosphorylation is shown to the right of the vertical dashed line, decreased phosphorylation to the left. C, H6c7–ATP1B1–NRG1 and H6c7–SLC3A2–NRG1 cells were serum starved for 24 hours and then treated with Zeno for 1.5 hours. Whole-cell extracts were then prepared and subjected to western blotting. Representative immunoblots are shown with GAPDH expression used as a western blotting loading control. At least two independent experiments were conducted. D–F, A pancreatic adenocarcinoma PDX model (CTG-0943) was treated with the indicated dose of Zeno weekly. There were 10 animals per group. Tumor volume over time is shown in D. AUC analysis of tumor volumes is shown in E. ****, P < 0.0001. There was no statistically significant difference between the Zeno-treated groups. The percent change in the volume of individual tumors is shown in F.
Figure 2.
Zeno is effective in preclinical pancreatic cancer models. NRG1 fusion cDNAs were expressed in the immortalized pancreatic ductal epithelial cell line H6c7. A, A phosphokinase array showing kinases activated in H6c7 cells expressing an empty vector (EV) or ATP1B1–NRG1 fusion. B, The arrays in A were quantitated by densitometry and a volcano plot of phosphorylation, and P value data are shown. Data above the horizontal dashed line represent a significantly different level of phosphorylation. Increased phosphorylation is shown to the right of the vertical dashed line and decreased phosphorylation to the left. C, H6c7-ATP1B1-NRG1 and H6c7-SLC3A2-NRG1 cells were serum-starved for 24 hours and then treated with Zeno for 1.5 hours. Whole-cell extracts were then prepared and subjected to Western blotting. Representative immunoblots are shown, with GAPDH expression used as a Western blotting loading control. At least two independent experiments were conducted. D–F, A pancreatic adenocarcinoma PDX model (CTG-0943) was treated with the indicated dose of Zeno weekly. There were 10 animals per group. Tumor volume over time is shown in D. AUC analysis of tumor volumes is shown in E. The percentage change in the volume of individual tumors is shown in F.
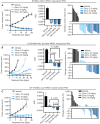
Figure 3. Zeno induces tumor regression in PDX models of NRG1-rearranged cancers. Mice bearing PDX tumors were treated with the indicated doses of Zeno once weekly. For each model, the figure shows the tumor volume (left), AUC (middle), and the change in volume of individual tumors at the time representative of the AUC analysis (right). A, ST3204 PDX model (lung cancer; eight mice per group). AUC analysis was performed for the time period ending on day 28. Tumor growth in Zeno-treated animals was significantly lower than that in vehicle-treated animals as measured by AUC (****, P < 0.0001), with no significant difference between the AUC values of the Zeno-treated groups (P > 0.05). B, LUAD-0061AS3 PDX model (lung cancer; five mice per group). AUC analysis was performed for the time period ending on day 17. ****, P < 0.0001 compared with the vehicle-treated group. C, OV-10-0050 PDX model (HGSOC; 10 mice per group). AUC analysis was performed for the time period ending on day 21. *, P = 0.03; **, P = 0.006; ***, P = 0006 compared with the vehicle-treated group. Results in all left and middle plots represent mean ± SEM. Administration of Zeno had no adverse effect on animal weight during the course of treatment (Supplementary Fig. S4).
Figure 3.
Zeno induces tumor regression in PDX models of NRG1-rearranged cancers. Mice bearing PDX tumors were treated with the indicated doses of Zeno once weekly. The tumor volume (left), AUC (middle), and change in volume of individual tumors at the time representative of the AUC analysis (right) are shown for each model. A, ST3204 PDX model (lung cancer; eight mice per group). AUC analysis was performed for the time period ending on day 28. Tumor growth in Zeno-treated animals was significantly lower than that in vehicle-treated animals as measured by AUC (****, P < 0.0001), with no significant difference between the AUC values of the Zeno-treated groups (P > 0.05). B, LUAD-0061AS3 PDX model (lung cancer; five mice per group). AUC analysis was performed for the time period ending on day 17. ****, P < 0.0001 compared with the vehicle-treated group. C, OV-10-0050 PDX model (HGSOC; 10 mice per group). AUC analysis was performed for the time period ending on day 21. *, P = 0.03; **, P = 0.006; ***, P = 0006 compared with the vehicle-treated group. Results in all left and middle plots represent mean ± SEM. Administration of Zeno had no adverse effect on animal weight during the course of treatment (Supplementary Fig. S4).
Figure 4. Clinical responses to Zeno. A, Clinical course of a 50-year-old man with ATP1B1–NRG1 fusion–positive PDAC treated with Zeno (top) including tumor volume and CA 19-9 levels during Zeno treatment (bottom). Best overall response is indicated for each therapy, including progressive clinical disease (PD) and partial response (PR) as defined by RECIST v1.1. B, Representative tumor imaging of this patient's liver metastases at baseline and eight weeks into treatment with Zeno. C, Clinical course of a 34-year-old man with ATP1B1–NRG1 fusion–positive PDAC treated with Zeno (top) including tumor volume and CA 19-9 levels during Zeno treatment (bottom). Best overall response is indicated for Zeno [stable disease (SD) as defined by RECIST v1.1]. D, Representative tumor imaging from this patient showing a CT scan of the pancreas performed at baseline and seven weeks into treatment with Zeno, and a PET scan 10 weeks into treatment showing non–FDG-avid liver metastases (no baseline available). E, Clinical course of a 52-year-old man with CD74–NRG1 fusion–positive NSCLC treated with Zeno after six prior lines of systemic therapy and multiple courses of radiation. Best overall response is labeled for each therapy, including clinical PD/SD, and PR as defined by RECIST v1.1. F, Tumor shrinkage in this patient depicted graphically (left) and by representative tumor imaging (right) performed at baseline and 16 weeks into Zeno treatment. Abbreviations: cape, capecitabine; carbo, carboplatin; gem, gemcitabine; MDS-EB1, myelodysplastic syndrome with excess blasts-1; pem, pemetrexed; PORT, postoperative radiotherapy; vin, vinorelbine.
Figure 4.
Clinical responses to Zeno. A, Clinical course of a 50-year-old man with ATP1B1–NRG1 fusion–positive PDAC treated with Zeno (top), including tumor volume and CA 19-9 levels during Zeno treatment (bottom). Best overall response is indicated for each therapy, including progressive clinical disease (PD) and partial response (PR) as defined by RECIST v1.1. B, Representative tumor imaging of this patient's liver metastases at baseline and 8 weeks into treatment with Zeno. C, Clinical course of a 34-year-old man with ATP1B1–NRG1 fusion–positive PDAC treated with Zeno (top), including tumor volume and CA 19-9 levels during Zeno treatment (bottom). Best overall response is indicated for Zeno [stable disease (SD) as defined by RECIST v1.1]. D, Representative tumor imaging from this patient showing a CT scan of the pancreas performed at baseline and 7 weeks into treatment with Zeno, and a PET scan 10 weeks into treatment showing non–FDG-avid liver metastases (no baseline available). E, Clinical course of a 52-year-old man with CD74–NRG1 fusion–positive NSCLC treated with Zeno after six prior lines of systemic therapy and multiple courses of radiation. Best overall response is labeled for each therapy, including clinical PD/SD and PR as defined by RECIST v1.1. F, Tumor shrinkage in this patient depicted graphically (left) and by representative tumor imaging (right) performed at baseline and 16 weeks into Zeno treatment. cape, capecitabine; carbo, carboplatin; gem, gemcitabine; LL, left lower; LUL, left upper lobe; MDS-EB1, myelodysplastic syndrome with excess blasts-1; pem, pemetrexed; PORT, postoperative radiotherapy; SRS, stereotactic radiosurgery; vin, vinorelbine.

Comment in

  • Cancer Discov. 12:1171.
  • Cancer Discov. 12:1171.

References

    1. Jonna S, Feldman RA, Swensen J, Gatalica Z, Korn WM, Borghaei H, et al. Detection of NRG1 gene fusions in solid tumors. Clin Cancer Res 2019;25:4966–72. - PMC - PubMed
    1. Ptakova N, Martinek P, Holubec L, Janovsky V, Vancurova J, Grossmann P, et al. Identification of tumors with NRG1 rearrangement, including a novel putative pathogenic UNC5D-NRG1 gene fusion in prostate cancer by data-drilling a de-identified tumor database. Genes Chromosomes Cancer 2021;60:474–81. - PubMed
    1. Huang HE, Chin SF, Ginestier C, Bardou VJ, Adelaide J, Iyer NG, et al. A recurrent chromosome breakpoint in breast cancer at the NRG1/neuregulin 1/heregulin gene. Cancer Res 2004;64:6840–4. - PubMed
    1. Fernandez-Cuesta L, Plenker D, Osada H, Sun R, Menon R, Leenders F, et al. CD74-NRG1 fusions in lung adenocarcinoma. Cancer Discov 2014;4:415–22. - PubMed
    1. Dhanasekaran SM, Balbin OA, Chen G, Nadal E, Kalyana-Sundaram S, Pan J, et al. Transcriptome meta-analysis of lung cancer reveals recurrent aberrations in NRG1 and Hippo pathway genes. Nat Commun 2014;5:5893. - PMC - PubMed

Publication types