. 2022 May 2;28(9):1948-1965.
doi: 10.1158/1078-0432.CCR-21-1299.

DOT1L Is a Novel Cancer Stem Cell Target for Triple-Negative Breast Cancer

Affiliations

DOT1L Is a Novel Cancer Stem Cell Target for Triple-Negative Breast Cancer

Hetakshi Kurani et al. Clin Cancer Res. .

Abstract

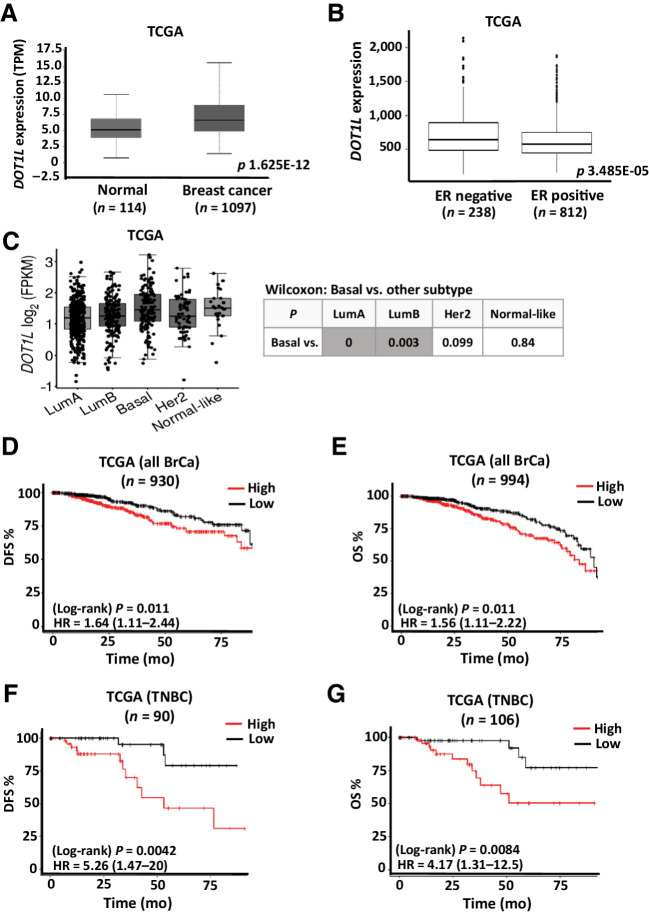
Purpose: Although chemotherapies kill most cancer cells, stem cell-enriched survivors seed metastasis, particularly in triple-negative breast cancers (TNBC). TNBCs arise from and are enriched for tumor stem cells. Here, we tested if inhibition of DOT1L, an epigenetic regulator of normal tissue stem/progenitor populations, would target TNBC stem cells.

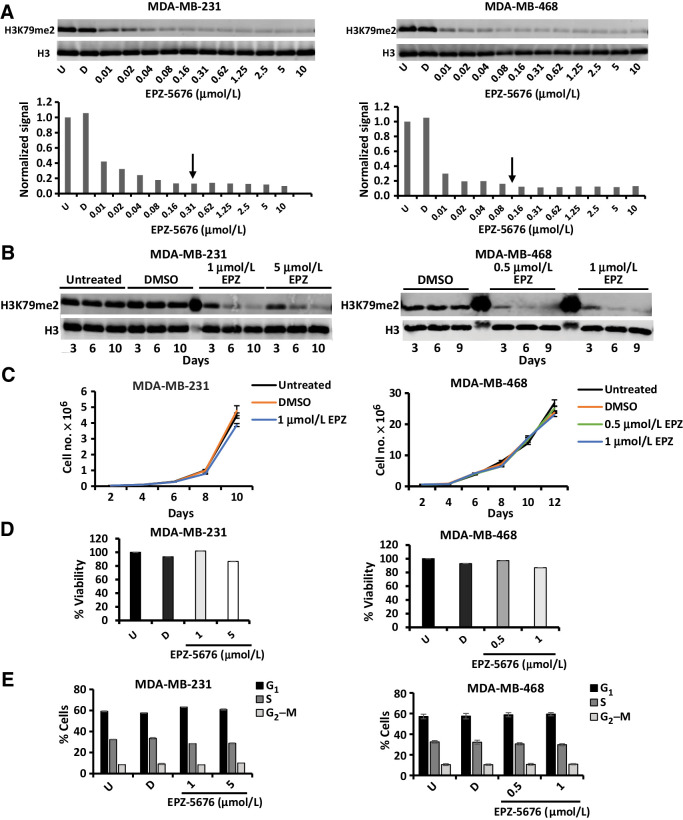
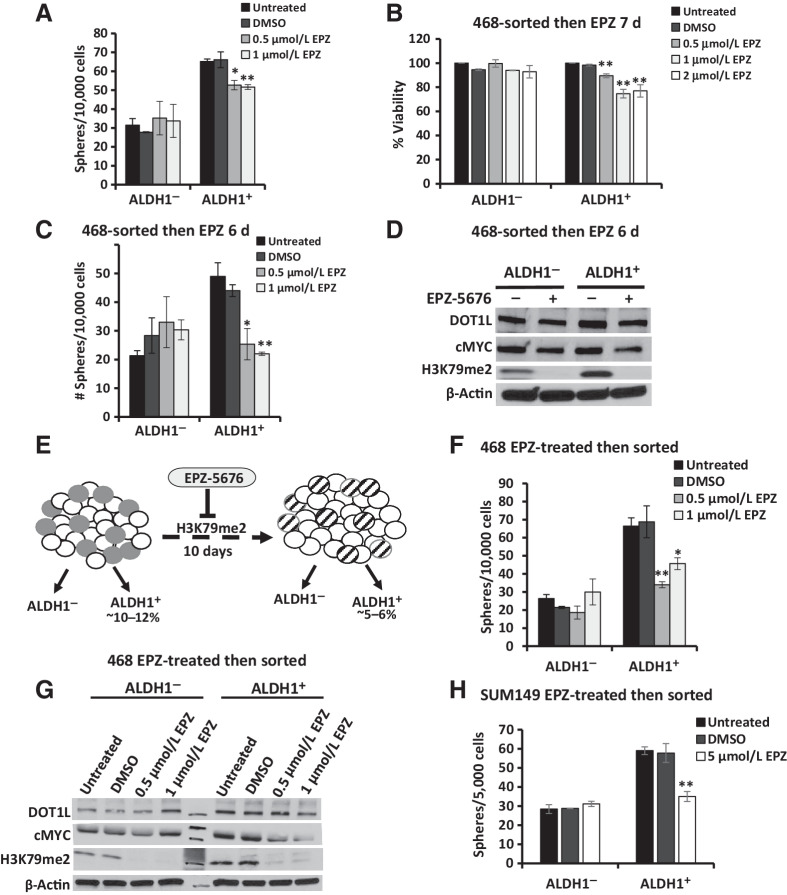
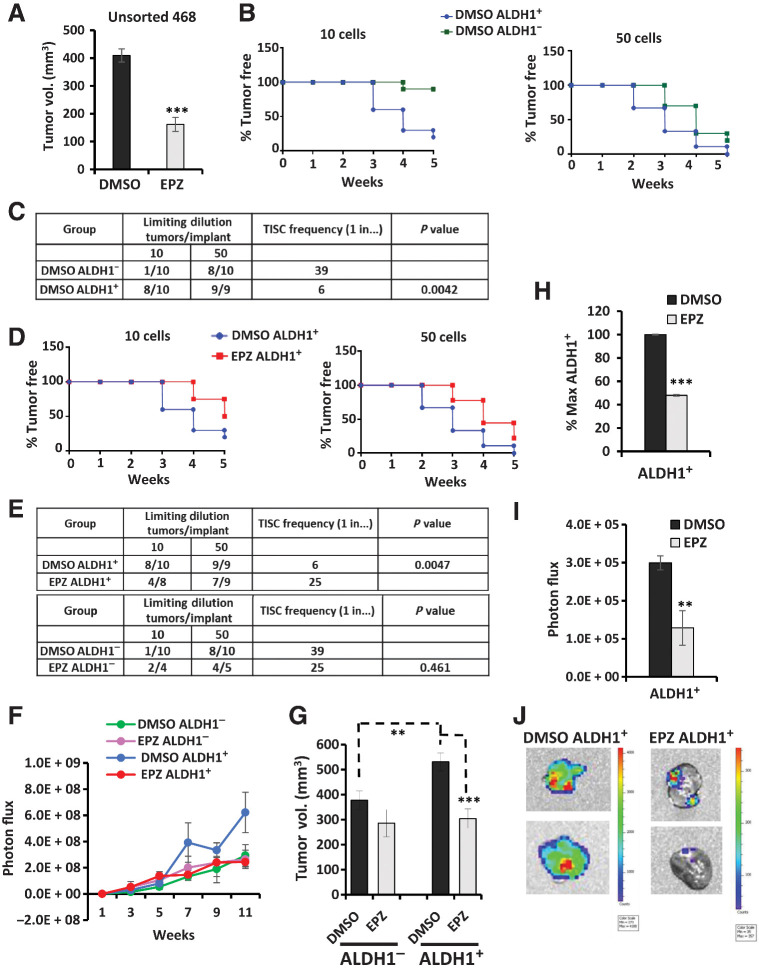
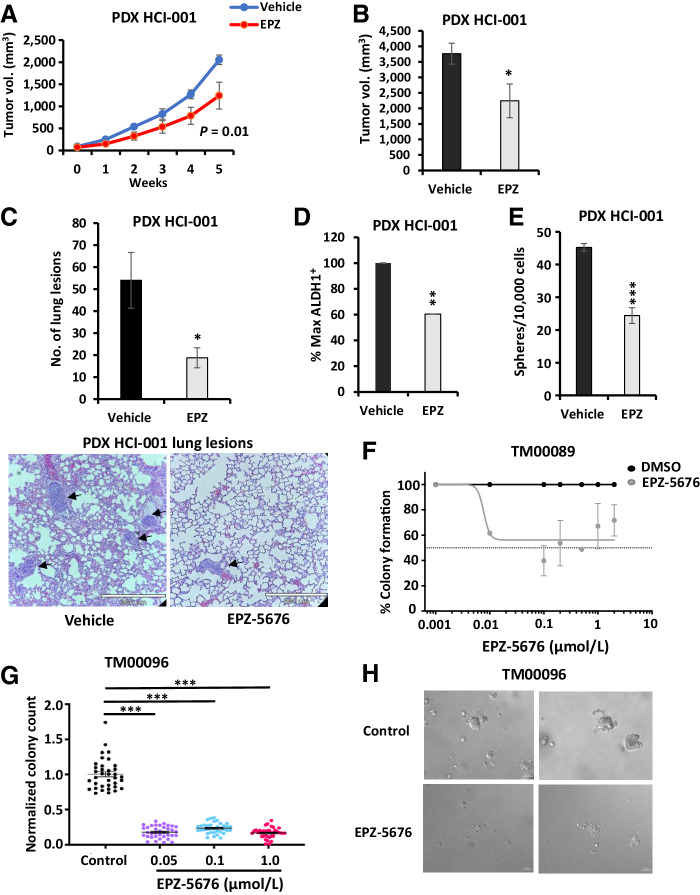
Experimental design: Effects of DOT1L inhibition by EPZ-5676 on stem cell properties were tested in three TNBC lines and four patient-derived xenograft (PDX) models and in isolated cancer stem cell (CSC)-enriched ALDH1+ and ALDH1- populations. RNA sequencing compared DOT1L regulated pathways in ALDH1+ and ALDH1- cells. To test if EPZ-5676 decreases CSC in vivo, limiting dilution assays of EPZ-5676/vehicle pretreated ALDH1+ and ALDH1- cells were performed. Tumor latency, growth, and metastasis were evaluated. Antitumor activity was also tested in TNBC PDX and PDX-derived organoids.

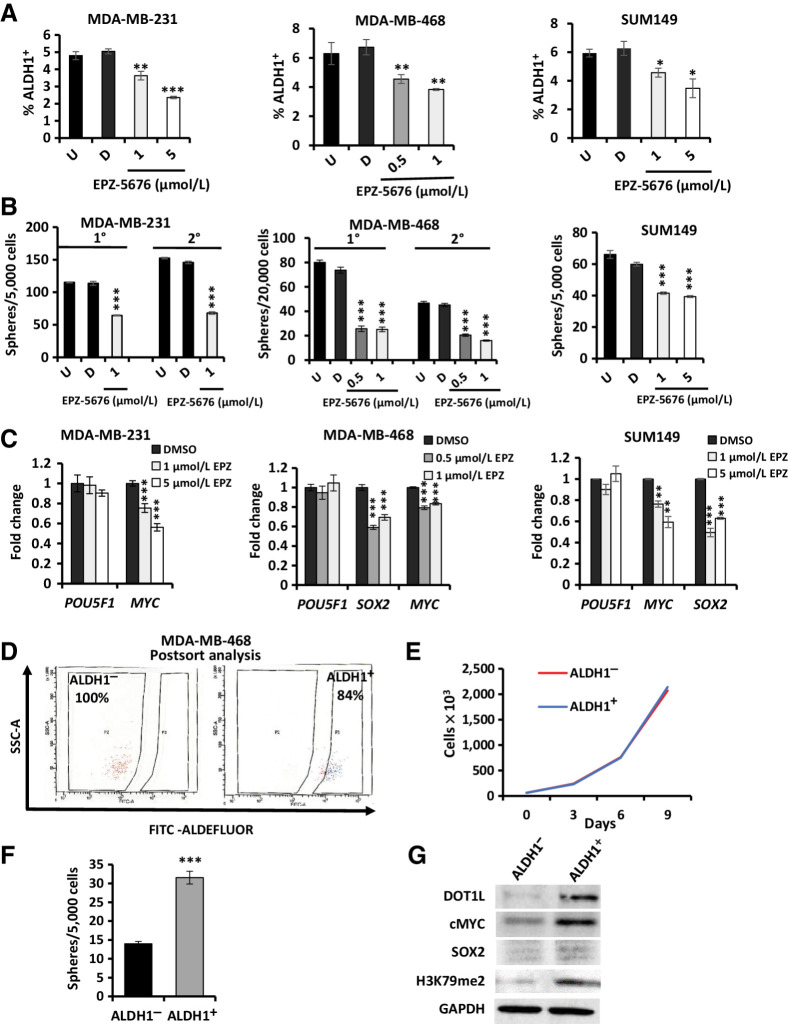
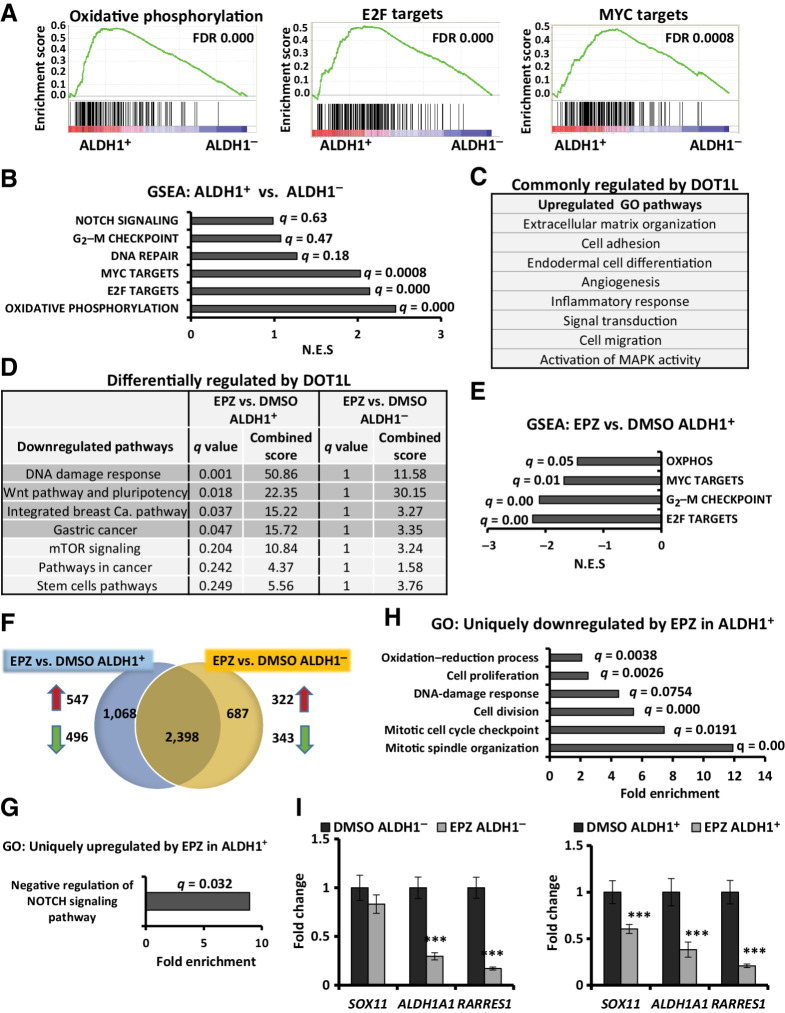
Results: ALDH1+ TNBC cells exhibit higher DOT1L and H3K79me2 than ALDH1-. DOT1L maintains MYC expression and self-renewal in ALDH1+ cells. Global profiling revealed that DOT1L governs oxidative phosphorylation, cMyc targets, DNA damage response, and WNT activation in ALDH1+ but not in ALDH1- cells. EPZ-5676 reduced tumorspheres and ALDH1+ cells in vitro and decreased tumor-initiating stem cells and metastasis in xenografts generated from ALDH1+ but not ALDH1- populations in vivo. EPZ-5676 significantly reduced growth in vivo of one of two TNBC PDX tested and decreased clonogenic 3D growth of two other PDX-derived organoid cultures.

Conclusions: DOT1L emerges as a key CSC regulator in TNBC. Present data support further clinical investigation of DOT1L inhibitors to target stem cell-enriched TNBC.


Figures

Figure 1. Prognostic value of DOT1L expression in breast cancer. A, Box plot comparing DOT1L gene expression in breast cancer (n = 1,097) and normal breast tissue (n = 114) using TCGA data set. (The data figure was generated using UALCAN cancer OMICS web portal) (50). B, Box plot comparing DOT1L gene expression in estrogen receptor positive (n = 812) and estrogen receptor negative (n = 238) in TCGA data set downloaded from cBioPortal. C, Gene-expression analysis of DOT1L expression (FPKM) in breast cancer subtypes using TCGA data set. Nonparametric Wilcoxon test P values for comparison of basal vs. each subtype is tabulated. (The data figure was generated using tumorsurvival.org portal.) D and E, Breast cancer data from TCGA was downloaded from cbioportal.org. Kaplan–Meier analysis shows association of DOT1L gene expression above or below median expression with DFS or OS, for patients who had disease recurrence (D) or who died within 8 years (E). F and G, TNBC data from TCGA were downloaded from cbioportal.org. Kaplan–Meier analysis shows association of DOT1L gene expression above or below median expression with RFS (F) or OS (G), for TNBC patients who had disease recurrence or who died within 8 years, respectively. HA = hazard ratio; log-rank P values are shown. See also Supplementary Fig. S1.
Figure 1.
Prognostic value of DOT1L expression in breast cancer. A, Box plot comparing DOT1L gene expression in breast cancer (n = 1,097) and normal breast tissue (n = 114) using TCGA data set. (The data figure was generated using UALCAN cancer OMICS web portal) (50). B, Box plot comparing DOT1L gene expression in estrogen receptor positive (n = 812) and estrogen receptor negative (n = 238) in TCGA data set downloaded from cBioPortal. C, Gene-expression analysis of DOT1L expression (FPKM) in breast cancer subtypes using TCGA data set. Nonparametric Wilcoxon test P values for comparison of basal vs. each subtype is tabulated. (The data figure was generated using tumorsurvival.org portal.) D and E, Breast cancer data from TCGA was downloaded from cbioportal.org. Kaplan–Meier analysis shows association of DOT1L gene expression above or below median expression with DFS or OS, for patients who had disease recurrence (D) or who died within 8 years (E). F and G, TNBC data from TCGA were downloaded from cbioportal.org. Kaplan–Meier analysis shows association of DOT1L gene expression above or below median expression with RFS (F) or OS (G), for TNBC patients who had disease recurrence or who died within 8 years, respectively. HA = hazard ratio; log-rank P values are shown. See also Supplementary Fig. S1.
Figure 2. DOT1L inhibition by EPZ-5676 does not significantly change proliferation, viability, or cell-cycle distribution. A, Cells were treated with indicated drug concentration or DMSO for 7 days. Histones were acid extracted and analyzed for H3K79me2 levels by Western blots as described in Materials and Methods. H3K79 me2 levels were normalized against total H3 and H3K79me2 quantification plotted. Arrows indicate IC90 concentration at which maximal inhibition was achieved. B, Cells were treated with indicated drug concentration or DMSO and analyzed for H3K79me2 and total H3 levels after 3, 6, 9–10 days. C, Cells were treated with indicated EPZ-5676 concentrations, and viable cells were counted after 2, 4, 6, 8, 10, and 12 days using Trypan Blue exclusion dye. Untreated and DMSO-treated cells served as controls. D, Cells were treated with or without indicated EPZ-5676 concentrations for 10 days followed by viability assay using MTS reagent. Absorbance was measured at 490 nm. Untreated (U) and DMSO (D)- treated cells served as controls. None of the experimental values differed significantly from U or D controls. E, Cells were treated with EPZ-5676 or DMSO (D) as vehicle or left untreated (U) for 10 days and were analyzed for cell-cycle distribution by flow cytometry following BrdUrd pulse labeling and propidium iodide staining. All graphed data represent the means ± SEM of triplicated repeats from at least three independent biological assays.
Figure 2.
DOT1L inhibition by EPZ-5676 does not significantly change proliferation, viability, or cell-cycle distribution. A, Cells were treated with indicated drug concentration or DMSO for 7 days. Histones were acid extracted and analyzed for H3K79me2 levels by Western blots as described in Materials and Methods. H3K79 me2 levels were normalized against total H3 and H3K79me2 quantification plotted. Arrows indicate IC90 concentration at which maximal inhibition was achieved. B, Cells were treated with indicated drug concentration or DMSO and analyzed for H3K79me2 and total H3 levels after 3, 6, 9–10 days. C, Cells were treated with indicated EPZ-5676 concentrations, and viable cells were counted after 2, 4, 6, 8, 10, and 12 days using Trypan Blue exclusion dye. Untreated and DMSO-treated cells served as controls. D, Cells were treated with or without indicated EPZ-5676 concentrations for 10 days followed by viability assay using MTS reagent. Absorbance was measured at 490 nm. Untreated (U) and DMSO (D)- treated cells served as controls. None of the experimental values differed significantly from U or D controls. E, Cells were treated with EPZ-5676 or DMSO (D) as vehicle or left untreated (U) for 10 days and were analyzed for cell-cycle distribution by flow cytometry following BrdUrd pulse labeling and propidium iodide staining. All graphed data represent the means ± SEM of triplicated repeats from at least three independent biological assays.
Figure 3. DOT1L inhibition decreases CSC properties and CSC-enriched ALDH1+ cells express high DOT1L and H3K79me2 levels. A, MDA-MB-231 (left), SUM149 (right), and MDA-MB-468 (center) cells were treated ± EPZ-5676 or DMSO for 10 days and then assayed for ALDH1 activity (%ALDH1+) by the ALDEFLUOR assay. B, MDA-MB-231 (left), SUM149 (right), and MDA-MB-468 (center) cells were pretreated ± EPZ-5676 or DMSO for 10 days and then seeded into sphere assays ± EPZ-5676 or DMSO added once to the media at seeding without further replenishment. Spheres ≥ 75 μm were counted after 12–14 days and graphed as mean ± SEM. C, Embryonic stem cell TFs POU5F1 (OCT4), MYC, and SOX2 expression was assayed by qPCR after 10-day exposure to EPZ-5676 or DMSO and mean values graphed ± SEM. D, ALDH1 activity was assayed in 468 cells by ALDEFLUOR assay, and ALDH1+ and ALDH1− cells were sorted by flow cytometry as described in Materials and Methods. Representative images show the purity of flow-sorted ALDH1+ and ALDH1− populations upon postsort analysis. E, Population growth curves show mean cell numbers of sorted ALDH1+ and ALDH1− 468 cells grown over 9 days in culture. F, FACS-sorted 468 ALDH1+ and ALDH1− cells were seeded into sphere assays. Spheres ≥ 75 μm were counted at 14 days, and mean sphere numbers are graphed ± SEM. G, Western blots show DOT1L, cMYC, SOX2, and global H3K79 dimethylation levels in sorted ALDH1+ and ALDH1− 468 populations. All assays with graphed data were performed as three technical replicates in each of three biological repeats, and mean numbers are graphed ± SEM. Student t test compares each drug condition with untreated control: *, P ≤ 0.05; **, P ≤ 0.01; ***, P ≤ 0.001. See also Supplementary Fig. S2.
Figure 3.
DOT1L inhibition decreases CSC properties and CSC-enriched ALDH1+ cells express high DOT1L and H3K79me2 levels. A, MDA-MB-231 (left), SUM149 (right), and MDA-MB-468 (center) cells were treated ± EPZ-5676 or DMSO for 10 days and then assayed for ALDH1 activity (%ALDH1+) by the ALDEFLUOR assay. B, MDA-MB-231 (left), SUM149 (right), and MDA-MB-468 (center) cells were pretreated ± EPZ-5676 or DMSO for 10 days and then seeded into sphere assays ± EPZ-5676 or DMSO added once to the media at seeding without further replenishment. Spheres ≥ 75 μm were counted after 12–14 days and graphed as mean ± SEM. C, Embryonic stem cell TFs POU5F1 (OCT4), MYC, and SOX2 expression was assayed by qPCR after 10-day exposure to EPZ-5676 or DMSO and mean values graphed ± SEM. D, ALDH1 activity was assayed in 468 cells by ALDEFLUOR assay, and ALDH1+ and ALDH1 cells were sorted by flow cytometry as described in Materials and Methods. Representative images show the purity of flow-sorted ALDH1+ and ALDH1 populations upon postsort analysis. E, Population growth curves show mean cell numbers of sorted ALDH1+ and ALDH1 468 cells grown over 9 days in culture. F, FACS-sorted 468 ALDH1+ and ALDH1 cells were seeded into sphere assays. Spheres ≥ 75 μm were counted at 14 days, and mean sphere numbers are graphed ± SEM. G, Western blots show DOT1L, cMYC, SOX2, and global H3K79 dimethylation levels in sorted ALDH1+ and ALDH1 468 populations. All assays with graphed data were performed as three technical replicates in each of three biological repeats, and mean numbers are graphed ± SEM. Student t test compares each drug condition with untreated control: *, P ≤ 0.05; **, P ≤ 0.01; ***, P ≤ 0.001. See also Supplementary Fig. S2.
Figure 4. Prolonged DOT1L inhibition attenuates sphere formation and cMyc expression in ALDH1+ cells. A, ALDH1+ and ALDH1− cells isolated from 468 were plated into sphere assays ± EPZ-5676 or DMSO added to sphere media at seeding. Mean sphere numbers ≥ 75 μm in diameter at 12–14 days with ± SEM are graphed. Total drug exposure was 3 days. B, Cell viability was assayed in sorted 468 ALDH1+ and ALDH1− cells treated ± EPZ-5676 or DMSO controls over 7 days. C, ALDH1+- and ALDH1−-sorted 468 cells were cultured ± EPZ-5676 or DMSO for 6 days, then plated into sphere assay conditions ± either DMSO or EPZ-5676 added once at seeding. Mean sphere numbers at 14 days are graphed ± SEM. Total drug exposure was approximately 9 days. D, Western blots show DOT1L, cMyc, and global H3K79me2 levels in ALDH1+ and ALDH1− populations treated with DMSO control or 0.5 μmol/L EPZ-5676 for 6 days. E, Model compares treatment-naïve ALDH1+ cells (gray, left image) with EPZ-5676–treated ALDH1+ cells that persist after 10 days EPZ-5676 (striped, right image). The decrease in ALDH1+ cells with treatment from 10% to 5% could result from ALDH1+ cell death or differentiation to generate more ALDH1− progeny. F, ALDH1+ and ALDH1− 468 cells were isolated after 468 treatment ± EPZ-5676 or DMSO for 10 days. Sorted cells were then plated into sphere assay with the drug or DMSO added once at seeding. Spheres ≥ 75 μm were counted at 12–14 days, and mean numbers ± SEM were plotted. Total drug exposure was 10 + 3 days or approximately 13 days. G, ALDH1+ and ALDH1− 468 cells were isolated after 468 treatment ± EPZ-5676 or DMSO for 10 days and levels of DOT1L, cMyc, and global H3K79me2 assayed by Western blots. H, SUM149 cells were treated with EPZ-5676 or DMSO for 10 days and FACS isolated into ALDH1+ and ALDH1− cells. Sorted cells were plated into sphere assay with drug/DMSO added at seeding, and spheres were counted at 12–14 days. Mean number of spheres is plotted with ± SEM. All assays were performed in three biological repeat sorts with three technical replicates within each assay and mean is graphed with ± SEM. Student t test compares each drug condition to DMSO controls: *, P ≤ 0.05; **, P ≤ 0.01.
Figure 4.
Prolonged DOT1L inhibition attenuates sphere formation and cMyc expression in ALDH1+ cells. A, ALDH1+ and ALDH1 cells isolated from 468 were plated into sphere assays ± EPZ-5676 or DMSO added to sphere media at seeding. Mean sphere numbers ≥ 75 μm in diameter at 12–14 days with ± SEM are graphed. Total drug exposure was 3 days. B, Cell viability was assayed in sorted 468 ALDH1+ and ALDH1 cells treated ± EPZ-5676 or DMSO controls over 7 days. C, ALDH1+- and ALDH1-sorted 468 cells were cultured ± EPZ-5676 or DMSO for 6 days, then plated into sphere assay conditions ± either DMSO or EPZ-5676 added once at seeding. Mean sphere numbers at 14 days are graphed ± SEM. Total drug exposure was approximately 9 days. D, Western blots show DOT1L, cMyc, and global H3K79me2 levels in ALDH1+ and ALDH1 populations treated with DMSO control or 0.5 μmol/L EPZ-5676 for 6 days. E, Model compares treatment-naïve ALDH1+ cells (gray, left image) with EPZ-5676–treated ALDH1+ cells that persist after 10 days EPZ-5676 (striped, right image). The decrease in ALDH1+ cells with treatment from 10% to 5% could result from ALDH1+ cell death or differentiation to generate more ALDH1 progeny. F, ALDH1+ and ALDH1 468 cells were isolated after 468 treatment ± EPZ-5676 or DMSO for 10 days. Sorted cells were then plated into sphere assay with the drug or DMSO added once at seeding. Spheres ≥ 75 μm were counted at 12–14 days, and mean numbers ± SEM were plotted. Total drug exposure was 10 + 3 days or approximately 13 days. G, ALDH1+ and ALDH1 468 cells were isolated after 468 treatment ± EPZ-5676 or DMSO for 10 days and levels of DOT1L, cMyc, and global H3K79me2 assayed by Western blots. H, SUM149 cells were treated with EPZ-5676 or DMSO for 10 days and FACS isolated into ALDH1+ and ALDH1 cells. Sorted cells were plated into sphere assay with drug/DMSO added at seeding, and spheres were counted at 12–14 days. Mean number of spheres is plotted with ± SEM. All assays were performed in three biological repeat sorts with three technical replicates within each assay and mean is graphed with ± SEM. Student t test compares each drug condition to DMSO controls: *, P ≤ 0.05; **, P ≤ 0.01.
Figure 5. DOT1L inhibition downregulates gene profiles of oxidative phosphorylation, cell division, and WNT pathway specifically in ALDH1+ cells. RNA-seq was performed in three independent biological ALDH1+ and ALDH1− cell populations collected after 10 days of treatment with DMSO or 0.5 μmol/L EPZ-5676. A, GSEA plots representing the three most significantly enriched clusters in 468 ALDH1+ cells vs. ALDH1− populations. B, Gene profiles overrepresented in ALDH1+ vs. ALDH1− cells, with respective FDR/q values and normalized enrichment scores of data graphed in A and Supplementary Fig. S3A. C, GO analysis for genes upregulated (fold change ≥ 2; q ≤ 0.05) in both EPZ-5676–treated ALDH1+ and ALDH1− populations compared with respective DMSO controls. D, WIKI/KEGG pathway analysis of the downregulated genes (fold change ≤ 0.7; q ≤ 0.05) in drug-treated vs. control cells. Gray highlighted pathways are significantly downregulated in EPZ-5676–treated ALDH1+ cells (q ≤ 0.05) but not in drug-treated ALDH1− cells (q = 1). E, GSEA comparing EPZ-5676–treated ALDH1+ vs. DMSO-treated ALDH1+ cells shows gene sets downregulated by treatment. F, Venn diagram displays genes whose expression is either commonly or differently altered by EPZ-5676 (EPZ) treatment in isolated ALDH1+ and ALDH1− populations compared with their respective DMSO controls: 547 genes were uniquely upregulated and 496 genes were uniquely downregulated in drug-treated ALDH1+ cells; 322 genes were uniquely upregulated and 343 genes were uniquely downregulated in response to drug in ALDH1− cells. G, GO analysis for genes significantly upregulated only in drug-treated ALDH1+ cells (547 genes). Biological processes shown with FDR q ≤ 0.05. H, GO analysis for genes significantly downregulated only in drug-treated ALDH1+ cells (496 genes). Biological processes shown with FDR q ≤ 0.05. I, qPCR gene expression of SOX11, ALDH1A1, and RARRES1 in drug- or DMSO-treated ALDH1− (left) and ALDH1+ populations (right). ***, P ≤ 0.001. See also Supplementary Fig. S3.
Figure 5.
DOT1L inhibition downregulates gene profiles of oxidative phosphorylation, cell division, and WNT pathway specifically in ALDH1+ cells. RNA-seq was performed in three independent biological ALDH1+ and ALDH1 cell populations collected after 10 days of treatment with DMSO or 0.5 μmol/L EPZ-5676. A, GSEA plots representing the three most significantly enriched clusters in 468 ALDH1+ cells vs. ALDH1 populations. B, Gene profiles overrepresented in ALDH1+ vs. ALDH1 cells, with respective FDR/q values and normalized enrichment scores of data graphed in A and Supplementary Fig. S3A. C, GO analysis for genes upregulated (fold change ≥ 2; q ≤ 0.05) in both EPZ-5676–treated ALDH1+ and ALDH1 populations compared with respective DMSO controls. D, WIKI/KEGG pathway analysis of the downregulated genes (fold change ≤ 0.7; q ≤ 0.05) in drug-treated vs. control cells. Gray highlighted pathways are significantly downregulated in EPZ-5676–treated ALDH1+ cells (q ≤ 0.05) but not in drug-treated ALDH1 cells (q = 1). E, GSEA comparing EPZ-5676–treated ALDH1+ vs. DMSO-treated ALDH1+ cells shows gene sets downregulated by treatment. F, Venn diagram displays genes whose expression is either commonly or differently altered by EPZ-5676 (EPZ) treatment in isolated ALDH1+ and ALDH1 populations compared with their respective DMSO controls: 547 genes were uniquely upregulated and 496 genes were uniquely downregulated in drug-treated ALDH1+ cells; 322 genes were uniquely upregulated and 343 genes were uniquely downregulated in response to drug in ALDH1 cells. G, GO analysis for genes significantly upregulated only in drug-treated ALDH1+ cells (547 genes). Biological processes shown with FDR q ≤ 0.05. H, GO analysis for genes significantly downregulated only in drug-treated ALDH1+ cells (496 genes). Biological processes shown with FDR q ≤ 0.05. I, qPCR gene expression of SOX11, ALDH1A1, and RARRES1 in drug- or DMSO-treated ALDH1 (left) and ALDH1+ populations (right). ***, P ≤ 0.001. See also Supplementary Fig. S3.
Figure 6. EPZ-5676 treatment decreases TISC abundance, tumor growth, and metastasis in ALDH1+ cell xenografts in vivo. A, Unsorted 468-luc cells pretreated with EPZ-5676 or DMSO for 10 days were orthotopically injected into mammary fat pad of NSG mice and then mice were treated with 50 mg/kg EPZ-5676 or vehicle via intraperitoneal injections every alternate day for six doses. Final tumor volumes at sacrifice are graphed. ***, P = 0.00053. B, Tumor formation from limiting dilutions of 10 ALDH1+ cells compared with 10 ALDH1− cells and 50 ALDH1+ cells compared with 50 ALDH1− cells is graphed as % tumor-free mice over time. C, Tumor formation in mice and TISC frequency was calculated using L-Calc limiting dilution software (STEMCELL Technologies) comparing control DMSO ALDH1+ with DMSO ALDH1− mice groups. D, Tumor formation in mice injected with 10 EPZ-5676–treated ALDH1+ cells compared with 10 DMSO-treated ALDH1+ cells and 50 EPZ-5676–treated ALDH1+ cells compared with 50 DMSO controls is graphed as % tumor-free mice over weeks. E, Tumor formation and TISC frequency are tabulated for the drug-treated ALDH1+ mice group and the vehicle control ALDH1+ group (top) and for drug-treated ALDH1− cell–injected mice and control ALDH1− cell–injected mice. F, Tumor growth is plotted as mean tumor bioluminescence over time in mice injected with 5,000 EPZ-5676–treated or vehicle-treated ALDH1+ and ALDH1− cells. G, Mean final tumor volumes from 5,000 cell injection groups at sacrifice are graphed ± SEM. Control ALDH1+ tumors vs. control ALDH1− **, P = 0.01; EPZ-5676 ALDH1+ tumors vs. DMSO control ALDH1+ ***, P = 0.0009. H, Tumors from mice injected with 5,000 EPZ-5676 (EPZ) or vehicle–treated ALDH1+ cells were excised at sacrifice, digested into single cells and analyzed for % ALDH1+ cells and graphed as % max ALDH1+ cells ± SEM. ***, P = 0.00012. I, Primary orthotopic tumor sites in mice injected with 5,000 EPZ- or vehicle-treated ALDH1+ cells were covered, and bioluminescence from metastasis outside the primary tumor bed was measured. **, P = 0.01. J, Representative images of lung metastasis imaged ex vivo at the time of sacrifice. The signal bioluminescence is indicated in the side bar.
Figure 6.
EPZ-5676 treatment decreases TISC abundance, tumor growth, and metastasis in ALDH1+ cell xenografts in vivo. A, Unsorted 468-luc cells pretreated with EPZ-5676 or DMSO for 10 days were orthotopically injected into mammary fat pad of NSG mice and then mice were treated with 50 mg/kg EPZ-5676 or vehicle via intraperitoneal injections every alternate day for six doses. Final tumor volumes at sacrifice are graphed. ***, P = 0.00053. B, Tumor formation from limiting dilutions of 10 ALDH1+ cells compared with 10 ALDH1 cells and 50 ALDH1+ cells compared with 50 ALDH1 cells is graphed as % tumor-free mice over time. C, Tumor formation in mice and TISC frequency was calculated using L-Calc limiting dilution software (STEMCELL Technologies) comparing control DMSO ALDH1+ with DMSO ALDH1 mice groups. D, Tumor formation in mice injected with 10 EPZ-5676–treated ALDH1+ cells compared with 10 DMSO-treated ALDH1+ cells and 50 EPZ-5676–treated ALDH1+ cells compared with 50 DMSO controls is graphed as % tumor-free mice over weeks. E, Tumor formation and TISC frequency are tabulated for the drug-treated ALDH1+ mice group and the vehicle control ALDH1+ group (top) and for drug-treated ALDH1 cell–injected mice and control ALDH1 cell–injected mice. F, Tumor growth is plotted as mean tumor bioluminescence over time in mice injected with 5,000 EPZ-5676–treated or vehicle-treated ALDH1+ and ALDH1 cells. G, Mean final tumor volumes from 5,000 cell injection groups at sacrifice are graphed ± SEM. Control ALDH1+ tumors vs. control ALDH1 **, P = 0.01; EPZ-5676 ALDH1+ tumors vs. DMSO control ALDH1+ ***, P = 0.0009. H, Tumors from mice injected with 5,000 EPZ-5676 (EPZ) or vehicle–treated ALDH1+ cells were excised at sacrifice, digested into single cells and analyzed for % ALDH1+ cells and graphed as % max ALDH1+ cells ± SEM. ***, P = 0.00012. I, Primary orthotopic tumor sites in mice injected with 5,000 EPZ- or vehicle-treated ALDH1+ cells were covered, and bioluminescence from metastasis outside the primary tumor bed was measured. **, P = 0.01. J, Representative images of lung metastasis imaged ex vivo at the time of sacrifice. The signal bioluminescence is indicated in the side bar.
Figure 7. Treatment with EPZ-5676 decreases TNBC PDX tumor growth in vivo and organoid colony formation. A, TNBC PDX HCI-001 pieces were implanted into 5 NSG mice and mice received EPZ-5676 or vehicle treatment over 5 weeks via i.p. injections daily. Tumor growth is plotted as measured by caliper over time. Statistical analysis of growth curve with P value is indicated. B, Mean final tumor volume measured by caliper at sacrifice in mice injected with PDX HCI-001 is graphed ± SEM. EPZ-treated tumor vs. DMSO control P = 0.04. C, Number of micrometastatic lung lesions from PDX HCI-001 in vehicle- and EPZ-treated mice are graphed and representative images are shown below with arrows pointing to the lung lesion. D, Tumors from mice injected with PDX HCI-001 were excised at sacrifice, digested into single cells, and analyzed for % ALDH1+ cells. Normalized % max ALDH1+ cells are graphed ± SEM. P = 0.005. E, Tumors from mice injected with PDX HCI-001 were excised at sacrifice, digested into single cells, and plated into sphere assay. Number of spheres from EPZ-5676– or vehicle-treated tumors is graphed ± SEM. P = 0.00005. F, TNBC PDX-derived organoids were digested into 3–10 cell clusters and seeded with different concentrations of EPZ-5676 or DMSO for 14 days and allowed to grow colonies. The percentage of colony formation for EPZ-5676–treated compared with DMSO control is plotted. P = 0.0003. G, TNBC PDX-derived organoids were digested into 3–10 cell clusters and seeded to form colonies with EPZ-5676 or DMSO treatment for 12 days. Colonies were recovered, digested, and reseeded with DMSO for 12 days, and colonies were counted as described in the Materials and Methods section. Normalized colony counts in pretreatment with EPZ-5676 at different concentrations as compared with DMSO control are graphed. P < 0.0001. H, Representative images of colonies in DMSO control and EPZ-5676 treated samples derived from TNBC PDX organoids.
Figure 7.
Treatment with EPZ-5676 decreases TNBC PDX tumor growth in vivo and organoid colony formation. A, TNBC PDX HCI-001 pieces were implanted into 5 NSG mice and mice received EPZ-5676 or vehicle treatment over 5 weeks via i.p. injections daily. Tumor growth is plotted as measured by caliper over time. Statistical analysis of growth curve with P value is indicated. B, Mean final tumor volume measured by caliper at sacrifice in mice injected with PDX HCI-001 is graphed ± SEM. EPZ-treated tumor vs. DMSO control P = 0.04. C, Number of micrometastatic lung lesions from PDX HCI-001 in vehicle- and EPZ-treated mice are graphed and representative images are shown below with arrows pointing to the lung lesion. D, Tumors from mice injected with PDX HCI-001 were excised at sacrifice, digested into single cells, and analyzed for % ALDH1+ cells. Normalized % max ALDH1+ cells are graphed ± SEM. P = 0.005. E, Tumors from mice injected with PDX HCI-001 were excised at sacrifice, digested into single cells, and plated into sphere assay. Number of spheres from EPZ-5676– or vehicle-treated tumors is graphed ± SEM. P = 0.00005. F, TNBC PDX-derived organoids were digested into 3–10 cell clusters and seeded with different concentrations of EPZ-5676 or DMSO for 14 days and allowed to grow colonies. The percentage of colony formation for EPZ-5676–treated compared with DMSO control is plotted. P = 0.0003. G, TNBC PDX-derived organoids were digested into 3–10 cell clusters and seeded to form colonies with EPZ-5676 or DMSO treatment for 12 days. Colonies were recovered, digested, and reseeded with DMSO for 12 days, and colonies were counted as described in the Materials and Methods section. Normalized colony counts in pretreatment with EPZ-5676 at different concentrations as compared with DMSO control are graphed. P < 0.0001. H, Representative images of colonies in DMSO control and EPZ-5676 treated samples derived from TNBC PDX organoids.

References

    1. Tannock IF, Hill RP, Carey RW. The basic science of oncology. Plast Reconstr Surg 1989;83:920.
    1. Gottesman MM, Fojo T, Bates SE. Multidrug resistance in cancer: role of ATP–dependent transporters. Nat Rev Cancer 2002;2:48–58. - PubMed
    1. Vitale I, Manic G, De Maria R, Kroemer G, Galluzzi L. DNA damage in stem cells. Mol Cell 2017;66:306–19. - PubMed
    1. Wulf GG, Wang RY, Kuehnle I, Weidner D, Marini F, Brenner MK, et al. . A leukemic stem cell with intrinsic drug efflux capacity in acute myeloid leukemia. Blood 2001;98:1166–73. - PubMed
    1. Frank NY, Margaryan A, Huang Y, Schatton T, Waaga-Gasser AM, Gasser M, et al. . ABCB5-mediated doxorubicin transport and chemoresistance in human malignant melanoma. Cancer Res 2005;65:4320–33. - PubMed

Publication types

MeSH terms

Substances