. 2022 Mar 30;42(13):2614-2630.
doi: 10.1523/JNEUROSCI.1695-21.2022. Epub 2022 Feb 8.

Morphology and Dendrite-Specific Synaptic Properties of Midbrain Neurons Shape Multimodal Integration

Affiliations

Morphology and Dendrite-Specific Synaptic Properties of Midbrain Neurons Shape Multimodal Integration

S Weigel et al. J Neurosci. .

Abstract

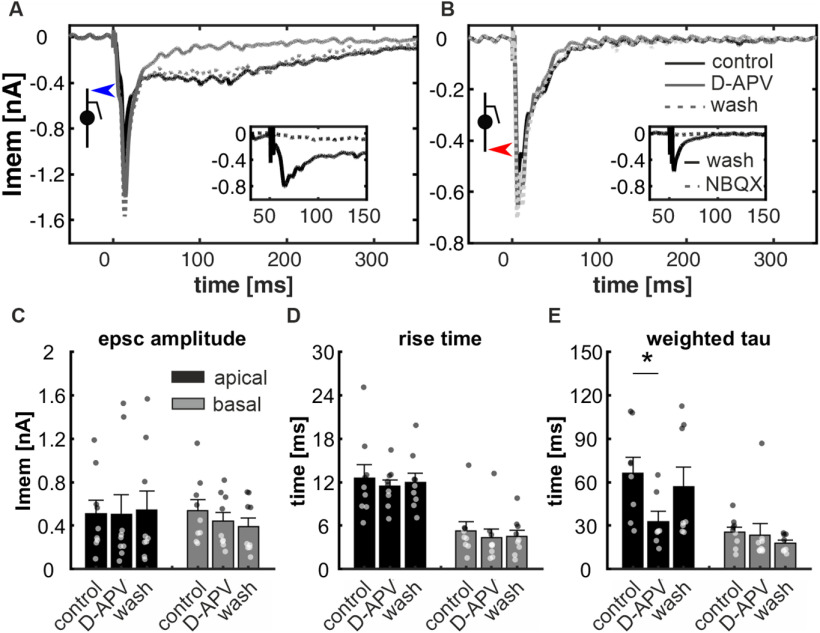
Multimodal integration facilitates object recognition and response to sensory cues. This depends on spatiotemporal coincidence of sensory information, recruitment of NMDA-type glutamate receptors and inhibitory feedback. Shepherd's crook neurons (SCNs) in the avian optic tectum (TeO) are an ideal model for studying cellular mechanism of multimodal integration. They receive different sensory modalities through spatially segregated dendrites, are important for stimulus selection and have an axon-carrying dendrite (AcD). We performed whole-cell patch-clamp experiments in chicken midbrain slices of both sexes. We emulated visual and auditory input in vitro by stimulating presynaptic afferents electrically. Simultaneous stimulation enhanced responses inversely depending on stimulation amplitude demonstrating the principle of inverse effectiveness. Contribution of NMDA-type glutamate receptors prolonged postsynaptic events for visual inputs only, causing a strong modality-specific difference in synaptic efficacy. We designed a multicompartment model to study the effect of morphological and physiological parameters on multimodal integration by varying the distance between soma and axonal origin and the amount of NMDA receptor (NMDAR) contribution. These parameters changed the preference of the model for one input channel and adjusted the range of input rates at which multimodal enhancement occurred on naturalistic stimulation. Thus, the unique morphology and synaptic features of SCNs shape the integration of input at different dendrites and generates an enhanced multimodal response.SIGNIFICANCE STATEMENT Multimodal integration improves perception and responses to objects. The underlying cellular mechanism depends on a balance between excitation and inhibition, and NMDA-type glutamate receptors that are involved in the multiplicative nature of enhancement following the principle of inverse effectiveness. Based on a detailed analysis of an identified multimodal cell type in the vertebrate midbrain, we studied the influence of cellular morphology and unimodal synaptic properties on multimodal integration. We can show that the combination of cellular morphology and modality-specific synaptic properties including NMDA receptor (NMDAR) contribution is optimal for nonlinear, multimodal enhancement and determines the dynamic response range of the integrating neuron. Our findings mechanistically explain how synaptic properties and cellular morphology of a midbrain neuron contribute to multimodal enhancement.

Keywords: NMDA; dendrite; midbrain; morphology; multimodal; tectum.


Figures

Figure 1.
Figure 1.
A, Intracellular labeled SCN (filled with Lucifer yellow) and positioning of stimulus electrodes. The axon origin on the apical dendrite is marked by an arrow. Borders of the tectal layers are indicated on the right. One stimulus electrode was positioned in layers 1–4 (blue asterisk) and a second stimulus electrode in layer 13 (red asterisk). Scale bar: 100 µm. B, Two exemplary whole-cell patch-clamp responses of SCN to different holding currents: (Bi) phasic response and (Bii) tonic response. Currents were applied as a step protocol starting at t = 0 ms ranging from −100 to 200 pA with 50 pA increase. C–J, Quantification of physiological parameters for phasic and tonic firing SCNs determined in current-clamp experiments. Bar plots of membrane time constant taumem (C), input resistance Rmem (D), resting membrane potential Vrest (E), maximal number of evoked APs (F), minimal applied current necessary to evoke APs Ithresh (G), latency of the first evoked AP at Ithresh (H), half-maximal width of these APs (I), and their amplitude (J). Data are plotted as mean ± SEM; n = 16 (phasic) and n = 11 (tonic), asterisk indicate p < 0.05 (two-sided Wilcoxon rank-sum test). Individual data of each neuron is plotted as dots on the corresponding bars.
Figure 2.
Figure 2.
Unimodal suprathreshold activation of SCNs did not lead to significant bimodal enhancement. A–C, Responses of an exemplary SCN to unimodal electrical stimulation in layer 1–4 (A), layer 13 (B), and simultaneous applied stimuli on both stimulation sites (C; each showing 5 repetitions). The insets show responses at higher temporal magnification to discriminate response and stimulus artifact. D–G, Quantification of response parameters: duration (D), mean number of evoked APs per trial (E), reliability of evoked APs (F), and latency (signal first time above a threshold, G). Bar plots show mean ± SEM (n = 10); asterisk indicate p < 0.05 (Kruskal–Wallis test with Tukey–Kramer post hoc test). Values of each neuron (mean of 5 repetitions) are plotted as dots on the corresponding bars.
Figure 3.
Figure 3.
Unimodal subthreshold activation of SCNs led to nonlinear multimodal enhancement. A–C, Responses of an exemplary SCN to subthreshold unimodal electrical stimulation in layer 1–4 (A), layer 13 (B), and simultaneous applied subthreshold stimuli on both stimulation electrodes (C; each showing five repetitions). The insets show responses at higher temporal magnification to discriminate response and stimulus artifact. D–G, Quantification of response parameters: duration (D), mean number of evoked APs per trial (E), reliability to evoke APs (F), and latencies (G). Bar plots show mean ± SEM (n = 10), asterisk indicate p < 0.05 (Kruskal–Wallis test with Tukey–Kramer post hoc test). Values of each neuron (mean of 5 repetitions) are plotted as dots on the corresponding bars.
Figure 4.
Figure 4.
Dependency of postsynaptic response on stimulus amplitude. Exemplary voltage-clamp recordings of a neuron with intracellularly applied voltage-gated sodium channel blocker QX-314 show evoked postsynaptic currents to electrical pulses (50–200 µA) applied to layer 1–4 (A) or to layer 13 (B; stimulus paradigm indicated by blue or red arrow). Increasing gray values indicate stronger stimuli (light gray: 50 µA; black: 200 µA). C–H, Bar plots of EPSC amplitude (C), duration (D), latency (E), reliability (F), rise time (G), and weighted tau (H) in dependence of stimulus amplitude and stimulus location (black = apical stimulation, gray = basal stimulation). Data are plotted as mean ± SEM; n = 16, asterisk indicate p < 0.05 (two-sided Wilcoxon rank-sum test). Mean values of each neuron (5 repetitions) are plotted as dots on the corresponding bars.
Figure 5.
Figure 5.
Effect of NMDAR antagonist D-APV on postsynaptic currents. Exemplary voltage-clamp recordings of a neuron with intracellularly applied voltage-gated sodium channel blocker QX-314 showing evoked postsynaptic currents to electrical pulses (mean of five repetitions, constant stimulus intensity) applied to layer 1–4 (A) or to layer 13 (B; stimulus paradigm indicated by blue or red arrow). Neurons were stimulated under control conditions (black line), application of D-APV for 15 min (light gray line) or after wash out for 15 min (dotted line). Insets A, B, Block of synaptically evoked potentials by NBQX application (dotted line) following the wash-out of D-APV (black line, n = 4). CE, Bar plots of EPSC amplitude (C), rise time (D), and weighted tau (E) in dependence of pharmacological condition and stimulus location (black = apical stimulation, gray = basal stimulation). Data are plotted as mean ± SEM; n = 9, asterisk indicate p < 0.05 (Kruskal–Wallis test with Tukey–Kramer post hoc test). Mean values of each neuron (5 repetitions) are plotted as dots on the corresponding bars.
Figure 6.
Figure 6.
Signal propagation in SCNs. A–C, False-color plots of the normalized response of SCN to apical (A), basal (B), and simultaneous stimulation (C) at different time points (upper right corner of each subplot) relative to the mean peak-amplitude (apical n = 5, basal n = 6, and simultaneous n = 19). APs were peak-aligned to the mean signal form averaged over all pixels exhibiting a signal higher than noise. Schematics in the left panels (left) show the stimulus condition. The second schematic in A, left panel, depicts the probable recording area (without axon). Scale bar: 50 µm; color bar: 0 (blue) to 1.2 (red). D1–F1, False-color plot of the temporal occurrence of the signal maximum at different pixels relative to the mean peak-amplitude (D1: apical, E1; basal, F1: simultaneous stimulation; color bar: −1.5–1 ms; scale bar: 50 µm) and plot of the corresponding data derived from pixels (mean of three pixels in Y and X direction) along the longitudinal axis of SCN (D2–F2; axis marked in D1–F1). The slope of the fitted line is equivalent to the propagation velocity. A positive propagation velocity represents a spread from apical to basal. G, Summary of the propagation velocity for several neurons (apical: n = 7, basal: n = 10, simultaneous: n = 3). Data are plotted as mean ± SEM and were tested for significance by a Kruskal–Wallis test with Tukey–Kramer post hoc test.
Figure 7.
Figure 7.
Performance of the SCN model in simulated in vitro experiments. A, Cartoon of the SCN model generated in NEURON. Blue lines indicate apical, visual connectivity. Red lines indicate basal, auditory connectivity. Dashed lines indicate inhibitory connections. aDend = distal apical dendrite; pNeurite = primary neurite; AIS = axon initial segment; Vm = measurement of the membrane potential; pbDend = proximal basal dendrite; bDend = distal basal dendrite. B–D, Simulated current-clamp responses on deterministic activation of apical (B), basal (C), and simultaneous apical + basal (D) excitatory inputs, as indicated by the inset depictions of the SCN. Simulations shown here run without feed-forward inhibition. Inset plots show phase-plane plots of the rate of change of Vm versus Vm. Green arrows in phase-plane plots indicate threshold rate at which AP generation was detected. E, Voltage threshold of AP activation, as determined from the phase-plane plots in B–D, plotted against total synaptic conductance gsyn. For “apical,” “basal,” and “apical/-NMDA” conditions, the total gsyn was distributed over N = 25 apical or N = 25 basal synapses. For the multimodal conditions (“apical+basal,” “apical+basal/-NMDA”) gsyn was distributed over N = 25 apical + N = 25 basal → N = 50 synaptic contacts. F, Time of maximal membrane potential deflection for “apical” (blue), “basal” (red), and “apical+basal” (black) activation of inputs, normalized to the time of first maximal potential deflection, plotted against spatial position on the primary neurite compartment. Dashed circles mark the location with minimal time delay of maximal membrane potential deflection, i.e., the site of impulse initiation.
Figure 8.
Figure 8.
Superadditive multimodal enhancement with inverse effectiveness shown in the SCN model. A–C, For apical (A), basal (B), and multimodal (C) stochastic activation of inputs the responses to 125 ms stimulations are shown. Onset of virtual stimuli are marked with arrow (=0 ms), virtual pathway delay (visual: 50 ms; auditory: 20 ms) depicted by dashed gray bar, effective stimulus duration at level of the simulated cell shown by horizontal bars (visual: blue; auditory: red; multimodal: black). A single exemplary Vm trace (lower part of A1–C1), a rasterplot showing spike-times from n = 50 repetitions (middle part of A1–C1) and a peristimulus time histogram of the responses (upper part of A1–C1) is shown. Mean ± SD number of AP generated (A2–C2) and the mean ± SD first-spike latency (A3–C3) for the range of input rates we chose are shown. Dashed line in B2: data resimulated with basal synapses located at the apical dendrite. Dashed black line in C2: multimodal response with all synapses located at apical dendrite. Green line in C2 indicates the sum of unimodal responses from A2, B2. Dashed green line in C2 indicates sum of unimodal responses with all synapses located at apical dendrite. Blue and red lines in C3 are mean first spike latencies replotted from A3, B3 for comparison. D, Quantification of the multimodal enhancement in increase of the mean ± SD number of AP over the sum of unimodal responses versus input power (i.e., percentage of the range of input rates we chose). Gray dashed line indicates no enhancement (multimodal = sum of unimodal), red circle and vertical line marks condition of maximal enhancement. Dashed black line, Quantification of multimodal enhancement of responses with all synapses located at the apical dendrite. E, Temporal interaction window of apical and basal inputs quantified as the amount of enhancement at 20% input power (visual: 41 Hz; auditory: 103 Hz) for different basal onset times relative to a fixed apical onset time. Gray dashed lines indicate 0 s and no enhancement (as in D), red marker and vertical line indicate relative basal onset time with maximal enhancement. F, Enhancement quantified as the increase of the mean ± SD number of AP over sum of unimodal responses for different distances to the virtual stimulus source in meter, for different combinations of input powers: blue = weak visual/weak auditory; green = strong visual/weak auditory; orange = weak visual/strong auditory; red = strong visual/strong auditory. Input powers were: weak visual = 41.0 Hz, strong visual = 60.0 Hz, weak auditory = 103.0 Hz, strong auditory = 300.0 Hz. Circular markers indicate conditions where responses are significantly different (ANOVA and Bonferroni-corrected post hoc t test) from the strong/strong condition. Dashed gray areas mark conditions not significantly different from each other (see text). G, Mean ± SD of first-spike latencies for different distances to the virtual stimulus source in meter for different combinations of input powers, expressed relative to strong visual unimodal mean first spike latency. Presentation as in F except circular markers here indicate conditions where mean first spike latencies are significantly different (ANOVA and Bonferroni-corrected post hoc t test) from the strong visual unimodal condition.
Figure 9.
Figure 9.
SCN-specific cellular features tune the effectiveness of multimodal enhancement to the input power in the SCN model. Data simulated as in Figure 8 but for varying pNeurite length (A–E) and apical decay time constants (F–J) shown as 2D plots with input power on the x-axis and the varied cellular parameter on the y-axis. Color code shows mean number of AP or, for E, J, AP increase over the sum of unimodal responses. A, F, Mean number of AP on apical unimodal stimulation per repetition color coded in shades of blue (dark blue = highest AP count) for many stimulus powers (x-axis) and pNeurite lengths (y-axis, A) or apical decay time constants (y-axis, F). Superimposed interpolated contours (contour function of matplotlib) were derived from the same data as shown in the colormesh in steps of 10 AP/repetition. B, G, Mean number of AP on basal unimodal stimulation per repetition color coded in shades of red (dark red = highest AP count), presentation as in A. C, H, Mean number of AP on multimodal stimulation per repetition color coded in shades of gray (white = highest AP count). Presentation as in A. D, I, Sum of unimodal responses from A, B and F, G, color coded in shades of green (dark green = highest sum), presentation as in A. E, J, Amount of multimodal enhancement as the difference between C, D and H, I, color coded in seismic colors (white = no difference, shades of red positive differences, shades of blue negative differences). Presentation otherwise as in A.

References

    1. Angelaki DE, Gu Y, DeAngelis GC (2009) Multisensory integration: psychophysics, neurophysiology, and computation. Curr Opin Neurobiol 19:452–458. 10.1016/j.conb.2009.06.008 - DOI - PMC - PubMed
    1. Asadollahi A, Mysore SP, Knudsen EI (2010) Stimulus-driven competition in a cholinergic midbrain nucleus. Nat Neurosci 13:889–895. 10.1038/nn.2573 - DOI - PMC - PubMed
    1. Binns KE, Salt TE (1996) Importance of NMDA receptors for multimodal integration in the deep layers of the cat superior colliculus. J Neurophysiol 75:920–930. 10.1152/jn.1996.75.2.920 - DOI - PubMed
    1. Bradley J, Luo R, Otis TS, DiGregorio DA (2009) Submillisecond optical reporting of membrane potential in situ using a neuronal tracer dye. J Neurosci 29:9197–9209. 10.1523/JNEUROSCI.1240-09.2009 - DOI - PMC - PubMed
    1. Chanda B, Blunck R, Faria LC, Schweizer FE, Mody I, Bezanilla F (2005) A hybrid approach to measuring electrical activity in genetically specified neurons. Nat Neurosci 8:1619–1626. 10.1038/nn1558 - DOI - PubMed

Publication types

Substances

LinkOut - more resources