. 2022 Feb 15;119(7):e2108349119.
doi: 10.1073/pnas.2108349119.

Nitric oxide stimulates type IV MSHA pilus retraction in Vibrio cholerae via activation of the phosphodiesterase CdpA

Affiliations

Nitric oxide stimulates type IV MSHA pilus retraction in Vibrio cholerae via activation of the phosphodiesterase CdpA

Hannah Q Hughes et al. Proc Natl Acad Sci U S A. .

Abstract

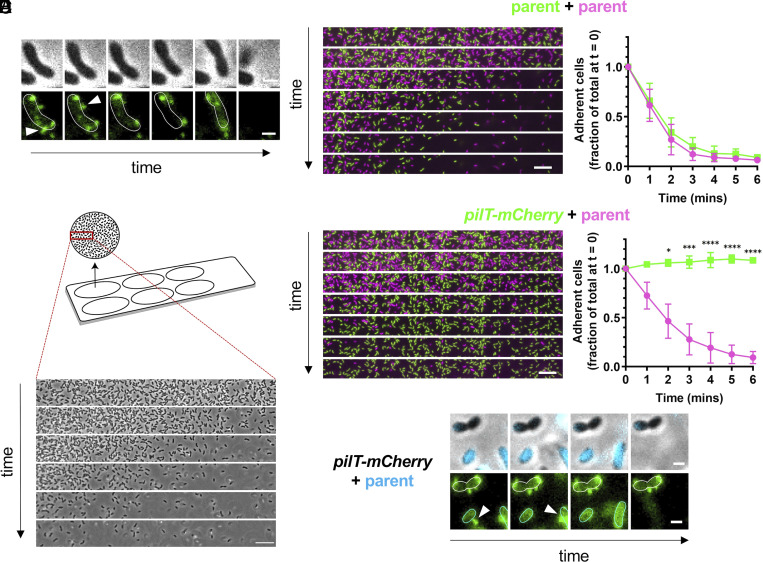
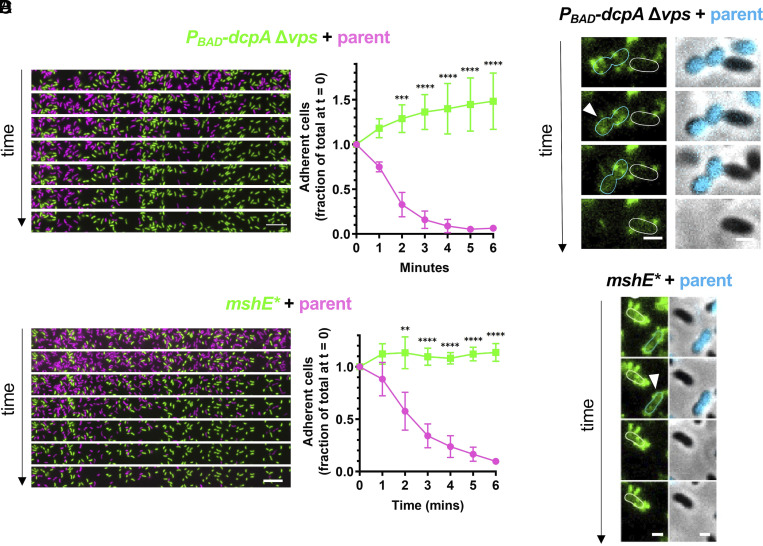
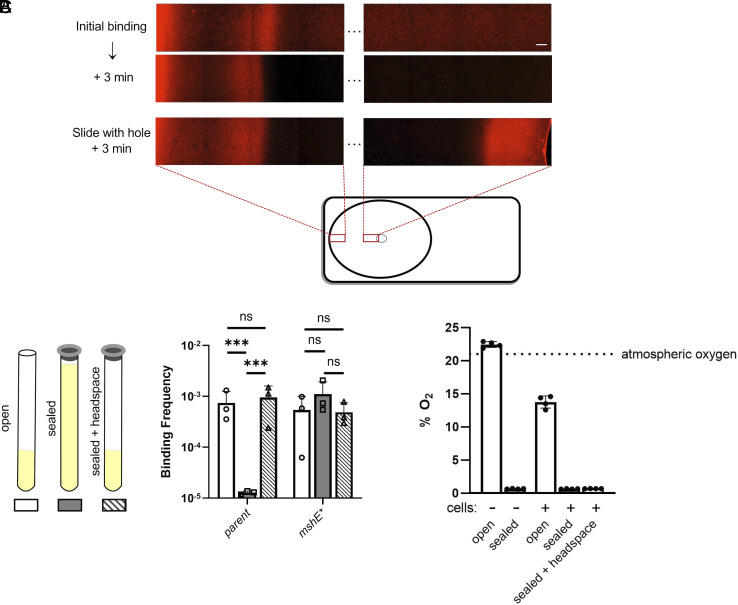
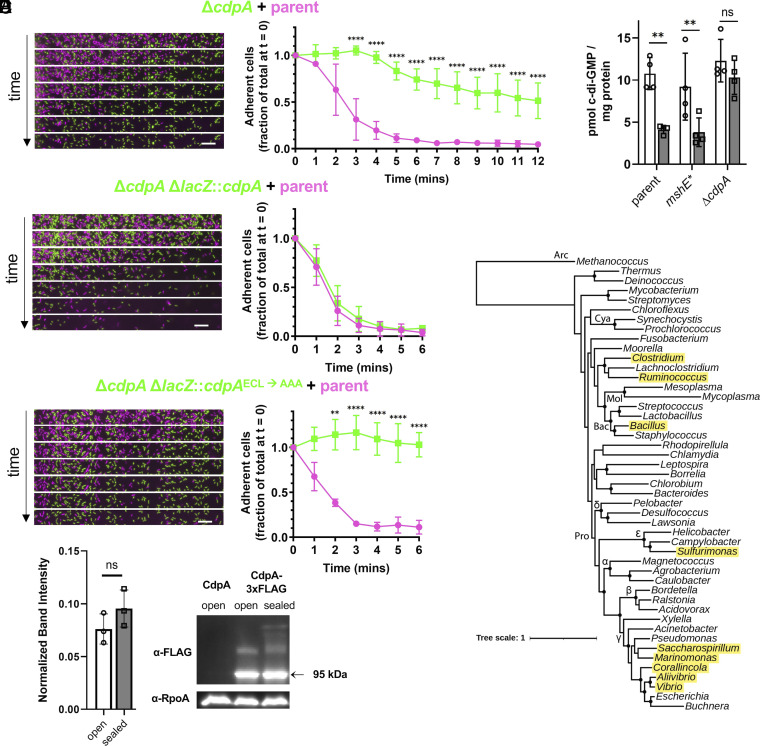
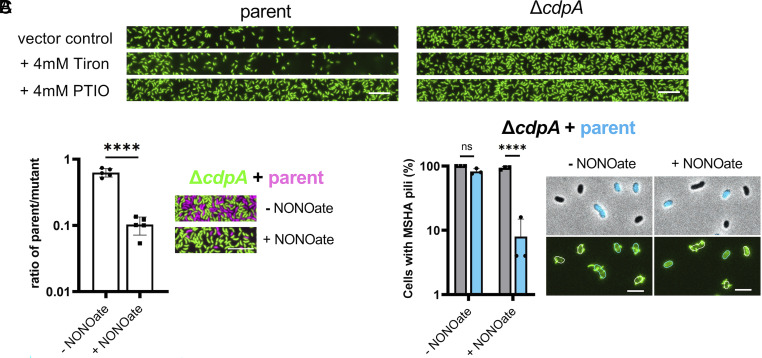
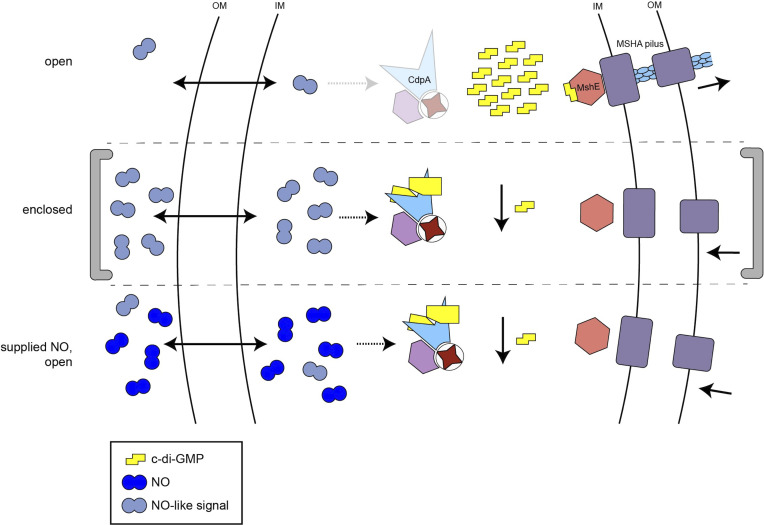
Bacteria use surface appendages called type IV pili to perform diverse activities including DNA uptake, twitching motility, and attachment to surfaces. The dynamic extension and retraction of pili are often required for these activities, but the stimuli that regulate these dynamics remain poorly characterized. To address this question, we study the bacterial pathogen Vibrio cholerae, which uses mannose-sensitive hemagglutinin (MSHA) pili to attach to surfaces in aquatic environments as the first step in biofilm formation. Here, we use a combination of genetic and cell biological approaches to describe a regulatory pathway that allows V. cholerae to rapidly abort biofilm formation. Specifically, we show that V. cholerae cells retract MSHA pili and detach from a surface in a diffusion-limited, enclosed environment. This response is dependent on the phosphodiesterase CdpA, which decreases intracellular levels of cyclic-di-GMP to induce MSHA pilus retraction. CdpA contains a putative nitric oxide (NO)-sensing NosP domain, and we demonstrate that NO is necessary and sufficient to stimulate CdpA-dependent detachment. Thus, we hypothesize that the endogenous production of NO (or an NO-like molecule) in V. cholerae stimulates the retraction of MSHA pili. These results extend our understanding of how environmental cues can be integrated into the complex regulatory pathways that control pilus dynamic activity and attachment in bacterial species.

Keywords: attachment; biofilm; type IV pili.


Conflict of interest statement

The authors declare no competing interest.

Figures

Fig. 1.
Fig. 1.
Cells rapidly detach from the surface of a glass well slide in a manner that is dependent on MSHA pilus retraction. (A) Representative montage illustrating that MSHA pilus retraction precedes cell detachment (Movie S1). Phase images (Top) show cell boundaries, and FITC channel (Bottom) images show AF488-mal labeled MSHA pili. White arrows indicate examples where pili retract prior to cell detachment. There are 10-s intervals between frames. Scale bar, 1 μm. (B) Diagram of experimental setup to observe cell detachment in a glass well slide (Top). Representative phase contrast images (Bottom) of cell detachment over time. There is a 1-min interval between frames. Scale bar, 10 μm. (C and D) MixD assays of the indicated strains. Cells expressed GFP (green) or mCherry (fuchsia) as indicated by the color-coded genotypes. Representative montages show time-lapse imaging (Left) with 1-min intervals between frames (Movies S2 and S3). Scale bar, 10 μm. The quantification of three biological replicates is shown in the line graph (Right) and is displayed as the mean ± SD. Statistical comparisons were made by one-way ANOVA and post hoc Holm-Šídák test. *P < 0.05, ***P < 0.001, ****P < 0.0001. (E) Representative montage shows the labeled fluorescent MSHA pili in a mixture of a pilT-mCherry strain and a CyPet-expressing parent strain (Movie S4). Phase contrast images with overlaid CyPet fluorescence in cyan (Top) distinguish the two strains, and FITC fluorescence images in green (Bottom) show AF488-mal labeled pili. Parent cells are outlined in cyan and pilT-mCherry cells are outlined in white. There are 20-s intervals between frames. Scale bar, 1μm. The PilT-mCherry construct does not exhibit detectable mCherry fluorescence in D and E.
Fig. 2.
Fig. 2.
Cell detachment is dependent on allosteric regulation of MshE activity by c-di-GMP. (A) MixD assay of PBAD-dcpA Δvps expressing GFP (green) and a parent strain expressing mCherry (fuchsia). PBAD-dcpA Δvps cells were induced with 0.15% arabinose. Representative montage shows time-lapse imaging (Left) with 1-min intervals between frames. Scale bar, 10 μm. The quantification of three biological replicates is shown in the line graph (Right) and is displayed as mean ± SD. Statistical comparisons were made by one-way ANOVA and post hoc Holm-Šídák test. **P < 0.01, ***P < 0.001, ****P < 0.0001. Scale bar, 10 μm. (B) MixD assay as in A of mshE* expressing GFP (green) and a parent strain expressing mCherry (fuchsia). (C) Representative montage shows time-lapse imaging of cells with AF488-mal-labeled MSHA pili. Cells represent a mixture of PBAD-dcpA Δvps cells and CyPet-expressing parent cells. PBAD-dcpA Δvps cells were induced with 0.15% arabinose as in A. Phase contrast images with overlaid CyPet fluorescence in cyan (Right) distinguish the mixed strains, and FITC fluorescence images in green (Left) show labeled pili. Parent cells are outlined in cyan, and PBAD-dcpA Δvps cells are outlined in white. White arrows indicate clear examples where pilus retraction precedes cell detachment. There are 20-s intervals between frames. Scale bar, 1 μm. (D) Representative montage shows time-lapse imaging of cells where pili are fluorescently labeled as in C. Cells represent a mixture of mshE* cells and parent cells expressing cyan fluorescent protein (CFP). Parent cells are outlined in cyan and mshE* cells are outlined in white.
Fig. 3.
Fig. 3.
Accumulation of a volatile signal promotes cell detachment. (A) Cell attachment was monitored in well slides by fluorescence microscopy with an mCherry-expressing parent strain. Wells either lacked (Top and Middle) or contained (Bottom) a hole in the center of the well, allowing for the open diffusion of volatiles. Five fields of view are omitted between the edge (Left) and center (Right) of the well. Scale bar, 50 μm. (B) Large-scale binding assays (Right) of cultures incubated in open tubes (“open”; white bars), an enclosed argon-flushed glass tube with low headspace (“sealed”; gray bars), or an enclosed argon-filled tube with abundant headspace (“sealed + headspace”; striped bars) (see diagram, Left). Data are from three independent biological replicates and shown as the mean ± SD. Statistical comparisons were made by one-way ANOVA and post hoc Holm-Šídák test. ***P < 0.001; ns, not significant. (C) Oxygen levels were measured under the same conditions used for B, using a noninvasive fiber optic oxygen meter. The initial % O2 (“cells -”) is indicated in the first two bars, and the % O2 after incubation with cells (“cells +”) is indicated in the remaining bars. Data are from four independent biological replicates and shown as the mean ± SD.
Fig. 4.
Fig. 4.
CdpA is a PDE that promotes cell detachment under sealed conditions. (AC) Show MixD assays of the indicated strains. Cells expressed GFP (green) or mCherry (fuchsia) as indicated by the color-coded genotypes. Complemented strains are denoted by ΔlacZ::cdpA, indicating that a copy of cdpA along with its native promoter were introduced at an ectopic site on the chromosome. Representative montages of time-lapse imaging (Left) display 1-min intervals between frames. Scale bar, 10 μm. Quantification of three biological replicates is shown in each line graph (Right). (D) Quantification of intracellular c-di-GMP concentrations in the indicated strains. Data are from four independent biological replicates. White bars represent samples from open tubes, while gray bars indicate samples from sealed tubes. (E) Representative Western blot (Right) and quantification (Left) were used to assess CdpA protein levels under open and sealed conditions. Band intensities are normalized to the RpoA loading control. Data are from three independent experiments. (F) Conservation of CdpA across bacterial species. The estimated maximum likelihood phylogeny of the indicated microbes is based on a concatenated alignment of 36 conserved proteins identified from whole-genome sequences. Genera with members that contain a CdpA homolog are highlighted in yellow. Major taxa are labeled along their nodes. Pro, Proteobacteria (Greek letters indicate subdivisions); Bac, Bacilli; Mol, Mollicutes; Cya, Cyanobacteria; Arc, Archaea. Scale bar indicates distance. All graphs display mean ± SD. Statistical comparisons were made by one-way ANOVA and post hoc Holm-Šídák test. **P < 0.01, ****P < 0.0001; ns, not significant.
Fig. 5.
Fig. 5.
Nitric oxide stimulates detachment in a CdpA-dependent manner. (A) Representative images of detachment of GFP-expressing parent or ΔcdpA strains after incubation with Tiron (4 mM), PTIO (4 mM), or dimethyl sulfoxide (DMSO) as a vector control. Scale bar, 10 μm. (B) Quantification (Left) of initial attachment for a 1:1 mixture of the mCherry-expressing parent strain (fuchsia) and GFP-expressing ΔcdpA mutant strain (green) when incubated in the presence or absence of 200 μM DEA-NONOate, as indicated. The ratio was determined by dividing the number of attached parent cells (fuchsia) by the number of attached mutant cells (green) as depicted in the representative image on the right. Data are from 5 independent experiments with at least 270 cells analyzed per replicate and are shown as the mean ± SD. The statistical comparison was made by Student’s t test. Scale bar, 10 μm. (C) Quantification (Left) of parent (blue) or ΔcdpA (gray) piliation after incubation in the presence or absence of 200 μM DEA-NONOate. Data are presented as the percent of cells that exhibited surface piliation. Data are from 3 independent experiments with at least 50 cells analyzed per replicate and are shown as the mean ± SD. Representative images (Right) of cells with AF488-mal-labeled MSHA pili. Cells represent a mixture of ΔcdpA cells and CyPet-expressing parent cells. Phase contrast images with overlaid CyPet fluorescence in cyan (Top) distinguish the mixed strains, and FITC fluorescence images in green (Bottom) show labeled pili. Parent cells are outlined in cyan and ΔcdpA cells are outlined in white. Scale bar, 3 μm. The statistical comparison was made by one-way ANOVA and post hoc Holm-Šídák test. ****P < 0.0001; ns, not significant.
Fig. 6.
Fig. 6.
Proposed model for CdpA-dependent induction of MSHA pilus retraction. Under open conditions (Top), volatiles (including the NO-like signal molecule) diffuse across the cell membrane and away from cells. CdpA remains inactive, and intracellular c-di-GMP levels stay elevated. This stimulates MshE activity, which causes the extension of MSHA pili and attachment of cells to a surface. Under sealed conditions (Middle), the NO-like signal accumulates. This signal, along with a potential cofactor (depicted in lavender), stimulate the PDE activity of CdpA. This decreases the intracellular concentration of c-di-GMP, prompting the retraction of MSHA pili and detachment of cells from the surface. Exogenously added NO (Bottom) can also diffuse into the cell and stimulate CdpA activity, resulting in decreased c-di-GMP, retraction of MSHA pili, and cell detachment. IM, inner membrane; OM, outer membrane.

Similar articles

Cited by

References

    1. Denise R., Abby S. S., Rocha E. P. C., Diversification of the type IV filament superfamily into machines for adhesion, protein secretion, DNA uptake, and motility. PLoS Biol. 17, e3000390. (2019). - PMC - PubMed
    1. Ellison C. K., et al. , Retraction of DNA-bound type IV competence pili initiates DNA uptake during natural transformation in Vibrio cholerae. Nat. Microbiol. 3, 773–780 (2018). - PMC - PubMed
    1. Merz A. J., So M., Sheetz M. P., Pilus retraction powers bacterial twitching motility. Nature 407, 98–102 (2000). - PubMed
    1. O’Toole G. A., Kolter R., Flagellar and twitching motility are necessary for Pseudomonas aeruginosa biofilm development. Mol. Microbiol. 30, 295–304 (1998). - PubMed
    1. Ellison C. K., et al. , Obstruction of pilus retraction stimulates bacterial surface sensing. Science 358, 535–538 (2017). - PMC - PubMed

MeSH terms

LinkOut - more resources