. 2022 Aug 5;71(3):288-304.
doi: 10.1538/expanim.21-0191. Epub 2022 May 8.

The C-type lectin receptor Clec1A plays an important role in the development of experimental autoimmune encephalomyelitis by enhancing antigen presenting ability of dendritic cells and inducing inflammatory cytokine IL-17

Affiliations

The C-type lectin receptor Clec1A plays an important role in the development of experimental autoimmune encephalomyelitis by enhancing antigen presenting ability of dendritic cells and inducing inflammatory cytokine IL-17

Yulia Makusheva et al. Exp Anim. .

Abstract

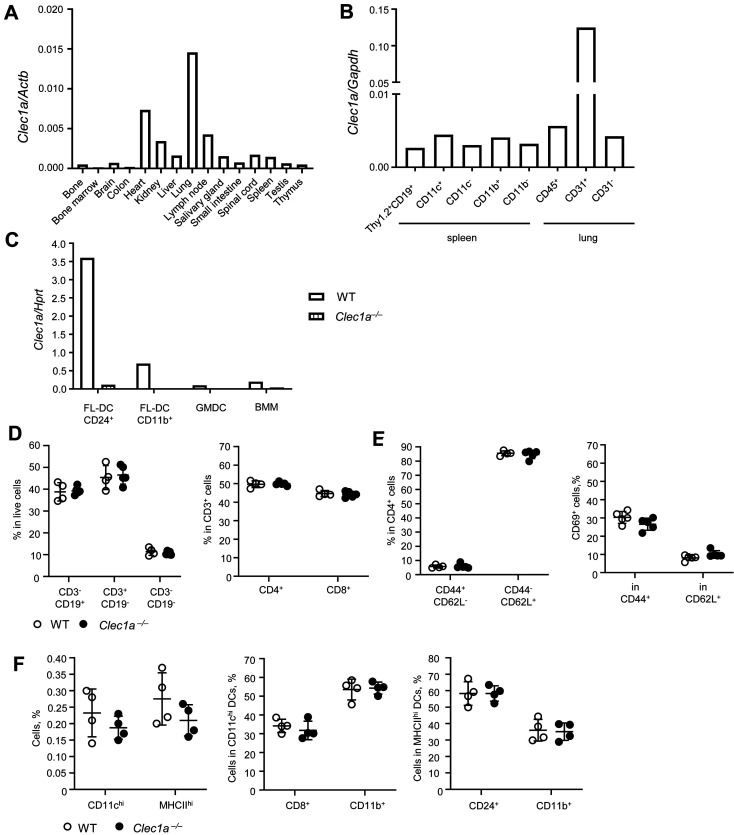
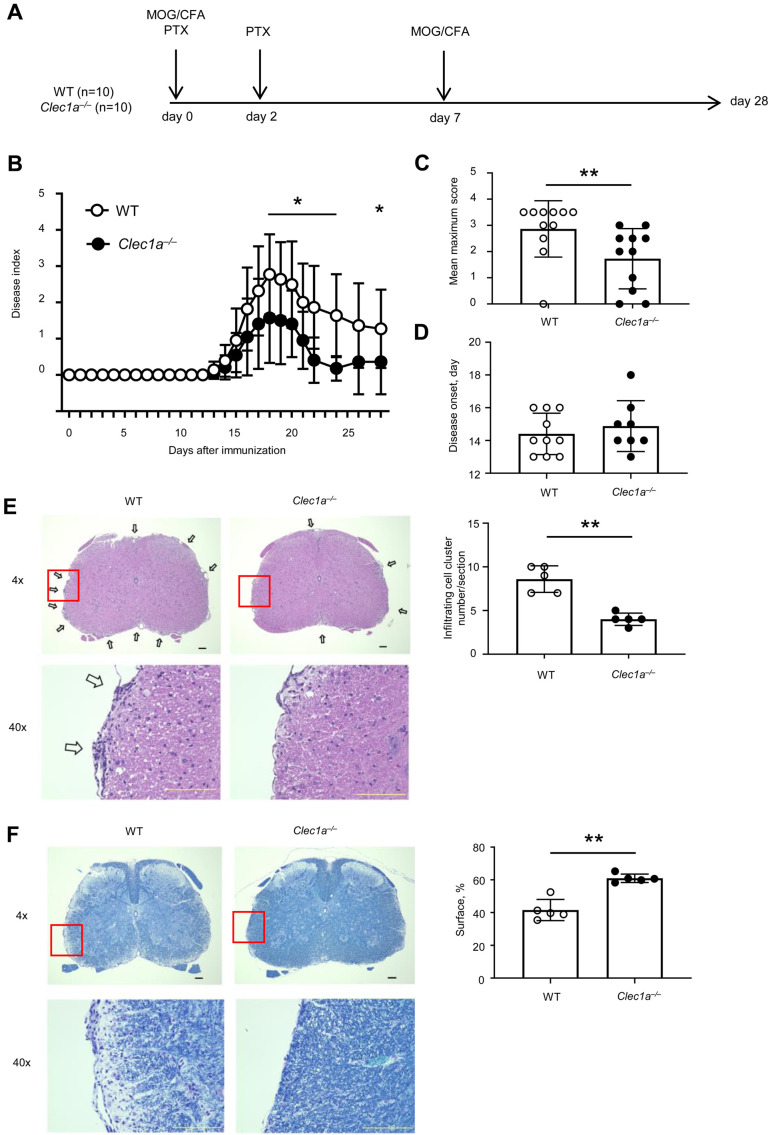
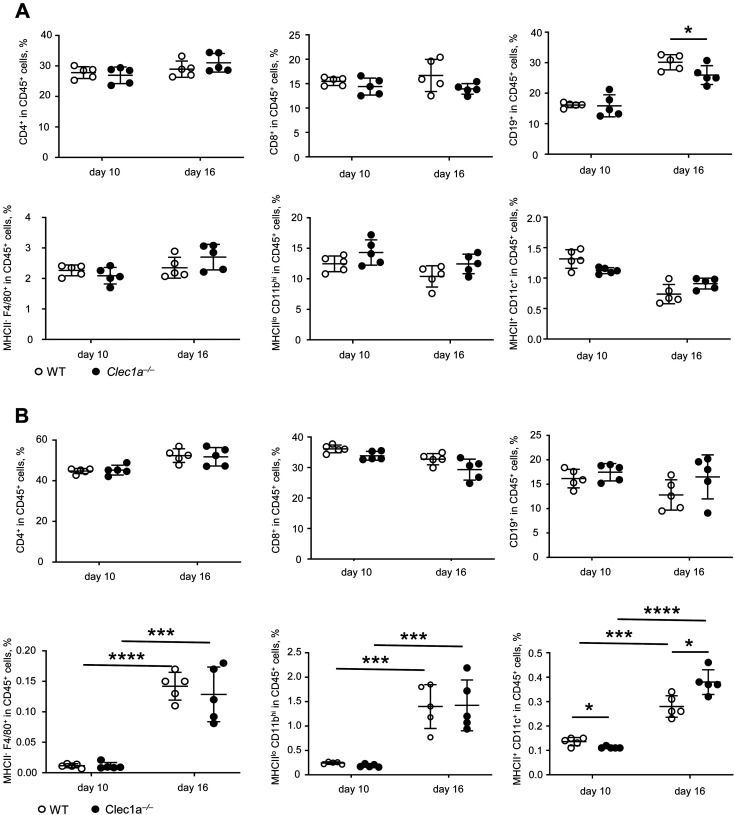
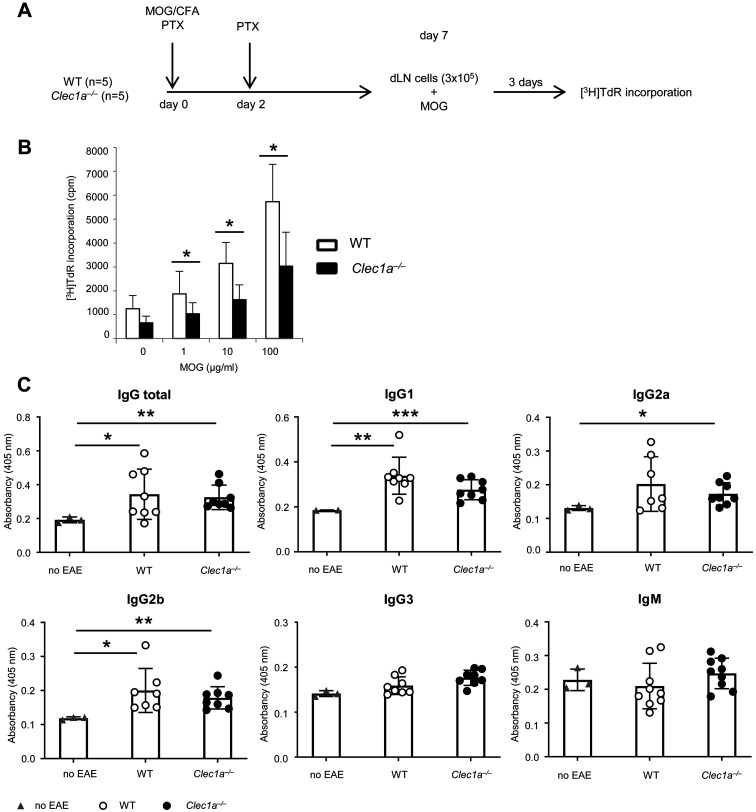
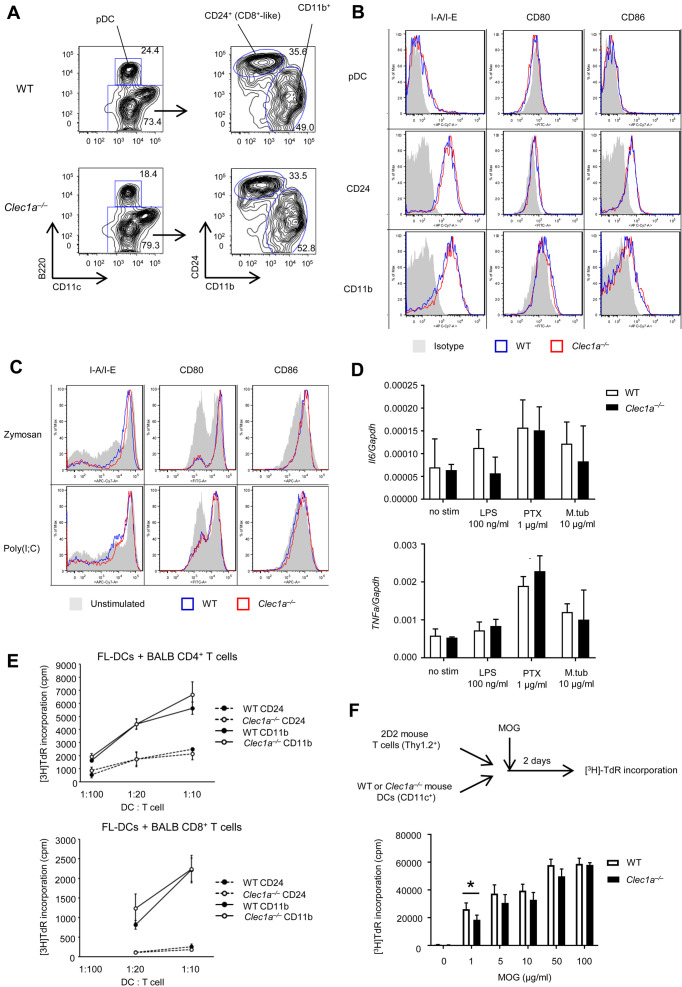
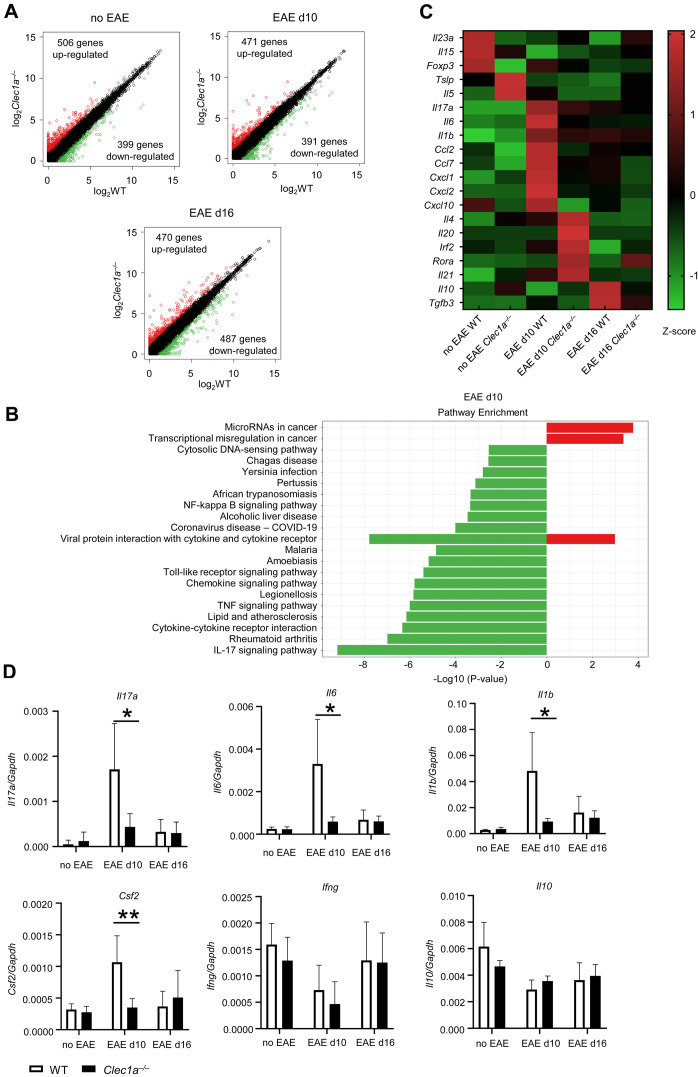
Clec1A, a member of C-type lectin receptor family, has a carbohydrate recognition domain in its extracellular region, but no known signaling motif in the cytoplasmic domain. Clec1a is highly expressed in endothelial cells and weakly in dendritic cells. Although this molecule was reported to play an important role in the host defense against Aspergillus fumigatus by recognizing 1,8-dihydroxynaphthalene-melanin on the fungal surface, the roles of this molecule in un-infected animals remain to be elucidated. In this study, we found that Clec1a-/- mice develop milder symptoms upon induction of experimental autoimmune encephalomyelitis (EAE), an animal model for multiple sclerosis. The maximum disease score was significantly lower, and demyelination and inflammation of the spinal cord were much milder in Clec1a-/- mice compared to wild-type mice. No abnormality was detected in the immune cell composition in the draining lymph nodes and spleen on day 10 and 16 after EAE induction. Recall memory T cell proliferation after restimulation with myelin oligodendrocyte glycoprotein peptide (MOG35-55) in vitro was decreased in Clec1a-/- mice, and antigen presenting ability of Clec1a-/- dendritic cells was impaired. Interestingly, RNA-Seq and RT-qPCR analyses clearly showed that the expression of inflammatory cytokines including Il17a, Il6 and Il1b was greatly decreased in Clec1a-/- mice after induction of EAE, suggesting that this reduced cytokine production is responsible for the amelioration of EAE in Clec1a-/- mice. These observations suggest a novel function of Clec1A in the immune system.

Keywords: C-type lectin receptor; Clec1a; IL-17; experimental autoimmune encephalomyelitis.


Figures

Fig. 1.
Fig. 1.
Tissue specificity of Clec1a expression under physiological conditions. A. Tissue specific expression of Clec1a was examined using RT-qPCR. The expression levels relative to β-actin expression are shown. B. Splenocytes were separated into CD11c+ cells and CD11b+ cells after sorting out the mixture of T and B cells by MACS. Also, dissociated lung cells were separated into CD45+ cells and CD45 cells, and CD45 fraction was further separated into CD31+ cells and CD31 cells. Then, Clec1a expression in these cell populations was analyzed by RT-qPCR. C. Clec1a expression was measured by RT-qPCR in BM-derived cells including FL-DCs (CD24+ and CD11b+), GM-DCs, and BMMs. FL-DCs were sorted by BD FACSAria II. D. Immune cell composition in the spleen was compared between WT and Clec1a−/− mice using flow cytometry. CD3CD19+, CD3+CD19 and CD3CD19 cells (left panel). CD4+ cells and CD8+ cells in CD3+ cells (right panel). E. CD44+CD62L cells and CD44CD62L+ cells in CD4+ cells (left panel). CD69+ cells in CD44+ cells and CD62L+ cells (right panel). F. DC content in inguinal and axillary LN cells was analyzed by flow cytometry. CD11chi and MHCIIhi populations (left panel). CD8+ and CD11b+ cells in CD11chi DCs (center panel). CD24+ and CD11b+ cells in MHCIIhi DCs (right panel).
Fig. 2.
Fig. 2.
Development of EAE is suppressed in Clec1a−/− mice. A. Schematic presentation of the induction of EAE. WT (n=10) and Clec1a−/− (n=10) mice were immunized with MOG peptide in CFA s.c. and PTX was injected i.p. on the same day. On day two, second PTX was injected. Then, on day seven, immunization with MOG peptide in CFA was repeated. Mice were sacrificed on day 28 and analyzed histologically. B. Mean clinical score of WT (white circle) and Clec1a−/− (black circle) mice were measured every day by assessing tail and limbs paralysis. The figure shows representative of total 8 independent experiments with similar results, in which 5 of the experiments showed significant difference. The data of the other 7 experiments are shown in Supplementary Fig. 2. Statistical significance was calculated by Mann-Whitney U test. *P<0.05. C. Mean maximum disease score of WT and Clec1a−/− mice shown in B. Statistical significance was calculated by Mann-Whitney U test. **P<0.01. D. Average onset day of WT and Clec1a−/− mice shown in B. E. Histological analysis of the spinal cord of EAE-induced mice. Left panels. On day 28, a half of the mice shown in B (n=5 for each) were sacrificed, and the spinal cords were excised, formalin fixed, and sections (10 µm) were stained with H & E. Then, the tissue sections were inspected with ×4 (upper) and ×40 (lower) objectives (left panels). Scale bar represents 100 µm. Arrows show the sites where inflammatory cells infiltrate. The images were analyzed by ImageJ software and quantified the number of infiltrating cell clusters. Average of infiltrating cell cluster number/ section is shown. The figures show representative of 5 mice for each. Statistical significance was calculated by Mann-Whitney U test. **P<0.01. F. The same spinal cord samples used in E were used for LFB staining. Left panels: the same spinal cord sections as C were stained with LFB and photos were taken under a microscope. The tissue sections were inspected with ×4 (upper) and ×40 (lower) objectives (left panels). Scale bar represents 100 µm. Right panel: LFB stained area was measured using ImageJ software. The figures show representative of 5 mice for each. Statistical significance was calculated by Mann-Whitney U test. **P<0.01.
Fig. 3.
Fig. 3.
Immune cell compositions of the spleen and inguinal and axillary LNs are comparable between WT and Clec1a−/− mice. Spleen (A) and dLN (B) cell populations were analyzed on day 10 and day 16 after EAE induction for WT (n=5, white circle) and Clec1a−/− (n=5, black circle) mice. The result from one experiment shown in Supplementary Fig. 2D is presented. Statistical significance was calculated by Student’s t test. *P<0.05, ***P<0.001, ****P<0.0001.
Fig. 4.
Fig. 4.
Recall memory T cell proliferation of Clec1a−/− mice is decreased upon in vitro restimulation with MOG peptide. A. Schematic presentation of T cell restimulation experiments after induction of EAE. WT (pooled, n=5) and Clec1a−/− (pooled, n=5) mice were immunized with MOG peptide according to the standard protocol. On day seven after induction of EAE, draining LNs were collected, and cells (3 × 10⁵) were stimulated in vitro with indicated concentrations of MOG peptide. After three days incubation, cells were treated with [3H]TdR for 12 h, and acid precipitable radioactivity was measured. B. MOG peptide-dose-dependent [3H]TdR incorporations were compared between T cells from WT and Clec1a−/− mice. Four well replicates were counted. The results with similar tendency were reproduced in 6 experiments out of total 9 experiments, but significant difference was observed only in 4 experiments. These data are shown in Supplementary Fig. 3. Statistical significance was calculated by Student’s t test. *P<0.05. C. Ab titer in serum against MOG of each Ig subtype was measured at day 28 after induction of EAE. WT mice without EAE induction (no EAE): n=2 or 3; WT mice after EAE induction: n=7; Clec1a−/− mice after EAE induction: n=8. The result is representative of 2 independent experiments. Statistical significance was calculated by Student’s t test. *P<0.05, **P<0.01, ***P<0.001.
Fig. 5.
Fig. 5.
DC differentiation is normal in Clec1a−/− mice while antigen-presenting ability of DCs is moderately decreased. A. FL-DCs were induced to differentiate from BM cells with 50 ng/ml Flt3L for 10 days, and CD11c+B220+ (pDC) cells and CD24+CD11b (CD8+-like) and CD11b+CD11c+ cells were analyzed by FACS. B. Cell surface markers including I-A/I-E, CD80 and CD86 on FL-DCs (pDC, CD24+ and CD11b+ cells) were examined by FACS. C. Cell surface markers were examined after stimulation with zymosan and poly (I:C). D. The expression of Il6 (upper) and Tnf (lower) was measured by RT-qPCR after stimulation of splenic cells with LPS, PTX, or M. tuberculosis (M.tub) at designated concentrations. Polymyxin B (10 µg/ml) was added to all samples. The result is representative of 2 independent experiments. E. Antigen presenting ability of C57BL/6J FL-DCs (2 × 10⁵ cells) was examined by allogeneic mixed lymphocyte response with increased number of BALB/c mouse-derived CD4 cells or CD8 cells. T cell proliferative response was measured by [3H]TdR incorporation. F. Antigen-presenting ability of DCs from Clec1a−/− mice was examined using MOG-specific 2D2 Tg T cells. Upper panel: Schematic presentation of 2D2 Tg T cell stimulation experiments after co-culture with DCs in the presence of MOG. WT (pooled, n=5) and Clec1a−/− (pooled, n=5) mouse splenic CD11c+ DCs (5 × 10³ cells/100 µl) were cultured together with 2D2 Tg mouse Thy1.2+ T cells (2 × 10⁵ cells/100 µl) in the presence of increasing concentrations of MOG peptide. After two days, cells were treated with [3H]TdR for 12 h, and acid precipitable radioactivity was measured. Lower panel: [3H]TdR incorporations are shown. DCs from WT mice: white bars, Clec1a−/− mice: black bars. Four well replicates were counted. The figure shows representative of two individual experiments. The second experiment graph is showed in Supplementary Fig. 3I. Statistical significance was calculated by Student’s t test. *P<0.05.
Fig. 6.
Fig. 6.
Inflammatory cytokine gene expression in draining LNs is decreased in Clec1a−/− mice at day 10 after EAE induction. RNA expression in dLNs was analyzed by RNA-Seq in steady-state (before EAE induction), before the onset of the disease (day 10), and at the peak of the symptoms (day 16). Mice from the experiment shown in Supplementary Fig. 2D were used for the analysis. Draining LNs cells from 5 mice were pooled for each genotype and mRNA was extracted for the RNA-seq analysis. A. Number of up (red)- and down (green)-regulated genes detected by RNA-Seq and selected as differentially expressed genes (|log 2 (TPM+1)|>1, where TPM is transcript per million) between WT and Clec1a−/− mice at steady state, EAE d10 and EAE d16. B. KEGG pathway analysis of up- and down-regulated genes in Clec1a−/− mouse dLNs at day 10 EAE. C. Heatmap of mostly changed genes at different time points. Z-scores were computed for genes that are differentially expressed (|log 2 (TPM+1)|>1) between WT and Clec1a−/− mice and are presented as a heatmap. D. Gene expression of cytokines was examined by RT-qPCR in experiment that is shown in Supplementary Fig. 2D. Second independent experiment result is shown in Supplementary Fig. 5, and its disease score graph is shown in Supplementary Fig. 2E. Statistical significance was calculated by Student’s t test. *P<0.05, **P<0.01.

Similar articles

Cited by

References

    1. Filippi M, Bar-Or A, Piehl F, Preziosa P, Solari A, Vukusic S, et al. Multiple sclerosis. Nat Rev Dis Primers. 2018; 4: 43. doi: 10.1038/s41572-018-0041-4 - DOI - PubMed
    1. Reich DS, Lucchinetti CF, Calabresi PA. Multiple Sclerosis. N Engl J Med. 2018; 378: 169–180. doi: 10.1056/NEJMra1401483 - DOI - PMC - PubMed
    1. Bennett J, Basivireddy J, Kollar A, Biron KE, Reickmann P, Jefferies WA, et al. Blood-brain barrier disruption and enhanced vascular permeability in the multiple sclerosis model EAE. J Neuroimmunol. 2010; 229: 180–191. doi: 10.1016/j.jneuroim.2010.08.011 - DOI - PubMed
    1. Constantinescu CS, Farooqi N, O’Brien K, Gran B. Experimental autoimmune encephalomyelitis (EAE) as a model for multiple sclerosis (MS). Br J Pharmacol. 2011; 164: 1079–1106. doi: 10.1111/j.1476-5381.2011.01302.x - DOI - PMC - PubMed
    1. Fletcher JM, Lalor SJ, Sweeney CM, Tubridy N, Mills KH. T cells in multiple sclerosis and experimental autoimmune encephalomyelitis. Clin Exp Immunol. 2010; 162: 1–11. doi: 10.1111/j.1365-2249.2010.04143.x - DOI - PMC - PubMed

MeSH terms