. 2022 Feb 8;8(1):56.
doi: 10.1038/s41420-022-00837-5.

Role of mTORC1 activity during early retinal development and lamination in human-induced pluripotent stem cell-derived retinal organoids

Affiliations

Role of mTORC1 activity during early retinal development and lamination in human-induced pluripotent stem cell-derived retinal organoids

Si Hyung Lee et al. Cell Death Discov. .

Abstract

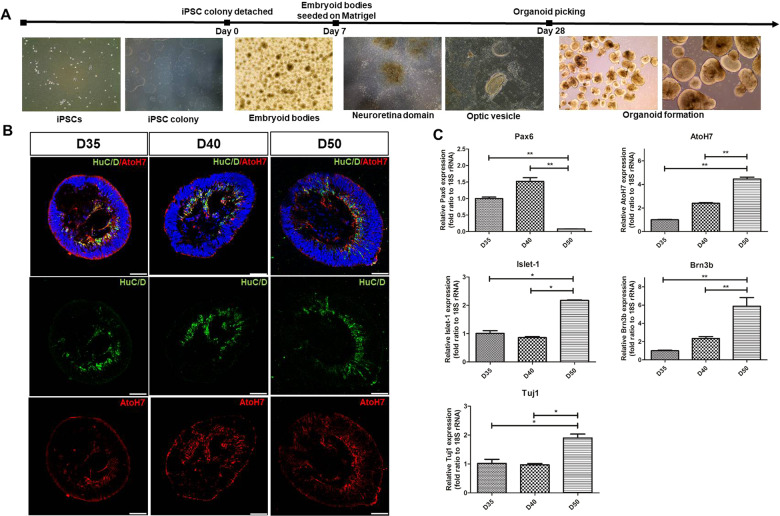
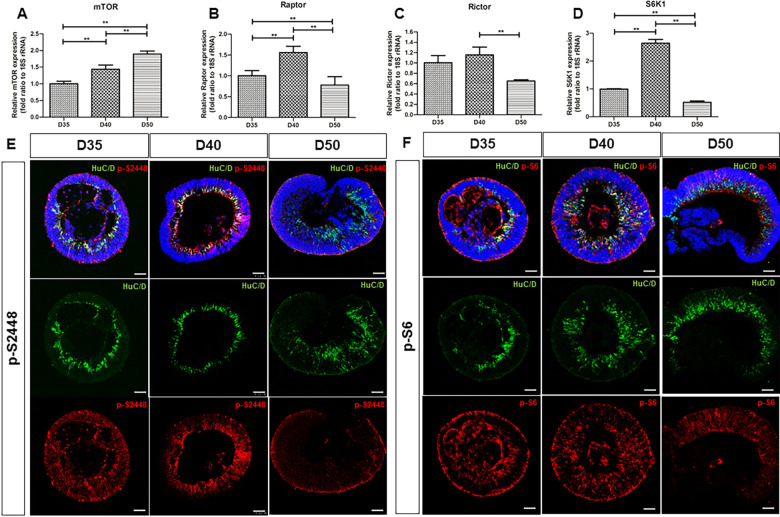
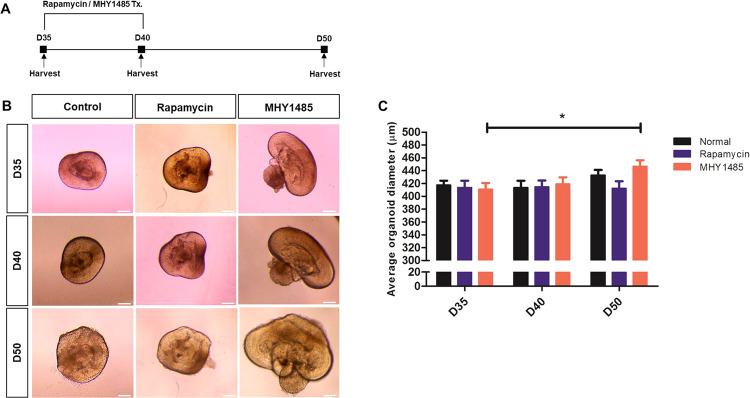
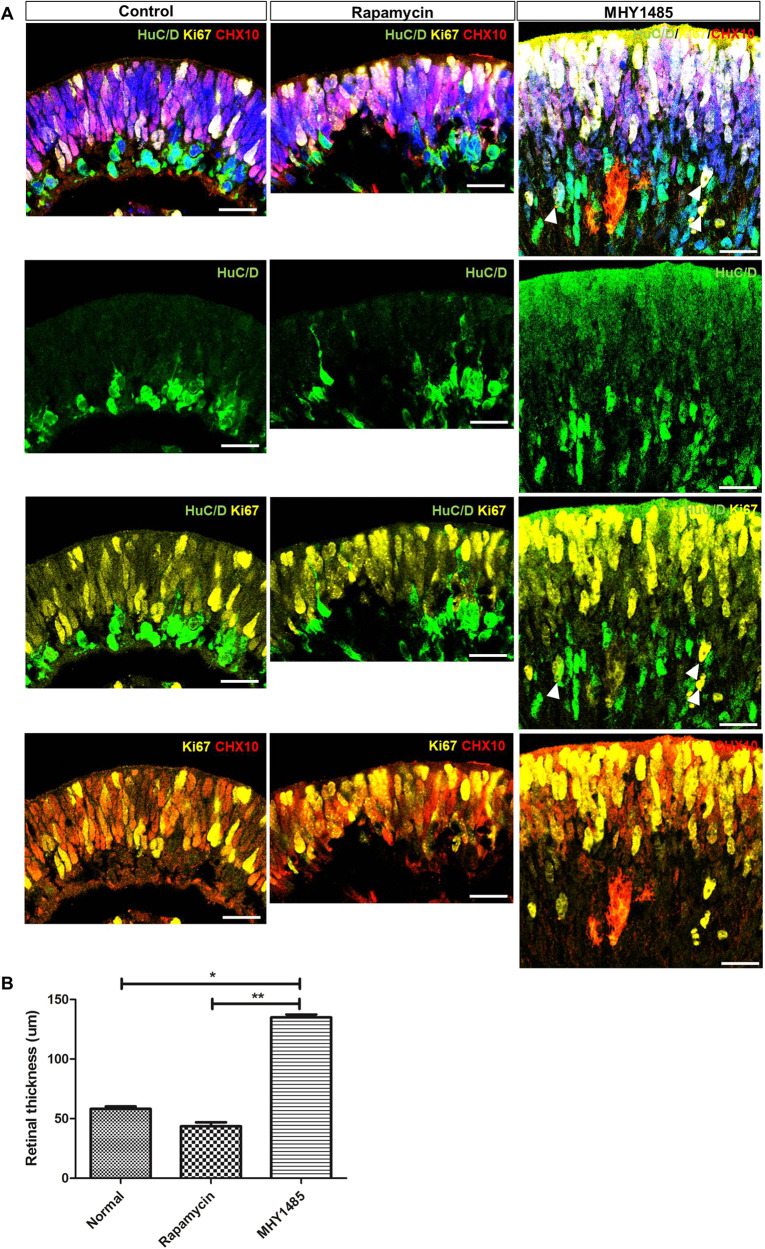
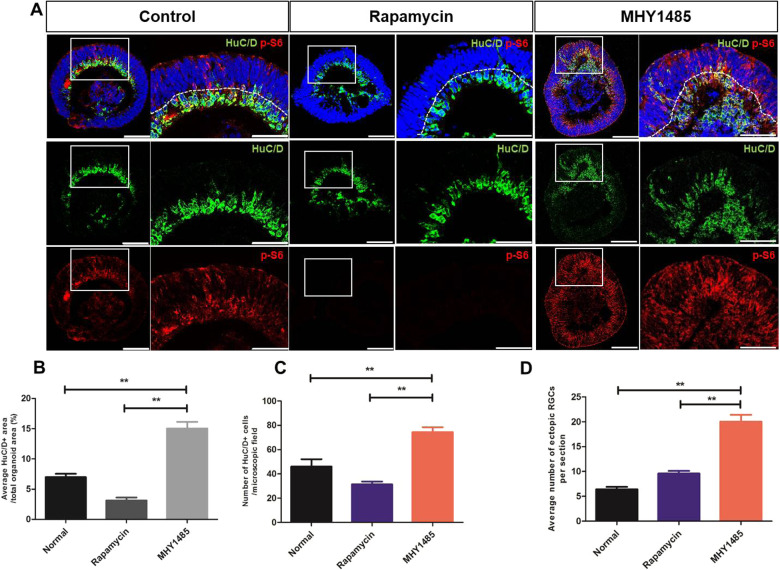
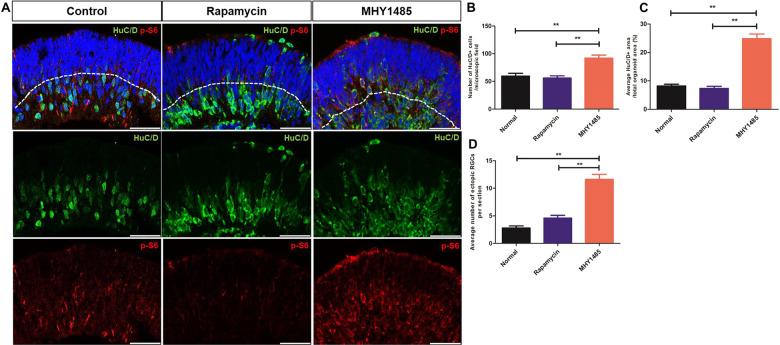
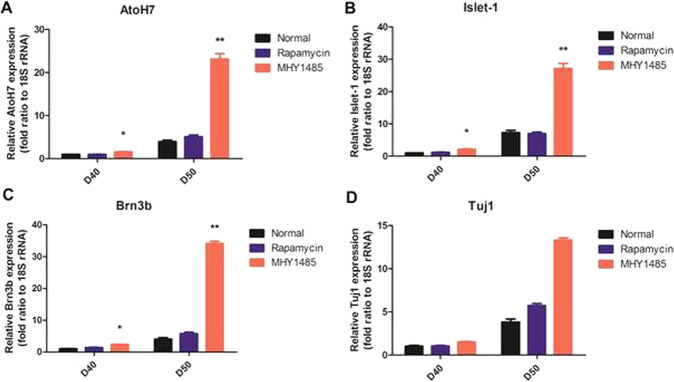
Retinal organoids derived from human-induced pluripotent stem cells (hiPSC) are powerful tools for studying retinal development as they model spatial and temporal differentiation of retinal cell types. Vertebrate retinal development involves a delicate and coordinated process of retinal progenitor cell (RPC) differentiation, and the mammalian target of rapamycin complex 1 (mTORC1) has been reported to play a significant role in this complex process. Herein, using hiPSC-derived retinal organoids, we identify the time-dependent role of mTORC1 in retinal development, specifically in retinal ganglion cell (RGC) differentiation and the retinal lamination process, during the early stages of retinal organoid (RO) development. mTORC1 activity in ROs was the highest at 40 days of differentiation. MHY1485-induced hyperactivation of mTORC1 during this period resulted in a significant increase in the overall size of ROs compared to the untreated controls and rapamycin-treated Ros; there was also a marked increase in proliferative activity within the inner and outer layers of ROs. Moreover, the MHY1485-treated ROs showed a significant increase in the number of ectopic RGCs in the outer layers (indicating disruption of retinal laminar structure), with robust expression of HuC/D-binding proteins in the inner layers. These results demonstrate that mTORC1 plays a critical role in the development of hiPSC-derived ROs, especially during the early stages of differentiation.


Conflict of interest statement

The authors declare no competing interests.

Figures

Fig. 1
Fig. 1. Formation of hiPSC-derived ROs and RGC development at an early stage.
A Main steps of hiPSC-derived RO development in vitro: hiPSC colony, EB formation, neuroretinal domain, and ROs. B Immunofluorescence staining of HuC/D (green) and AtoH7 (red) of ROs at distinct differentiated time points. The expression of HuC/D and AtoH7 was gradually increased in the innermost layers of ROs from day 35 to day 60. C Quantitative RT-PCR results of PAX6, AtoH7, Islet-1, Brn3b, and Tuj1 levels of ROs at indicated time points. Data are expressed by mean ± S.E.M. *p < 0.05, **p < 0.01 by the Kruskal–Wallis test with post hoc analysis. Scale bar, 50 μm.
Fig. 2
Fig. 2. mTOR activity during early stages of RO development.
Quantitative RT-PCR of A total mTOR, B Raptor, C Rictor, and D S6K1 using ROs at indicated days of development. Immunofluorescence staining of HuC/D (green) and p-S2448 (red) (E) or p-S6 (red) (F) of RO at indicated time points. After 35 days of differentiation, both p-S2448 and p-S6 expressions in ROs showed upregulation mainly in the inner layers which co-localized with HuC/D expression, while more robust expressions were found in the outer layers as well as the inner layers of ROs after 40 days of differentiation. Limited p-S2448 and p-S6 activities in outer layers of ROs with scarce co-localization with HuC/D+ cells were noted after 50 days of differentiation. **p < 0.01, by the Kruskal–Wallis test with post hoc analysis. Scale bar, 50 μm.
Fig. 3
Fig. 3. mTORC1 activity during early differentiation affects the overall size of ROs.
A From day 35 to day 40, rapamycin and MHY1485, which are mTORC1 inhibitor and activator, respectively, were administered daily to investigate the role of mTORC1 in RO. B Light microscopic images of control, rapamycin-treated, and MHY1485-treated ROs at indicated time-points of development. C The average diameter of ROs at indicated time points. Data are expressed by mean ± S.E.M. *p < 0.05 by the Kruskal–Wallis test with post hoc analysis. Scale bar, 100 μm.
Fig. 4
Fig. 4. Temporal characteristics of proliferation and differentiation in ROs upon modulation of mTORC1 activity.
A Comparison of proliferation and differentiation in control, rapamycin-treated, and MHY1485-treated ROs shown by immunostaining of Ki67 (yellow) and CHX10 (red) at 40 days of differentiation. In control and rapamycin-treated ROs, Ki67, and CHX10 expression was found in outer layers without any co-localization with HuC/D expression, while ROs with MHY1485 treatment showed upregulated expression of Ki67 and CHX10 throughout all RO layers, including RGC and outer neuroblastic cell layers. Disrupted retinal laminar structure was evident in MHY1485-treated ROs. B The average retinal thickness of in control, rapamycin-treated, and MHY1485-treated ROs. Arrowheads indicate co-localization of HuC/D and Ki67 expression. Data are expressed by mean ± S.E.M. *p < 0.05, **p < 0.01 by the Kruskal–Wallis test with post hoc analysis. Scale bar, 25 μm.
Fig. 5
Fig. 5. RGC development and retinal lamination within ROs at 40 days of differentiation after rapamycin or MHY1485 treatment.
A RGC development in control, rapamycin-treated, and MHY1485-treated ROs shown by immunostaining of HuC/D (green) and p-S6 (red) at 40 days of differentiation. BD Quantification of the ratio of average HuC/D+ area, number of HuC/D positive cells, and number of ectopic RGCs in control, rapamycin-treated, and MHY1485-treated ROs. Data are expressed by mean ± S.E.M. **p < 0.01, by the Kruskal–Wallis test with post hoc analysis. Scale bar in RO whole-image: 100 μm, scale bar in RO magnified image: 50 μm.
Fig. 6
Fig. 6. RGC development and retinal lamination in ROs at 50 days of differentiation after rapamycin or MHY1485 treatment.
A RGC development in control, rapamycin-treated, and MHY1485-treated ROs shown by immunostaining of HuC/D (green) and p-S6 (red) at 50 days of differentiation. BD Quantification of the ratio of average HuC/D area, number of HuC/D positive cells, and number of displaced RGCs in control, rapamycin-treated, and MHY1485-treated ROs. Data are expressed by mean ± S.E.M. **p < 0.01, by the Kruskal–Wallis test with post hoc analysis. Scale bar: 50 μm.
Fig. 7
Fig. 7. Quantitative RT-PCR analysis of ROs for RGC markers upon rapamycin and MHY1485 treatment.
Relative AtoH7 (A), Islet-1 (B), Brn3b (C), and Tuj1 (D) expression level in ROs treated with rapamycin or MHY1485 and untreated controls. MHY1485-treated ROs showed significantly increased expression of RGC markers Data are expressed by mean ± S.E.M. **p < 0.01, by the Kruskal–Wallis test with post hoc analysis.

Similar articles

Cited by

References

    1. Bassett EA, Wallace VA. Cell fate determination in the vertebrate retina. Trends Neurosci. 2012;35:565–73. doi: 10.1016/j.tins.2012.05.004. - DOI - PubMed
    1. Amini R, Rocha-Martins M, Norden C. Neuronal migration and lamination in the vertebrate retina. Front Neurosci. 2018;11:742. doi: 10.3389/fnins.2017.00742. - DOI - PMC - PubMed
    1. Willems L, Tamburini J, Chapuis N, Lacombe C, Mayeux P, Bouscary D. PI3K and mTOR signaling pathways in cancer: new data on targeted therapies. Curr Oncol Rep. 2012;14:129–38. doi: 10.1007/s11912-012-0227-y. - DOI - PubMed
    1. Kim YC, Guan KL. mTOR: a pharmacologic target for autophagy regulation. J Clin Investig. 2015;125:25–32. doi: 10.1172/JCI73939. - DOI - PMC - PubMed
    1. Losiewicz MK, Elghazi L, Fingar DC, Rajala RVS, Lentz SI, Fort PE, et al. mTORC1 and mTORC2 expression in inner retinal neurons and glial cells. Exp Eye Res. 2020;197:108131. doi: 10.1016/j.exer.2020.108131. - DOI - PMC - PubMed