. 2022 Feb 8;13(1):736.
doi: 10.1038/s41467-022-28420-7.

Genomic epidemiology of SARS-CoV-2 under an elimination strategy in Hong Kong

Affiliations

Genomic epidemiology of SARS-CoV-2 under an elimination strategy in Hong Kong

Haogao Gu et al. Nat Commun. .

Abstract

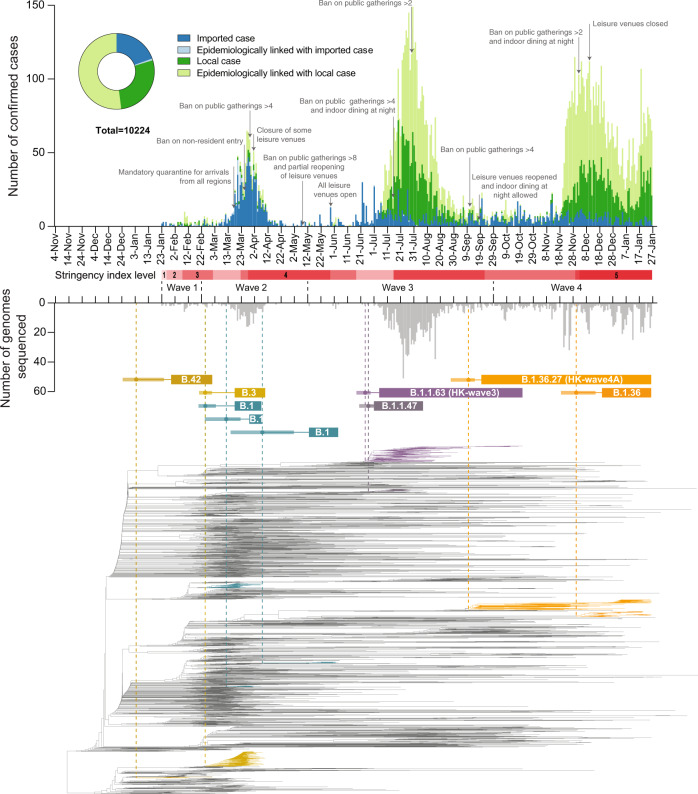
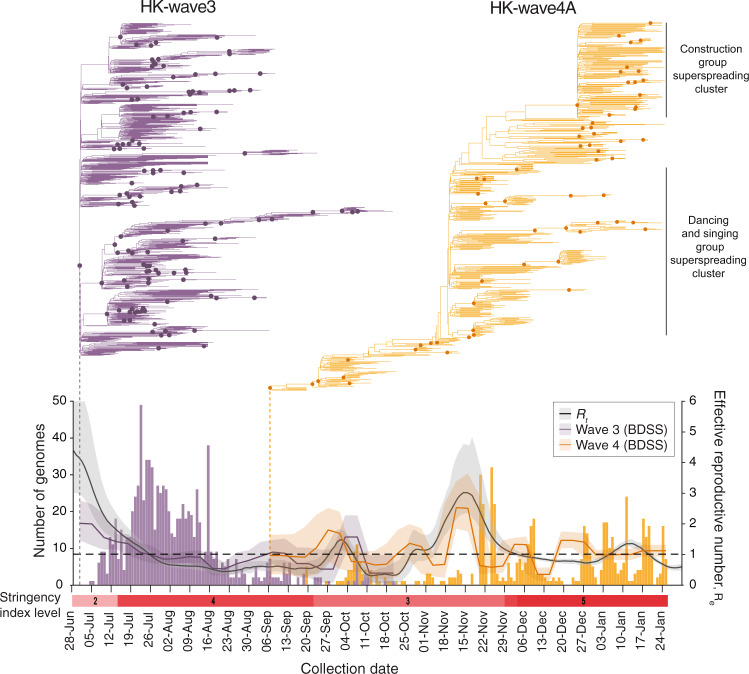
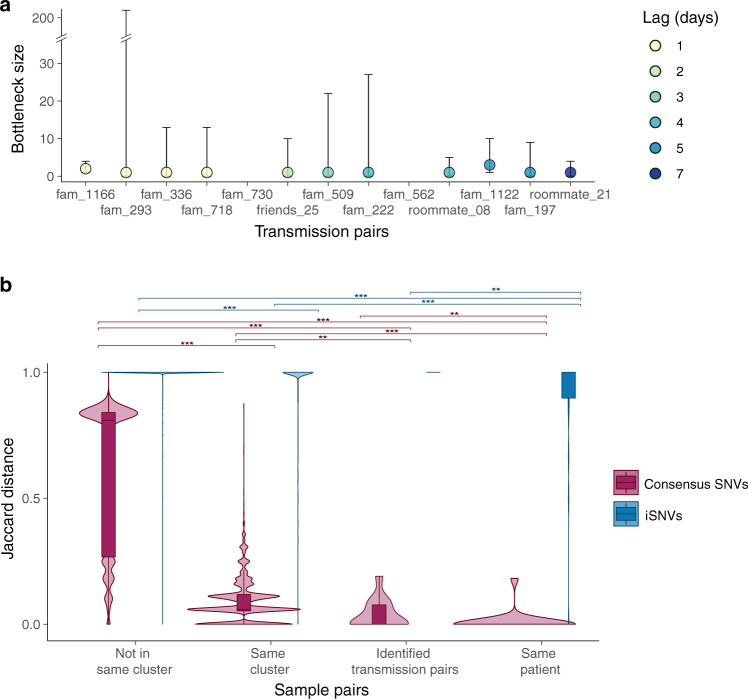
Hong Kong employed a strategy of intermittent public health and social measures alongside increasingly stringent travel regulations to eliminate domestic SARS-CoV-2 transmission. By analyzing 1899 genome sequences (>18% of confirmed cases) from 23-January-2020 to 26-January-2021, we reveal the effects of fluctuating control measures on the evolution and epidemiology of SARS-CoV-2 lineages in Hong Kong. Despite numerous importations, only three introductions were responsible for 90% of locally-acquired cases. Community outbreaks were caused by novel introductions rather than a resurgence of circulating strains. Thus, local outbreak prevention requires strong border control and community surveillance, especially during periods of less stringent social restriction. Non-adherence to prolonged preventative measures may explain sustained local transmission observed during wave four in late 2020 and early 2021. We also found that, due to a tight transmission bottleneck, transmission of low-frequency single nucleotide variants between hosts is rare.


Conflict of interest statement

B.J.C. has consulted for Roche, Sanofi Pasteur, GSK, AstraZeneca, and Moderna. The authors declare no other competing interests.

Figures

Fig. 1
Fig. 1. Epidemiological summary and time-scaled phylogeny of SARS-CoV-2 in Hong Kong.
Confirmed cases (above) and sequenced genomes (below) are shown as bar charts across the four pandemic waves. Control-measure stringency applied in Hong Kong is based on the Oxford COVID-19 Government Response Tracker. Red shaded bars delineate five levels of control-measure stringency in Hong Kong (Level 1: <40; level 2 : 40-50; level 3: 50-60; level 4: 60-70; level 5: >70). Time-scaled phylogeny of representative genomes from Hong Kong (n = 610) and overseas regions (n = 1,538) shows monophyletic clades containing at least five community cases in Hong Kong. The two largest Hong Kong lineages during HK-wave3 and HK-wave4A, B.1.1.63 and B.1.36.27, were subsampled to 100 and 65 sequences, respectively. Other PANGO lineages detected during HK-wave3 and HK-wave4A are shown in Supplementary Table 4.
Fig. 2
Fig. 2. Descriptive and temporal dynamics of SARS-CoV-2 lineages in Hong Kong.
a Time to most recent common ancestor (tMRCA) among the five earliest circulating local lineages of SARS-CoV-2 during waves 1 and 2 in Hong Kong. b Number of SARS-CoV-2 genomic samples per lineage identified over time using a maximum clade credibility phylogeny. Lineage size is ordered on a log10 scale and plotted by earliest confirmation date. c Correlation between the detection lag of locally circulating lineages and the final lineage duration with overlapping points showing uncertainty in lineage detection and duration. Detection lag over time as a function of tMRCA across three epidemic periods d waves one and two, e wave three, f wave four. Overall, a significant reduction in detection lag was observed over time and across each epidemic wave. Points in panels cf represent a random sample of 1000 lineages from a Bayesian posterior tree distribution (n = 8000).
Fig. 3
Fig. 3. Phylodynamics of waves three and four in Hong Kong.
Evolutionary relationships and effective reproduction number (Re(t)) of HK-wave3 (B.1.1.63) and HK-wave4A (B.1.36.27) estimated using tree heights and sequenced incidence data. Node shapes indicate posterior probability >0.5. Histogram shows the number of genomes by collection date. Control-measure stringency applied in Hong Kong is based on the Oxford COVID-19 Government Response Tracker. Black line shows the instantaneous effective reproduction number (Rt), estimated based on infection dates inferred from reported symptom onset or confirmation dates for asymptomatic cases.
Fig. 4
Fig. 4. Transmission bottleneck size estimates and single nucleotide variant (SNV) frequencies.
a Estimated transmission bottleneck sizes (maximum-likelihood estimates with 95% confidence intervals) for paired donor and recipient samples. Lag time defined by difference in dates of symptom onset. Bottleneck size estimates for transmission pairs fam_562 and fam_730 are not available due to a limited number of intra-host SNVs (iSNVs) in the recipients’ samples. b Jaccard distance of consensus-level SNVs and iSNVs among epidemiologically and phylogenetically different types of paired samples. Jaccard distances range from 0 to 1, with 0 indicating identical SNV profiles, and 1 indicating no SNVs in common. Violin plots show the range and distribution of Jaccard distances. Boxplots indicate median and inter-quartile ranges (IQR), and whiskers represent value ranges up to 1.5 * IQR. Between-group differences were tested by two-sided Wilcoxon tests separately for consensus-level SNVs and iSNVs. Significance was represented by **p < 0.05 (p = 0.006 between Same cluster and Identified transmission pairs for consensus-level SNVs; p = 0.034 between Identified transmission pairs and Same patient for consensus-level SNVs; p = 0.014 between Identified transmission pairs and Same patient for iSNVs) and ***p < 0.001.

Update of

Similar articles

Cited by

References

    1. Wu F, et al. A new coronavirus associated with human respiratory disease in China. Nature. 2020;579:265–269. - PMC - PubMed
    1. Dong E, Du H, Gardner L. An interactive web-based dashboard to track COVID-19 in real time. Lancet Infect. Dis. 2020;20:533–534. - PMC - PubMed
    1. Verity R, et al. Estimates of the severity of coronavirus disease 2019: a model-based analysis. Lancet Infect. Dis. 2020;20:669–677. - PMC - PubMed
    1. Russell TW, et al. Estimating the infection and case fatality ratio for coronavirus disease (COVID-19) using age-adjusted data from the outbreak on the Diamond Princess cruise ship, February 2020. Eur. Surveill. 2020;25:20000256. - PMC - PubMed
    1. Wu JT, et al. Estimating clinical severity of COVID-19 from the transmission dynamics in Wuhan, China. Nat. Med. 2020;26:506–510. - PMC - PubMed

Publication types