. 2022 Feb 8;13(1):747.
doi: 10.1038/s41467-022-28210-1.

A re-appraisal of the ENSO response to volcanism with paleoclimate data assimilation

Affiliations

A re-appraisal of the ENSO response to volcanism with paleoclimate data assimilation

Feng Zhu et al. Nat Commun. .

Abstract

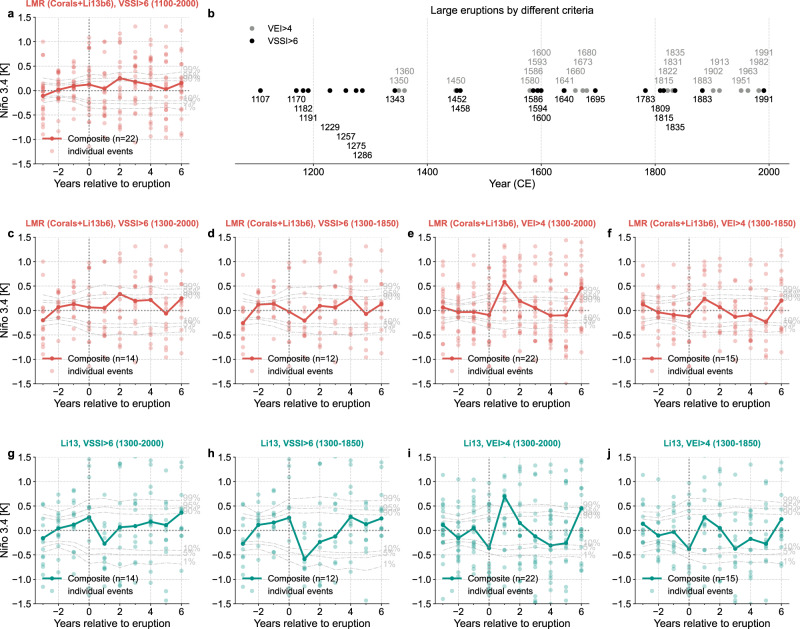
The potential for explosive volcanism to affect the El Niño-Southern Oscillation (ENSO) has been debated since the 1980s. Several observational studies, based largely on tree-ring proxies, have since found support for a positive ENSO phase in the year following large eruptions. In contrast, recent coral data from the heart of the tropical Pacific suggest no uniform ENSO response to explosive volcanism over the last millennium. Here we leverage paleoclimate data assimilation to integrate both tree-ring and coral proxies into a reconstruction of ENSO state, and re-appraise this relationship. We find only a weak statistical association between volcanism and ENSO, and identify the selection of volcanic events as a key variable to the conclusion. We discuss the difficulties of conclusively establishing a volcanic influence on ENSO by empirical means, given the myriad factors affecting the response, including the spatiotemporal details of the forcing and ENSO phase preconditioning.


Conflict of interest statement

The authors declare no competing interests.

Figures

Fig. 1
Fig. 1. Validation of the last millennium reanalysis (LMR), sea surface temperature reconstructions over the instrumental period (1881–2000 CE).
The labels LMR (Corals), LMR (Li13b6), and LMR (Corals+Li13b6) denote the reconstructions assimilating corals reaching back before 1750 CE from the Ocean2k compilation, updated with the latest Palmyra data, the six best predictors from Li et al. (denoted as Li13b6), and both data sources, respectively. ac Spatial verification of the median field of the reconstructed boreal winter (December–February, DJF) surface temperature. Validation is performed against the Extended Reconstructed Sea Surface Temperature, Version 5 (ERSSTv5). The orange dots denote the location of the corals, the mint and blue squares denote the location of the North American Drought Atlas (NADA) (Version 2a) and Monsoon Asia Drought Atlas (MADA) sites, the green upward triangle denotes the location of the Kauri tree-ring composite, and the green downward triangle denotes the location of the South America Altiplano (SA Altiplano) tree-ring composite. df Temporal verification of the median of the LMR reconstructed DJF Niño 3.4 series (colored curves) against the ERSSTv5 derived Niño 3.4 (black solid curve). For each reconstruction, dark shading denotes the interquartile range, and light shading denotes the central 95% region, from 2.5% to 97.5%. R2 = coefficient of determination, CE = coefficient of efficiency.
Fig. 2
Fig. 2. Timing of eruptions and ENSO events over 1100–2000 CE.
a The 22 largest eruption events, defined as a volcanic stratospheric sulfur injection (VSSI) greater than 6 according to eVolv2k version 3 and Toohey et al.. The 13 events sampled by the Palmyra coral record, are colored in black, while other events are colored in gray. bd Niño 3.4 reconstructions over the 1100–2000 CE period estimated with the Last Millennium Reanalysis (LMR) framework,. For each reconstruction, dark shading denotes the interquartile range, while light shading denotes the central 95% region (2.5% to 97.5% quantiles).
Fig. 3
Fig. 3. Superposed epoch analysis (SEA) of the last millennium reanalysis (LMR), Niño 3.4 reconstructions around the 13 events when the Palmyra record is available.
a coral predictors only, b Li13b6 predictors only, and c corals+Li13b6 predictors. Solid curves with dark dots denote the composite mean, and the light dots denote the Niño 3.4 anomaly at each year for each individual event. The light gray dashed curves denote the 1%, 5%, 10%, 90%, 95%, and 99% quantiles of the composite means from 1000 bootstrap draws from non-volcanic years (see “Methods” for details).
Fig. 4
Fig. 4. A superposed epoch analysis (SEA) comparison between the last millennium reanalysis (LMR), reconstruction and the Li et al. reconstruction.
a SEA of the Niño 3.4 reconstruction LMR (Corals+Li13b6) regarding all the 22 events over the past millennium. b The large eruption events defined by different criteria: the volcanic explosivity index greater than 4 (VEI > 4) and the volcanic stratospheric sulfur injection greater than 6 (VSSI > 6). cf Superposed epoch analysis (SEA) of LMR (Corals+Li13b6) regarding the defined large eruption events based on VSSI > 6 over 1300–2000 CE, VSSI > 6 over 1300–1850 CE, VEI > 4 over 1300–2000 CE, and VEI > 4 over 1300–1850 CE, respectively. gj Same as subplots (cf), but for the Li et al. reconstruction (denoted as Li13).

References

    1. Sarachik ES, Cane MA. The El Niño-Southern Oscillation Phenomenon. Cambridge, UK: Cambridge University Press; 2010.
    1. McPhaden, M. J., Lee, T. & McClurg, D. El Niño and its relationship to changing background conditions in the tropical Pacific Ocean. Geophys. Res. Lett.38, 10.1029/2011GL048275 (2011).
    1. Diaz HF, Hoerling MP, Eischeid JK. ENSO variability, teleconnections and climate change. Int. J. Climatol. 2001;21:1845–1862.
    1. Adams J, Mann ME, Ammann CM. Proxy evidence for an El Niño-like response to volcanic forcing. Nature. 2003;426:274–278. - PubMed
    1. Mann ME, Cane MA, Zebiak SE, Clement A. Volcanic and solar forcing of the tropical pacific over the past 1000 years. J. Clim. 2005;18:447–456.

Publication types