. 2022 Feb 8;13(1):753.
doi: 10.1038/s41467-022-28331-7.

Physiological synaptic activity and recognition memory require astroglial glutamine

Affiliations

Physiological synaptic activity and recognition memory require astroglial glutamine

Giselle Cheung et al. Nat Commun. .

Abstract

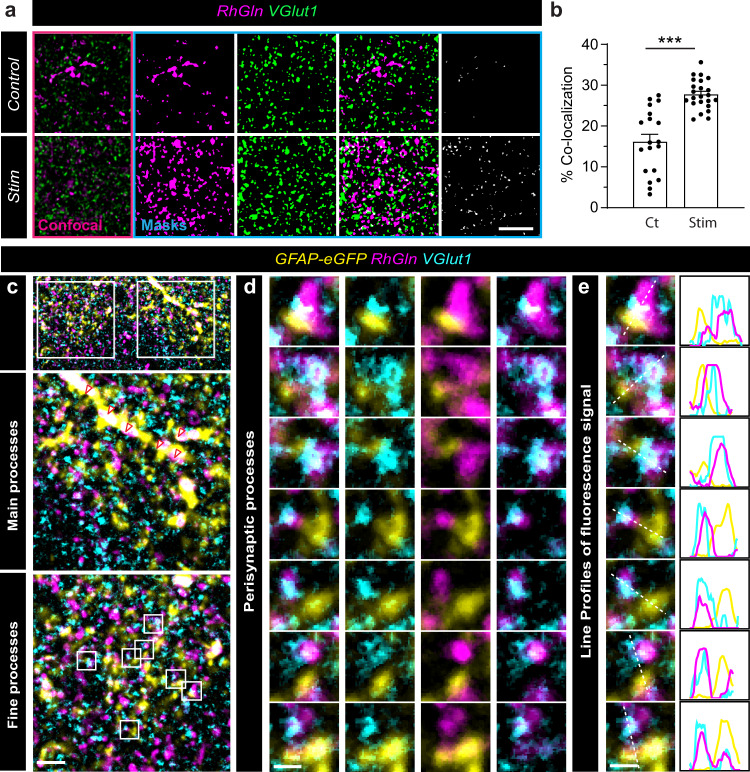
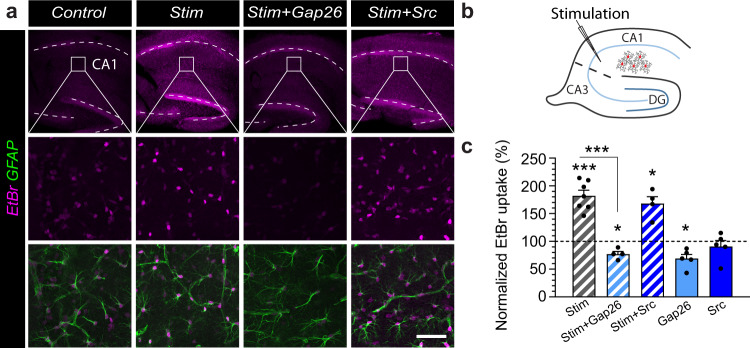
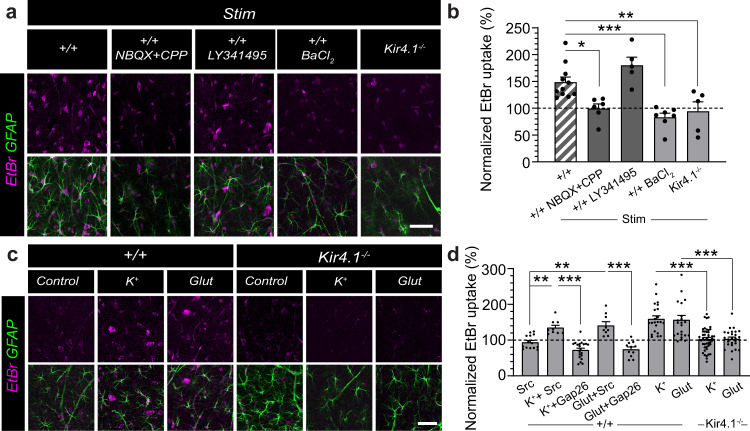
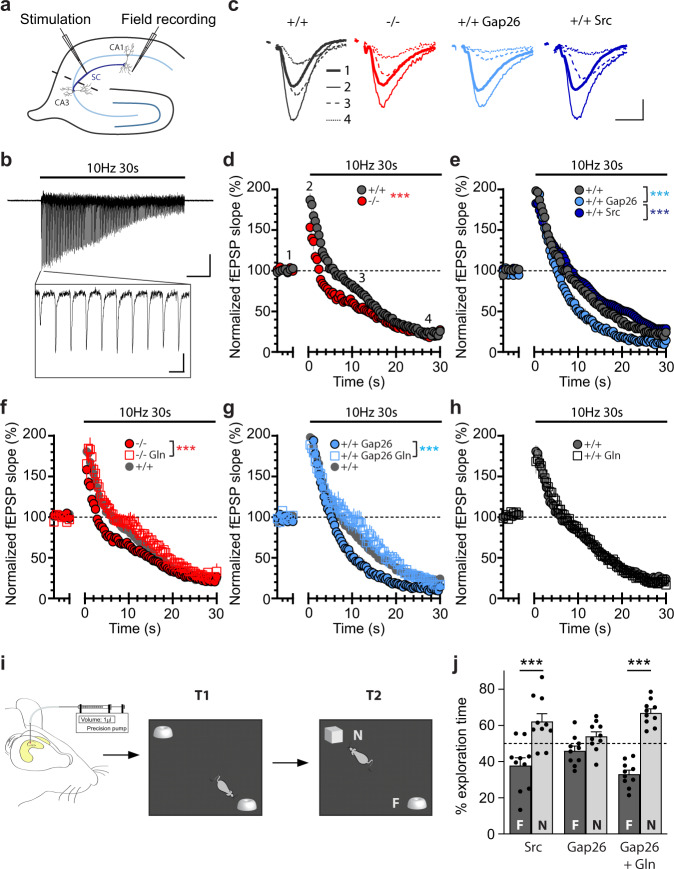
Presynaptic glutamate replenishment is fundamental to brain function. In high activity regimes, such as epileptic episodes, this process is thought to rely on the glutamate-glutamine cycle between neurons and astrocytes. However the presence of an astroglial glutamine supply, as well as its functional relevance in vivo in the healthy brain remain controversial, partly due to a lack of tools that can directly examine glutamine transfer. Here, we generated a fluorescent probe that tracks glutamine in live cells, which provides direct visual evidence of an activity-dependent glutamine supply from astroglial networks to presynaptic structures under physiological conditions. This mobilization is mediated by connexin43, an astroglial protein with both gap-junction and hemichannel functions, and is essential for synaptic transmission and object recognition memory. Our findings uncover an indispensable recruitment of astroglial glutamine in physiological synaptic activity and memory via an unconventional pathway, thus providing an astrocyte basis for cognitive processes.


Conflict of interest statement

The authors declare no competing interests.

Figures

Fig. 1
Fig. 1. Synthesis and characterization of fluorescent rhodamine-tagged glutamine (RhGln) molecule.
a Fluorescent RhGln molecule was prepared using a 5-step chemical synthesis with 48% overall yield. b Characterization of steady-state electronic absorption (solid line) and emission (dotted line) spectra of RhGln at excitation wavelength (λex) of 520 nm in intracellular solution at 20 °C, showing sharp absorption and emission maxima of 580 and 601 nm, respectively. c Fluorescence lifetime decay of RhGln in intracellular solution at λex of 520 nm (blue circles). The instrument response function (IRF, orange squares) and fitted line (Fit, red) are also shown. d, e Comparison of absorption (d) and emission (e) spectra between RhGln (red line, 0.83 µM) and its rhodamine precursor (Rh101, blue line, 0.94 µM) at an λex of 530 nm in intracellular solution at 20 °C is shown with a relative fluorescence emission quantum yield value (ΦF) of 0.6 for RhGln (inset).
Fig. 2
Fig. 2. RhGln reveals activity-dependent redistribution of glutamine away from astroglial networks.
a RhGln or Rh traffics through gap junction-mediated astroglial networks when dialyzed (0.8 mM, 20 min) into a single CA1 hippocampal astrocyte via the patch pipette. The representative images illustrate the transfer of RhGln (magenta) or Rh (cyan) from the patched astrocyte (asterisks) to neighboring cells under control condition, which was abolished by the gap-junction blocker carbenoxolone (CBX, 200 μM), and reduced by repetitive synaptic stimulation (Stim; 10 Hz, 30 s every 3 min for 20 min). The transfer of Rh was similar to RhGln in basal condition, but was not reduced by stimulation. b RhGln under control conditions was found distributed in neighboring cells identified as Aldh1l1-positive astrocytes (green), indicating the spread of glutamine into astroglial networks. Asterisks mark the position of the patched cell. Thin arrows mark astrocytes in which RhGln-labeling is found primarily in processes. c RhGln puncta were observed along main (arrowheads) and fine processes (arrows) of a GFAP-positive cell (green). Higher magnification of two areas (blue boxes) are also shown. d Schematic and sample traces showing simultaneous recordings of evoked depolarization of a patched astrocyte (Patch, red trace) and field excitatory postsynaptic potential (fEPSP, Field recording, black trace) during stimulation of the Schaffer collaterals (Stimulation). e Quantification of RhGln or Rh transfer from the patched astrocyte to neighboring cells under different conditions (Control, Ct-RhGln, n = 9; CBX-RhGln, n = 7, p < 0.0001; Ct-Rh, n = 6, p = 0.7745; one-way ANOVA with Bonferroni’s post hoc test with Ct-RhGln). f Quantification of RhGln or Rh transfer from the patched astrocyte to neighboring cells under stimulated conditions normalized to control (Stim-RhGln, n = 10, p < 0.0001; Stim-Rh, n = 6, p = 0.0123; one-sample t-test with 100%; p = 0.0421 two-tailed unpaired Student’s t-test between Stim-RhGln and Stim-Rh). Mean ± SEM in e, f. Scale bars: a 50 µm; b 20 µm; c 5 µm; d 0.5 mV (Astrocyte), 0.2 mV (fEPSP), 20 ms. Asterisks indicate statistical significance (***p < 0.0001, *p < 0.05). Representative images in a, b are from replicates described in e and f; and c are from n = 3 replicates. Source data are provided as a Source data file.
Fig. 3
Fig. 3. RhGln is redistributed into subcellular punctate structures.
a RhGln or Rh were dialyzed (0.8 mM, 20 min) into a single CA1 hippocampal astrocyte via the patch pipette. Punctate RhGln-labeling surrounding dye-filled astrocytes is enhanced by stimulation as shown in representative confocal (dark background) and thresholded binary (white background) images (a left), quantification by Sholl analysis (Ct, n = 12; Stim, n = 9, p < 0.0001, two-way ANOVA in b) and total punctate area (p = 0.0003 between Ct and Stim, one-way ANOVA with Bonferroni’s post hoc test in e). This was not observed when the unconjugated rhodamine dye was used (Rh, 0.8 mM in a (middle): Ct, n = 6; Stim, n = 5, p = 0.7012, two-way ANOVA in c; and p > 0.9999 between Ct and Stim with Rh, and p < 0.0001 between RhGln Stim and Rh Stim, one-way ANOVA with Bonferroni’s post hoc test in e) or in the presence of MeAIB, α-Methylaminoisobutyric acid, an antagonist of neuronal glutamine uptake (RhGln + MeAIB, 20 mM in a (right): Ct, n = 5; Stim, n = 6, p > 0.9999, two-way ANOVA in d; p > 0.9999 between Ct and Stim with RhGln + MeAIB, and p = 0.0002 between RhGln Stim and RhGln + MeAIB Stim, one-way ANOVA with Bonferroni’s post hoc test in e). Mean ± SEM in be. Scale bars: a 20 µm. Asterisks indicate statistical significance (***p < 0.0001). Source data are provided as a Source data file.
Fig. 4
Fig. 4. Astroglial RhGln enters presynaptic compartments upon synaptic activity.
a Sample confocal (pink box) and binary images (blue box) showing that after dialysis of a single astrocyte with RhGln (0.8 mM, 20 min), RhGln-labeled puncta (magenta) are observed and show increased co-localization with the glutamatergic presynaptic marker VGlut1 (green) under repetitive synaptic stimulation (Stim; 10 Hz, 30 s every 3 min for 20 min). b Bar graph (mean ± SEM) showing % co-localization normalized to total area of RhGln-filled structures for Ct (n = 19 fields, 3 independent experiments) and Stim (n = 23 fields, 3 independent experiments, p < 0.0001, two-tailed unpaired Student’s t-test) conditions. c, d STED super-resolution imaging confirmed co-localization of VGlut1 (cyan) with RhGln (magenta) found directly next to an astroglial compartment (yellow) after dialysis of a GFAP-eGFP expressing astrocyte (yellow) with RhGln (0.8 mM, 20 min) during repetitive synaptic stimulation, as shown in the sample images (c). Higher magnifications of regions containing either main (middle panel) or fine (lower panel) astroglial processes are shown. Arrowheads denote accumulation of RhGln along a main process. d Representative images containing perisynaptic astroglial processes marked by boxes in c (lower panel). e Line profiles measured along individual white dotted lines for individual channels to illustrate co-localization. Scale bars: a 5 µm; c 2 µm; d, e 0.5 µm. Asterisks indicate statistical significance (***p < 0.0001). Representative images a are from replicates described in (b); and ce are from n = 3 replicates. Source data are provided as a Source data file.
Fig. 5
Fig. 5. Cx43 is expressed in perisynaptic astroglial processes.
a Representative confocal images showing close proximity of Cx43 (cyan) in GFAP-eGFP positive astrocytes (yellow) to presynaptic structures immunolabeled for VGlut1 (magenta). Higher magnification images of a region containing astroglial processes (blue square) are shown in the middle row. Arrowheads denote points of close contact. Masks showing co-localized area of GFAP (yellow) and Cx43 (cyan) as total Cx43 (binary inverse image) and co-localized area of total Cx43 (cyan) and VGlut1(magenta) as presynaptic Cx43 (binary inverse image). b Bar graph (mean ± SEM) showing % Perisynaptic Cx43 normalized to total Cx43 area (n = 13 fields, 3 independent experiments). c Schematic illustration of co-purification of perisynaptic astroglial processes in crude synaptosomes. d Representative western blots showing an enrichment of Cx43 protein in synaptosomal preparations (Syn) compared to total hippocampal lysates (Hip) in wild type (+/+), but not in glial conditional Cx43 knockout (−/−) mice. GAPDH was used as a loading control. e Representative high magnification electron micrographs showing the presence of Cx43 protein labeled by immunogold particles in astroglial processes near synaptic complexes. f Distribution histogram of distance between Cx43 gold grains and the nearest active zone. Scale bars: a 5 µm, e 0.5 µm (left), 0.3 µm (right). Representative images (a) are from replicates described in (b); d are from n = 3 replicates; and e are from n = 8 replicates. Source data are provided as a Source data file.
Fig. 6
Fig. 6. Cx43 hemichannel function is enhanced by synaptic activity.
Acute hippocampal slices were loaded with ethidium bromide (EtBr) under different experimental conditions. a Sample images of EtBr uptake (magenta) in hippocampal GFAP-immunolabeled astrocytes (green) are shown for Control, Stim (10 Hz, 30 s every 3 min for 20 min) in the absence or presence of the Cx43 HC blocker Gap26 or a Gap26 scramble version (Src). Higher magnifications of the CA1 stratum radiatum subregion are shown in bottom two rows. b Schematic illustrating stimulation of hippocampal Schaffer collaterals and EtBr uptake in neighboring astrocytes. c Quantification of EtBr uptake normalized to 100% control (dotted line) is shown. Stimulation-enhanced EtBr uptake by nearly 2-fold (mean ± SEM; Control, n = 6; Stim, n = 7, p = 0.0002 between Control and Stim, one-sampled t-test). This enhanced uptake was not observed in the presence of Gap26 (Stim + Gap26, n = 4, p < 0.0001 between Stim and Stim+Gap26, one-way ANOVA with Bonferroni’s post hoc test; p = 0.0168 with control, one-sampled t-test) but persisted with Src (Stim + Src, n = 4, p = 0.6857 between Stim and Stim+Src, one-way ANOVA with Bonferroni’s post hoc test; p = 0.0125 with control, one-sampled t-test), while Gap26 alone decreases EtBr uptake from control level (n = 5, p = 0.014, one-sampled t-test) but not Src (n = 5, p = 0.4443, one-sampled t-test). Scale bars: a 450 µm (top), 50 µm (middle and bottom). Asterisks indicate statistical significance (***p < 0.001; *p < 0.05). Source data are provided as a Source data file.
Fig. 7
Fig. 7. Activity-dependent Cx43 hemichannel function is mediated by glutamatergic synaptic activity and potassium activation of Kir4.1 channels.
Acute hippocampal slices were loaded with ethidium bromide (EtBr) under stimulated conditions in the absence or presence of various blockers. a, b Sample images of EtBr uptake (magenta) in hippocampal GFAP-immunolabeled astrocytes (green) are shown in (a) and quantified in (b). Stimulation-enhanced uptake was blocked in the presence of NBQX + CPP (20 μM, n = 6, p = 0.0112 with wild-type control, +/+, n = 11, one-way ANOVA with Bonferroni’s post hoc test), but not LY341495 (20 μM; n = 5, p = 0.2433 with +/+, one-way ANOVA with Bonferroni’s post hoc test), indicating the specific involvement of ionotropic glutamate receptor activity. This stimulation-dependent uptake was also blocked in the presence of BaCl2 (200 μM; n = 7, p = 0.0004 with +/+, one-way ANOVA with Bonferroni’s post hoc test) and in acute slices prepared from Kir4.1−/− mice (n = 5, p = 0.0086 with +/+, one-way ANOVA with Bonferroni’s post hoc test), indicating the specific involvement of Kir4.1 activity. c, d Incubation of acute slices with either 2 mM K+ or 1 μM glutamate (Glut) alone enhanced basal EtBr uptake (K+ + Src, n = 9, 3 experiments, p = 0.0061; Glut+Src, n = 9, 3 experiments, p = 0.0056 with Src, n = 14, 5 experiments; Kruskal–Wallis test with Dunn’s post hoc test) in a Cx43 HC-dependent manner (K+ + Gap26, n = 20, 7 experiments, p < 0.0001 with K+ + Src; Glut+Gap26, n = 11, 5 experiments, p < 0.0001 with Glut+Src; Kruskal–Wallis test with Dunn’s post hoc test). In Kir4.1−/− hippocampal slices, neither K+ nor Glut were able to enhance EtBr uptake (K+ Kir4.1−/−, n = 49, 17 experiments, p < 0.0001 with K+ +/+, n = 22, 8 experiments; Glut Kir4.1−/−, n = 27, 9 experiments, p = 0.0001 with Glut +/+, n = 23, 8 experiments, Mann–Whitney test). Mean ± SEM in (b) and (d). Scale bars: a and c, 50 µm. Asterisks indicate statistical significance (***p < 0.001; **p < 0.01; *p < 0.05). NBQX = 2,3-Dihydroxy-6-nitro-7-sulfamoyl-benzo[f]chinoxalin-2,3-dion; CPP = (3-((R)-2-carboxypiperazin-4-yl)-propyl-1-phosphonic acid. Source data are provided as a Source data file.
Fig. 8
Fig. 8. Cx43 hemichannels mediate activity-dependent transfer of glutamine from astrocytes to synapses.
a Representative confocal (dark background) and thresholded binary (white background) images of hippocampal CA1 astrocytes dialyzed with RhGln (0.8 mM, 20 min) via the patch pipette under control or stimulated (10 Hz, 30 s every 3 min for 20 min) conditions in acute slices obtained from: wild-type mice (+/+), glial conditional Cx43 knockout mice (−/−) or wild-type mice exposed to Gap26 (+/+ Gap26) or Gap26 scramble (+/+Src) peptides. The binary images were quantified by Sholl analysis (b) and total punctate area (c). In +/+ mice, repetitive synaptic stimulation strongly increased the punctate RhGln-labeling compared to control as shown by both Sholl analysis (+/+: Ct, n = 12; Stim, n = 9, p < 0.0001, two-way ANOVA in b) and total punctate area (p < 0.0001 between Ct and Stim in +/+, one-way ANOVA with Bonferroni’s post hoc test in c). This was abolished in −/− mice (−/−: Ct, n = 7; Stim, n = 5, p = 0.0826, two-way ANOVA in b; p > 0.999 between Ct and Stim in −/−, and p = 0.0002 between +/+ Stim and −/− Stim, one-way ANOVA with Bonferroni’s post hoc test in c) or in the presence of Gap26 (+/+ Gap26: Ct, n = 8; Stim, n = 5, p = 0.0651, two-way ANOVA in b; p > 0.999 between Ct and Stim in +/+ Gap26, and p < 0.0001 between Stim of +/+ and +/+ Gap26, one-way ANOVA with Bonferroni’s post hoc test in c), but unchanged in the presence of the scramble Gap26 peptide (+/+Src: Ct, n = 5; Stim, n = 4, p < 0.0001, two-way ANOVA in b; p = 0.025 between Ct and Stim with +/+ Src, and p < 0.0001 between Stim of +/+ Gap26 and +/+ Src, one-way ANOVA with Bonferroni’s post hoc test in c). Gap26 alone also inhibited the spread of glutamine, suggesting a basal transfer of glutamine into synaptic structures which is dependent on Cx43 HC activity (p < 0.0001 between +/+ Gap26 Ct and +/+ Gap26 Stim, two-way ANOVA in b). Mean ± SEM in (b), (c). Scale bar: a 20 µm. Asterisks indicate statistical significance (***p < 0.001; *p < 0.05). Source data are provided as a Source data file.
Fig. 9
Fig. 9. Restoring in vivo Cx43 expression in hippocampal astrocytes from Cx43−/− mice rescues activity-dependent transfer of glutamine.
a Sample image of the hippocampus of Cx43−/− mice injected intra-hippocampally with rAAV2/9-GFAP-Cx43-GFP virus, showing numerous cells expressing Cx43-GFP in the CA1 area. The blue box is magnified on the right. b RhGln (magenta) was loaded into a Cx43-GFP expressing astrocyte (yellow) via a patch pipette as shown. Arrow head indicates the patched cell. c Sample images after immunostaining showing specific expression of Cx43 (cyan) in Cx43-GFP-positive (yellow) astrocytes (GFAP, magenta). The yellow box is magnified in the bottom row. Solid and dotted white lines outline GFP-positive and -negative astrocytes, respectively. dg Cx43−/− mice first received either rAAV2/9-GFAP-Cx43-GFP (−/− Cx43 Rescue, d left, e and g) or rAAV2/9-GFAP-GFP (−/− GFP Control, d right, f and g) virus. Hippocampal astrocytes were then dialyzed with RhGln under either control or synaptic stimulation (10 Hz, 30 s) conditions for 20 min. Both representative confocal (dark background) and thresholded binary (white background) images are shown in (d) for each condition. The binary images were quantified by Sholl analysis (e, f) and total punctate area (g). The stimulation-induced transfer of RhGln was rescued in Cx43−/− mice (n = 5) by restoring Cx43 expression selectively in astrocytes via viral infection shown by both Sholl analysis (−/− Cx43 rescue, n = 4, p < 0.0001, two-way ANOVA for e) and total punctate area (p = 0.0031 between Ct and Stim with −/− Cx43 Rescue, one-way ANOVA with Bonferroni’s post hoc test for g) as compared to the GFP control infection (−/− GFP Ct, n = 3; Stim, n = 3, p = 0.9856, two-way ANOVA for f, p > 0.999 between Ct and Stim with −/−GFP Control and p < 0.0001 between Stim of −/− Cx43 Rescue and −/− GFP Control, one-way ANOVA with Bonferroni’s post hoc test for g). Mean ± SEM in (e)–(g). Scale bars: a 200 µm (left) and 50 µm (right); b 50 µm (top) and 20 µm (bottom); c, d 20 µm. Asterisks indicate statistical significance (***p < 0.001; **p < 0.01). Representative images a, b from replicates described in (g); c are from n = 3 replicates. Source data are provided as a Source data file.
Fig. 10
Fig. 10. Astroglial glutamine supply via Cx43 hemichannels sustains glutamatergic synaptic transmission and is required for novel object recognition memory.
a Schematics depicting recording of field excitatory postsynaptic potentials (fEPSP, field recording) evoked by Schaffer collaterals (SC) stimulation in the CA1 region of hippocampal slices. b Representative trace for fEPSP recorded during stimulation (10 Hz, 30 s) is presented with the first 10 responses magnified in inset. c Sample traces are shown for fEPSPs recorded before (1), at the start of (2), during (3), and at the end of (4) the stimulation. d, e Plots of fEPSP slope normalized to baseline upon 10 Hz stimulation show a decrease in synaptic transmission in slices from −/− (d, n = 11, p < 0.0001) or with Gap26 treatment (e, +/+Gap26, n = 9, p < 0.0001) as compared to +/+ (n = 11 for d, n = 14 for e), whereas there was no effect of the scramble Gap26 treatment (e, +/+Scr, n = 6, p = 0.9994 with +/+, p < 0.0001 with +/+Gap26) (two-way ANOVA). Numbers 1–4 in d correspond to regions referred to in (c). fg Glutamine pre-treatment (4 mM, 1–4 h) in −/− slices (f, n = 16 for −/−, n = 8 for −/−Gln, p < 0.0001) and Gap26-treated slices (g, n = 9 for +/+Gap26, n = 7 for +/+Gap26 Gln, p < 0.0001) rescued transmission to +/+ levels (two-way ANOVA). +/+ plot is shown for comparison. h Glutamine pre-treatment alone in +/+ mice had no effect (n = 16 for +/+, n = 8 for +/+Gln, p > 0.9999, two-way ANOVA). i Mice underwent intra-hippocampal injections of either Gap26 scramble (1 mM), Gap26 (1 mM), or Gap26 (1 mM)+Glutamine (200 mM) 30 min before being submitted to the novel object recognition task which consisted of first an acquisition trial (T1, exploration of 2 similar objects) and then 24 h later to a restitution trial (T2, exploration of a familiar object “F” from T1 and a novel object “N”). j Percent exploration time revealed a loss of preference for the novel object in mice treated with Gap26, but was rescued by co-injection of glutamine (Gap26 + Gln). n = 10 in each condition (p < 0.0001 between F and N with Src, p = 0.2368 between F and N with Gap26, p < 0.0001 between F and N with Gap26+Gln, two-way ANOVA with Bonferroni’s post hoc test). Mean ± SEM in (dh) and (j). Scale bars: b 0.2 mV, 5 s (full trace), 100 ms (inset); c 0.2 mV, 10 ms. Asterisks indicate statistical significance (***p < 0.001). Source data are provided as a Source data file.

Comment in

References

    1. Rothstein JD, et al. Knockout of glutamate transporters reveals a major role for astroglial transport in excitotoxicity and clearance of glutamate. Neuron. 1996;16:675–686. - PubMed
    1. Danbolt NC, et al. Properties and localization of glutamate transporters. Prog. Brain Res. 1998;116:23–43. - PubMed
    1. Bak LK, Schousboe A, Waagepetersen HS. The glutamate/GABA-glutamine cycle: aspects of transport, neurotransmitter homeostasis and ammonia transfer. J. Neurochem. 2006;98:641–653. - PubMed
    1. Schousboe A, et al. Trafficking between glia and neurons of TCA cycle intermediates and related metabolites. Glia. 1997;21:99–105. - PubMed
    1. Hertz L, Dringen R, Schousboe A, Robinson SR. Astrocytes: glutamate producers for neurons. J. Neurosci. Res. 1999;57:417–428. - PubMed

Publication types

MeSH terms