. 2022 Feb 8;13(1):709.
doi: 10.1038/s41467-022-28131-z.

Amylin-Calcitonin receptor signaling in the medial preoptic area mediates affiliative social behaviors in female mice

Affiliations

Amylin-Calcitonin receptor signaling in the medial preoptic area mediates affiliative social behaviors in female mice

Kansai Fukumitsu et al. Nat Commun. .

Abstract

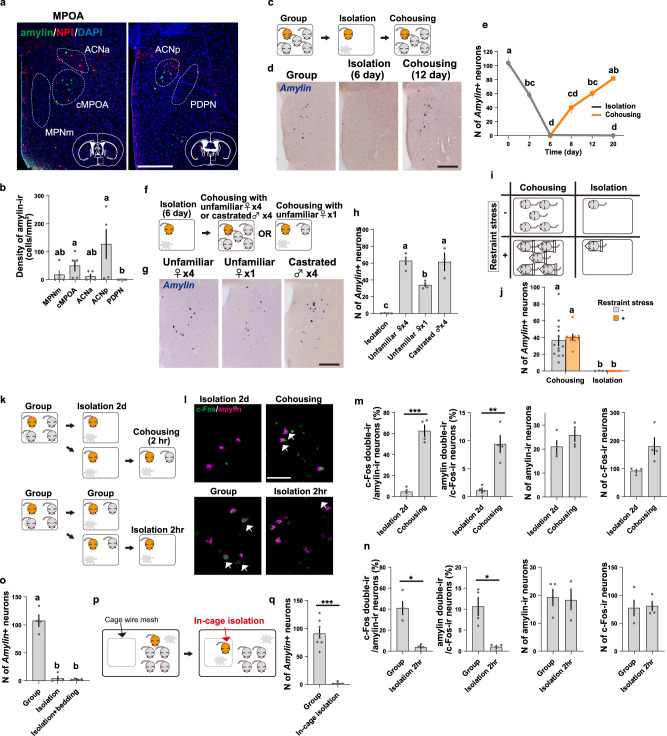
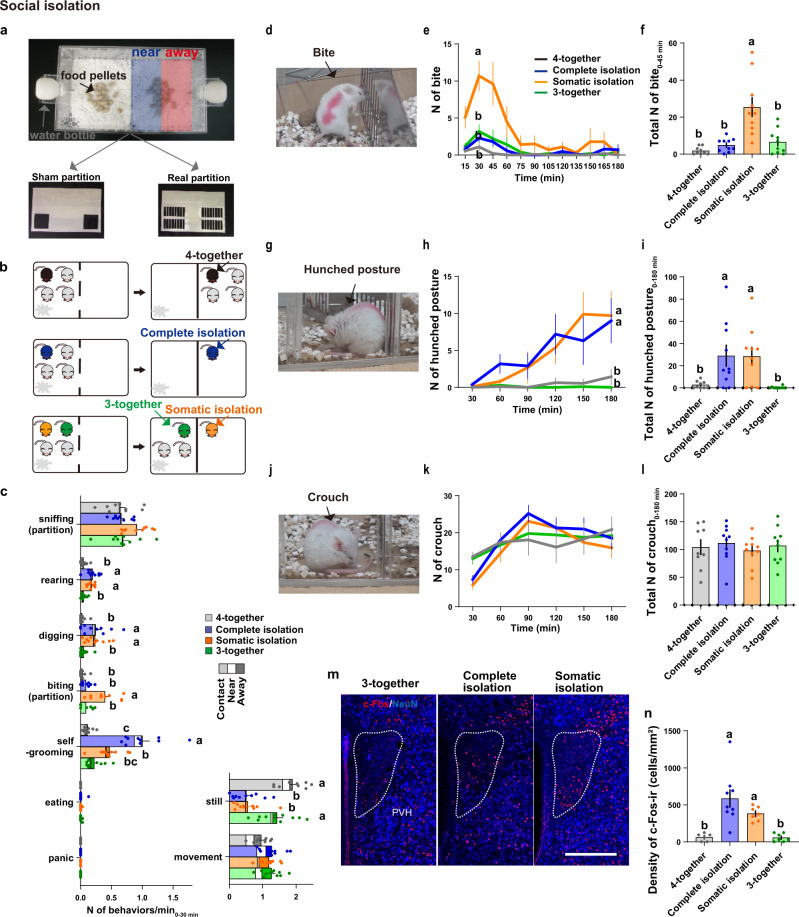
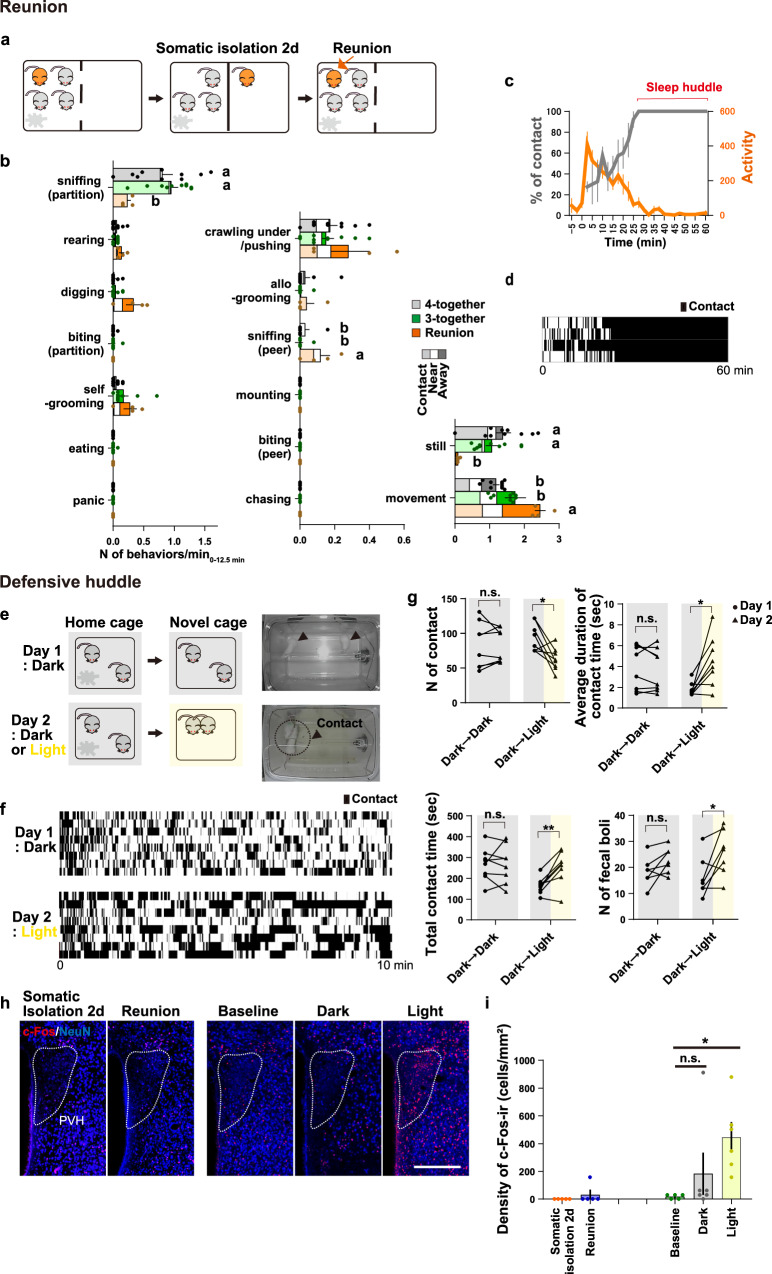
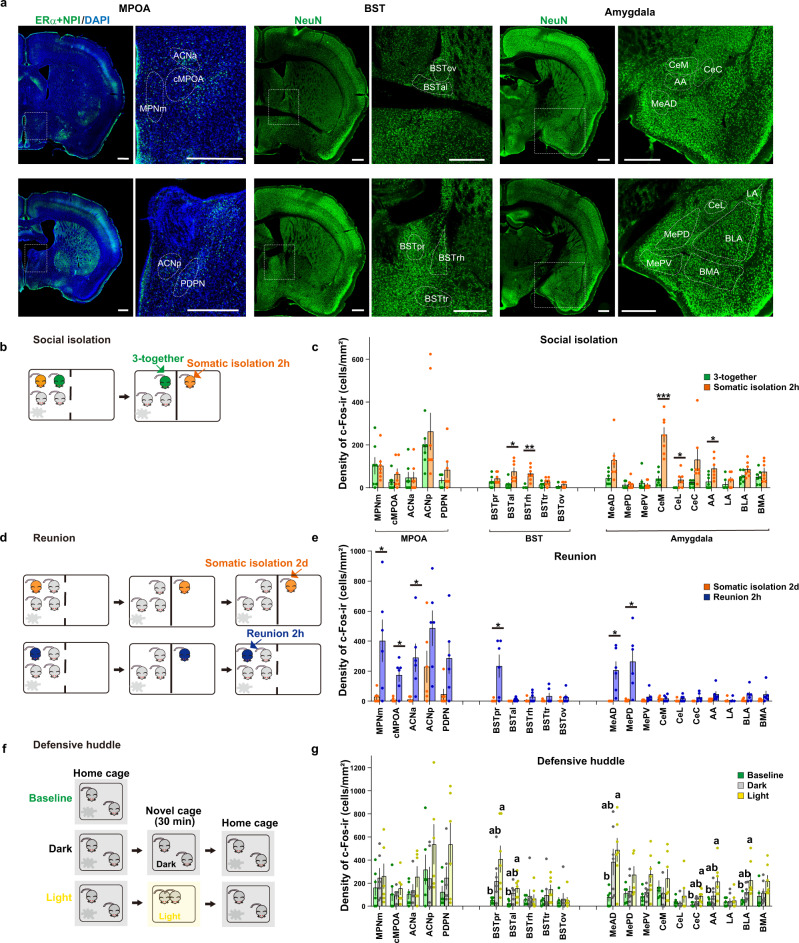
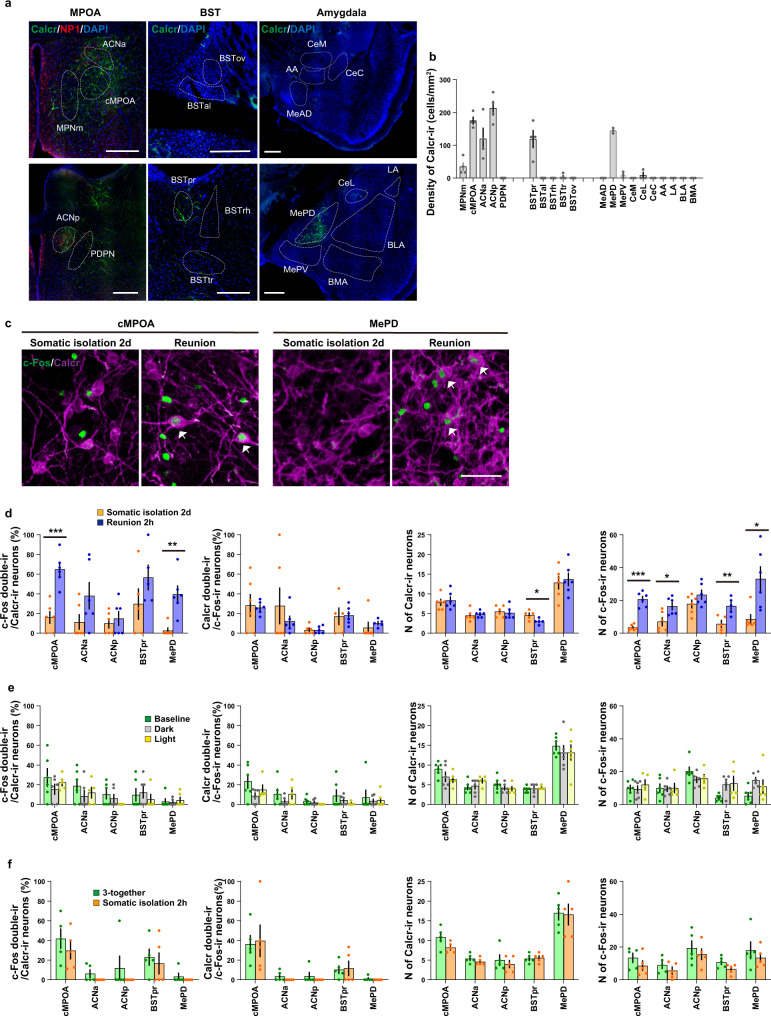
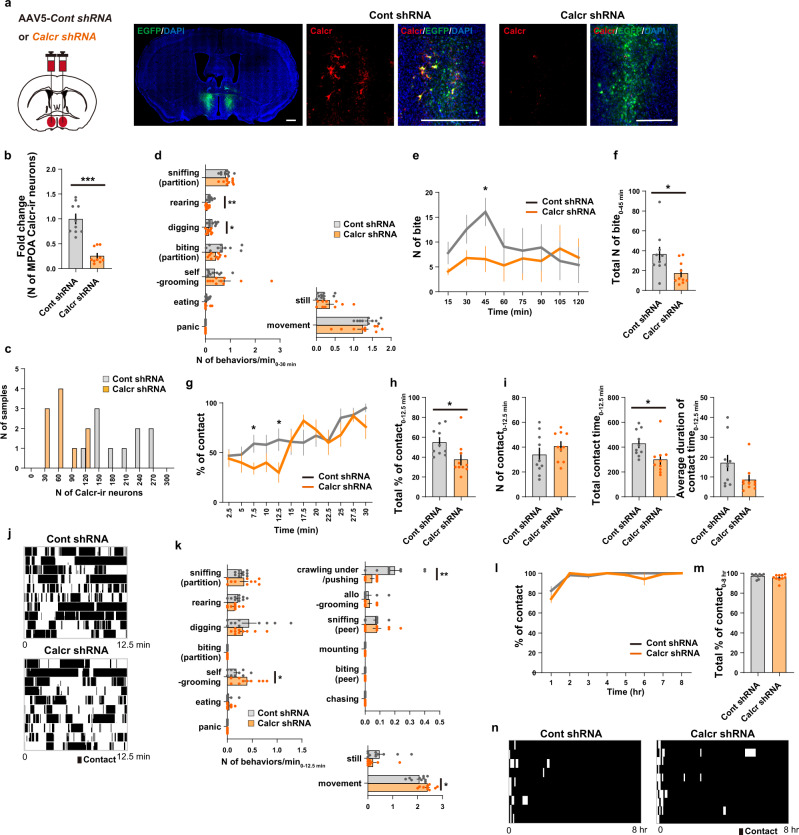
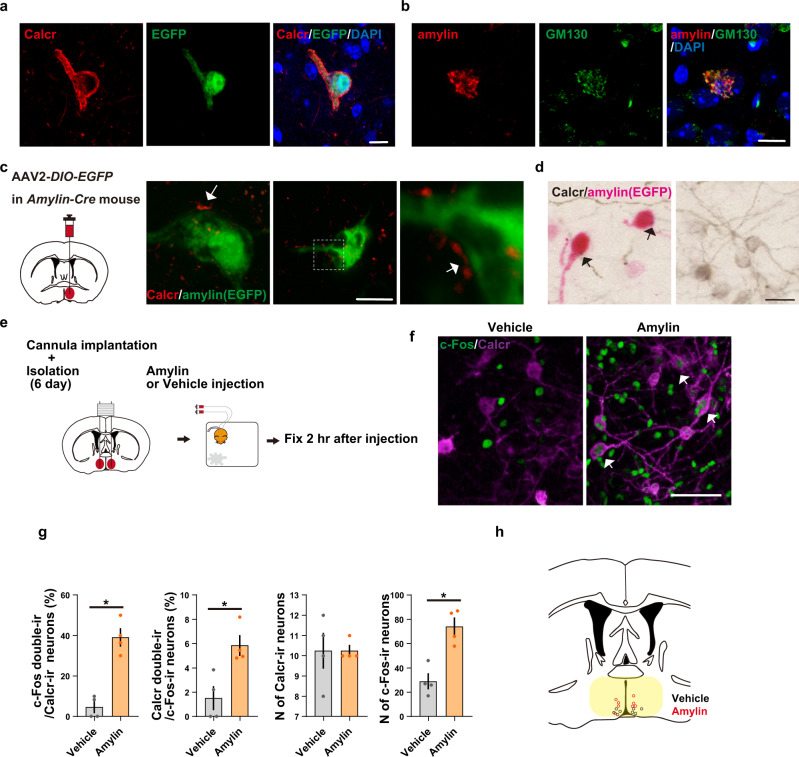
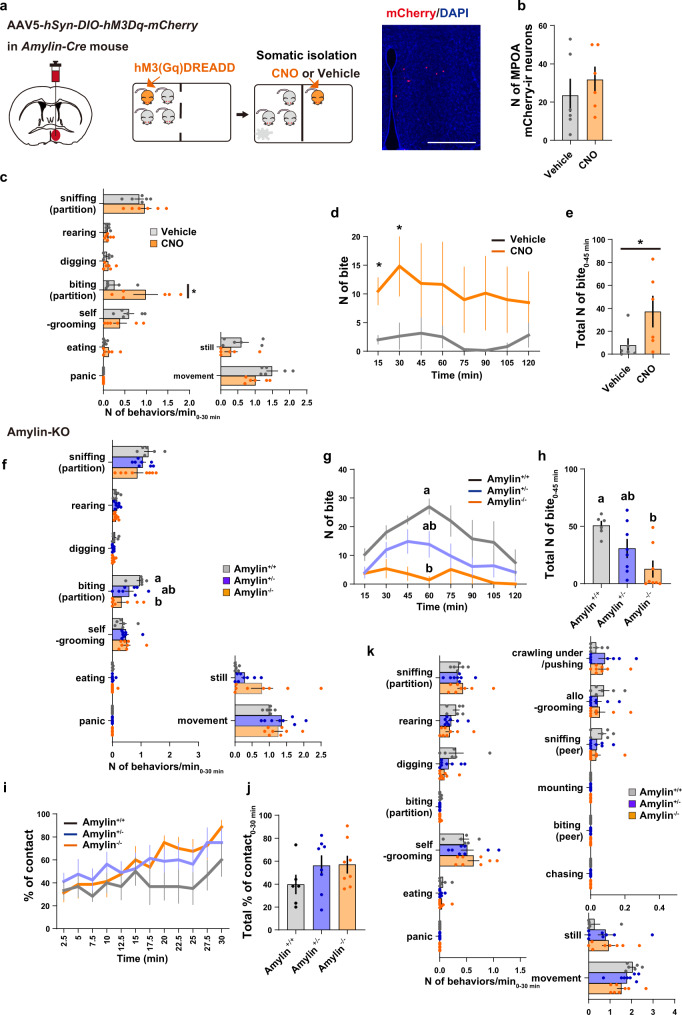
Social animals actively engage in contact with conspecifics and experience stress upon isolation. However, the neural mechanisms coordinating the sensing and seeking of social contacts are unclear. Here we report that amylin-calcitonin receptor (Calcr) signaling in the medial preoptic area (MPOA) mediates affiliative social contacts among adult female mice. Isolation of females from free social interactions first induces active contact-seeking, then depressive-like behavior, concurrent with a loss of Amylin mRNA expression in the MPOA. Reunion with peers induces physical contacts, activates both amylin- and Calcr-expressing neurons, and leads to a recovery of Amylin mRNA expression. Chemogenetic activation of amylin neurons increases and molecular knockdown of either amylin or Calcr attenuates contact-seeking behavior, respectively. Our data provide evidence in support of a previously postulated origin of social affiliation in mammals.


Conflict of interest statement

The authors declare no competing interests.

Figures

Fig. 1
Fig. 1. Amylin mRNA expression in the MPOA depends on direct social contacts.
a Distribution of amylin-immunoreactivity (ir, green) neurons, NPI-ir (red) and DAPI staining (blue) in two coronal brain sections (left: anterior, right: posterior) from a group-housed female mouse. The conservative contours of the MPOA subregions are overlayed. Scale bar, 300 μm. b Density of amylin-containing neurons in each subregion (n = 5 mice per group). ce) Social isolation abolishes and cohousing increases Amylin mRNA expression in the MPOA. d, g Amylin mRNA detected by (ISH, blue) in the MPOA. Scale bar, 250 μm. e Quantification of the number (N) of MPOA neurons expressing Amylin mRNA, 0-day, 6-day: n = 7 mice, 2-day: n = 10, other groups: n = 6. (fh) Cohousing with four unfamiliar females or with four unfamiliar castrated males effectively maintained Amylin mRNA expression. (h) Quantification of the number of neurons expressing Amylin mRNA in the MPOA (castrated male group: n = 3 mice, other groups: n = 4). (i, j) Repeated restraint stress did not affect Amylin mRNA expression in the MPOA. (j) Quantification of the number of neurons expressing Amylin mRNA in the MPOA. (isolation + non-stressed group: n = 4, isolation+stressed group: n = 6, group+non-stressed: n = 13, group+stressed group: n = 9). (kn) Activation of amylin-ir neurons after isolation or cohousing. (k) Top: group-housed female mice were isolated for 2 days and then cohoused for 2 h or kept isolated. Bottom: female mice housed in group were isolated for 2 h or kept in group. (l) Distribution of amylin-ir (magenta) and c-Fos-ir (green) neurons in the MPOA. Arrows: double-labeled cells. Scale bar, 50 μm. (m, n) Number of amylin-ir and c-Fos-ir neurons, percentage of amylin-ir neurons among the c-Fos-ir neurons, percentage of c-Fos-ir neurons among the amylin-ir neurons in the MPOA (n = 4 mice per group). (o) Chemosignals from cage mates had no impact on Amylin mRNA expression. Soiled bedding from cage mates was introduced daily to the cages of isolated mice (n = 4 mice per group). (p, q) In-cage isolation depleted Amylin mRNA expression (group-housed group: n = 8 mice, in-cage isolation group: n = 4). See Supplementary Fig. S1f for details. Asterisks indicate significant differences between two groups (Welch’s unpaired t-test; *p < 0.05, **p < 0.01, ***p < 0.001). The letters indicate significant differences (b: Kruskal-Wallis test with Benjamini-Krieger FDR, e: Welch’s ANOVA with Dunnett’s T3 multiple comparison test, two-sided, h, o: one-way ANOVA with Tukey’s multiple comparison test, j: two-way ANOVA with Sidak’s multiple comparison test, p < 0.05). Graphs show mean ± SEM. See Supplementary Data for exact p values and details of statistical analyses.
Fig. 2
Fig. 2. Social isolation induces a two-stage response in female mice.
a The experimental cage used for social isolation-reunion test. A sham (left) or real (right) partition was placed in the middle of the cage. The blue and red areas indicate the mouse positioning in the cage analyzed in (c). b Four different social conditions were created by replacing the partition as explained in the text. (c) Quantification of behaviors, coded at 15-s intervals for 30 min under different social conditions (n = 10 mice per group). The distribution of the positions at which mice performed the behavior is represented by the bar shading (light, none, dark). The letters indicate significant differences (Welch’s ANOVA with Dunnett’s T3 multiple comparison test, two-sided for partition-biting, Welch’s ANOVA with Benjamini and Krieger FDR test, two-sided for digging, and one-way ANOVA with Tukey’s multiple comparison test for other behaviors, p < 0.05). (dl) Analysis of the partition-biting behavior (df), hunched posture (gi), and crouch (jl) after adding the real partition. Pictures of typical behaviors (d, g, j), time course, and total number (N) of behaviors recorded at 15-sec intervals during 45 min (ef) for biting and during 180 min for the hunched posture (hi) and crouch (kl) (4-together group: n = 9, other groups: n = 10 mice). The letters indicate significant differences (Welch’s ANOVA with Dunnett’s T3 multiple comparison test, two-sided in (e) and (f), Kruskal-Wallis test with Benjamini-Krieger FDR in (h), and Kruskal-Wallis test with Benjamini-Hochberg FDR in (i), p < 0.05). (m, n) PVH neuron activity assessed by c-Fos (red) and NeuN (blue) immunostaining. Scale bar, 250 μm. Somatic isolation and 3-together groups: n = 7 mice, 4-together group: n = 6, and complete isolation group: n = 9. The letters indicate significant differences (one-way ANOVA with Tukey’s multiple comparison test, p < 0.05). Graphs show mean ± SEM. See Supplementary Data for exact p values and details of statistical analyses.
Fig. 3
Fig. 3. Characterization of two types of social contacts: reunion and defensive huddle.
a Social reunion procedure. b Quantification of various behaviors, coded at 15-sec intervals for 12.5 min, after social reunion in the 3- or 4-together conditions. The distribution of the positions at which mice performed a given behavior is represented by the bar shading (light, none, dark). Reunion group: n = 4 mice, 4-together and 3-together groups: n = 10. The letters indicate significant differences (Welch’s ANOVA with Benjamini and Krieger FDR test for analyzing the peer-sniffing and one-way ANOVA with Tukey’s multiple comparison test for the other analyses, p < 0.05). (c) Time course analysis of social contact (gray) and locomotor activity (orange) after reunion. Time bins: 30 s (locomotion) and 15 s (contact), n = 4 mice. d Raster plots of social contact bouts. e Left panel: light-induced defensive huddle procedure. Two female mice were transferred from their home cage to the dark/light novel cage during the dark period (Day 1: dark novel cage, Day 2: dark or bright novel cage). Right panel: representative pictures of the control dark condition (top) and the defensive huddle seen in the stressful light condition (bottom). f Raster plots of mouse social contact bouts in the dark or light conditions. (g) Number (N) of contacts, total contact time, average duration of the contacts, and number of fecal boli determined in each condition after 10 min (n = 8 mice per group). Asterisks indicate significant differences between two groups (paired t-test; *p < 0.05, **p < 0.01). Videos recorded continuously for 10 min were used for analysis. (eg). (h) PVH neuron activity measured by c-Fos (red) and NeuN immunostaining (blue). Scale bar, 250 μm. (i) Density of c-Fos-immunoreactive (c-Fos-ir) neurons in the PVH after distinct social stimulations (dark and light condition: n = 6 mice, 2 days (2d) somatic isolation, reunion, and baseline conditions: n = 5). Astarisks indicate significant differences between baseline and light groups (one-way ANOVA with Dunnett’s multiple comparison test, two-sided, *p < 0.05). Data represent mean ± SEM. See Supplementary Data for exact p values and details of statistical analyses.
Fig. 4
Fig. 4. Activation mapping of the preoptic-strial-amygdala subregions after somatic isolation, reunion, and light-induced defensive huddle.
a Conservative contours of the preoptic-strial-amygdala subregions, in which c-Fos-immunoreactive neurons were counted. Coronal sections were stained for NPI and ERα (both in green) and DAPI (blue) in the MPOA or NeuN (green) in the BST or amygdala. MPNm, the medial part of the medial preoptic nucleus; cMPOA, the central part of medial preoptic area; ACN, the anterior commissural nucleus; PDPN, the posterodorsal preoptic nucleus; BSTpr, the principal nucleus of the BST; BSTal, the anterolateral part of the BST; BSTrh, the rhomboid nucleus of the BST; BSTtr, the transverse nucleus of the BST; BSTov, the oval nucleus of the BST; MeAD, the anterodorsal part of the medial amygdala; MePD, the posterodorsal part of the medial amygdala; MePV, the posteroventral part of the medial amygdala; CeM, the medial part of the central amygdala; CeL, the lateral part of the central amygdala; CeC, the capsular part of the central amygdala; AA, the anterior amygdaloid area; LA, the lateral amygdala; BLA, the basolateral amygdala; BMA, the basomedial amygdala. Scale bars, 500 μm. b, d, f Somatic isolation (b), reunion (d), or defensive huddle (f) procedures. c, e, g Density of c-Fos-immunoreactive neurons (c-Fos-ir) in each subregion observed in controls and 2 h after the social condition change (3-together and 2 h of somatic isolation groups: n = 7 mice; somatic isolation 2d and 2 h reunion groups: n = 6; 2 h after the exposure to dark or light novel conditions: n = 7; baseline condition: n = 5). Asterisks in (c) and (e) indicate significant differences between 2 groups (Welch’s unpaired t-test; *p < 0.05, **p < 0.01, ***p < 0.001). The letters indicate significant differences (Welch’s ANOVA with Benjamini and Krieger FDR test, two-sided for data from the BSTpr and one-way ANOVA with Tukey’s multiple comparison test for the other data, p < 0.05). Graphs show mean ± SEM. See Supplementary Data for exact p values and details of statistical analyses.
Fig. 5
Fig. 5. Distribution of Calcr+ neurons in the preoptic-strial-amygdala subregions and their activation during somatic isolation, reunion, and light-induced defensive huddle.
a Representative coronal brain sections showing the distribution of Calcr immunoreactivity (Calcr-ir, green), NPI-ir (red), and DAPI staining (blue) in the preoptic-strial-amygdala subnuclei. Scale bars, 300 μm. b Density of Calcr-ir neurons in each subregion. (MPOA and BST: n = 4 mice, amygdala: n = 3). c, d Distribution of Calcr-ir (magenta) and c-Fos-ir (green) neurons in the cMPOA or MePD after social reunion. Arrowheads indicate double-labeled cells. Scale bar, 50 μm. d Percentage of Calcr-ir neurons expressing c-Fos, percentage of c-Fos-ir neurons expressing Calcr, number (N) of Calcr-ir neurons and c-Fos-ir neurons in each subregion after reunion (n = 6 mice per group). e Percentage of Calcr-ir neurons expressing c-Fos, percentage of c-Fos-ir neurons expressing Calcr, number of Calcr-ir and c-Fos-ir neurons in each subregion after light-induced defensive huddle procedure (baseline and dark: n = 6 mice, light: n = 5). f Percentage of Calcr-ir neurons expressing c-Fos, percentage of c-Fos-ir neurons expressing Calcr, number of Calcr-ir and c-Fos-ir neurons induced in each subregion by 2 h of somatic isolation (n = 5 mice per group). Asterisks in (d) indicate significant differences between two groups (Welch’s unpaired t-test, *p < 0.05, **p < 0.01, ***p < 0.001). Graphs show mean ± SEM, dots represent individual data. See Supplementary Data for exact p values and details of statistical analyses.
Fig. 6
Fig. 6. Targeted knockdown of Calcr in the cMPOA blocks behavioral responses to somatic isolation and reunion.
a Left panel: experimental procedure. Two weeks prior to testing, female mice were injected with AAVs expressing shRNA-EGFP for the specific knockdown of Calcr (Calcr shRNA) or with a virus carrying scrambled shRNA (Cont shRNA). Other panels: representative coronal sections of shRNA-EGFP viral expression in the cMPOA showing the efficacy of Calcr shRNAs. Scale bars, 500 μm. b, c Quantification of number (N) of Calcr-immunoreactive (Calcr-ir) neurons in the MPOA (n = 10 mice per group). The number of Calcr-ir neurons significantly decreased in the cMPOA after Calcr shRNA injection. d Quantification of behaviors (number of occurrences per min) seen during somatic isolation for 30 min (n = 10 mice per group). e Time course analysis of the biting responses (n = 10 mice per group). (f) Total number of biting responses occurring during 45 min (n = 10 mice per group). g Percentage of social contacts (number of occurrences divided by total number of observations at a time point) over time (n = 10 mice per group). h Percentage of social contacts (total number of occurrences divided by total number of observations) during 12.5 min. (i) Quantification of the number of contacts, total contact time, and average duration of contact time. These data were analyzed using continuous video recording during 12.5 min (n = 10 mice per group). j Raster plots showing the effects of Calcr shRNA injection in the MPOA on social contacts. k Quantification of behaviors (number of occurrences per min) seen during social reunion for 12.5 min (n = 10 mice per group). l Analysis of the percentage of social contacts (number of occurrences divided by total number of observations at a time point) over time (Cont shRNA: n = 9 mice and Calcr shRNA: n = 10). (m) Percentage of social contacts (total number of occurrences divided by total number of observations) during 8 h (Cont shRNA: n = 9 mice and Calcr shRNA: n = 10). n Raster plots showing the effects of Calcr shRNA injection in the MPOA on contacts. Time bins: 15 sec (dg, k) or 5 min (l–n). Asterisks in (b-f, g-i, k) indicate significant differences between two groups (Welch’s unpaired t-test, *p < 0.05, **p < 0.01, ***p < 0.001). Graphs show mean ± SEM. See Supplementary Data for exact p values and details of statistical analyses.
Fig. 7
Fig. 7. Spatial relationship between Calcr+ and amylin+ neurons and the activation of Calcr+ neurons by amylin.
(a) Localization of Calcr (red) on the plasma membrane of EGFP + neurons (green). Coronal sections of the cMPOA were stained with anti-Calcr antibodies and DAPI (blue). Scale bars, 10 μm. (b) Amylin localization in the Golgi apparatus. Sections were stained with antibodies recognizing amylin (red) and GM130 (green), a cis-Golgi matrix protein. Scale bars, 10 μm. (c, d) The anterograde fibers of Calcr-immunoreactive (Calcr-ir) neurons lie in the vicinity of amylin+ neurons (green). Coronal sections of the MPOA of group-housed Amylin-Cre female mice injected with Cre-dependent EGFP AAV vector into the cMPOA. Sections were stained with anti-Calcr (red or black) antibodies. Images were taken with confocal (c) or bright-field (d) microscopes. Scale bars, 10 μm (c) and 25 μm (d). (e) Experimental procedure. Six days before amylin infusion, group-housed female mice were equipped with guide cannula and single-housed. Two hours after local amylin or vehicle infusion in vivo, the mice were subjected to perfusion fixation for immunochemical studies. (f) Distribution of Calcr (magenta) and c-Fos (green) in the cMPOA with or without amylin infusion. Arrowheads indicate double-labeled cells. Scale bar, 50 μm. (g) Percentage of Calcr-ir neurons expressing c-Fos, percentage of c-Fos-ir neurons expressing Calcr, number (N) of Calcr-ir and c-Fos-ir neurons in the MPOA after amylin infusion (n = 4 mice per group). (h) Schematic coronal section showing the location of the injection cannula tips. Black (red) circles indicate individual cannula tips used for vehicle (amylin) infusion. The yellow zone corresponds to the assumed spreading area of the injected blue dye. Asterisks indicate significant differences between two groups (Mann-Whitney U test, two-sided, *p < 0.05). Graphs show mean ± SEM. See Supplementary Data for exact p values and details of statistical analyses.
Fig. 8
Fig. 8. Amylin signaling is required for contact-seeking behavior.
ae Contact-seeking and partition-biting behaviors were induced by chemogenetic activation of amylin+ neurons. Amylin-Cre female mice were unilaterally injected with AAV5-hSyn-DIO-hM3D(Gq)-mCherry in the MPOA. After 2 weeks, virus-injected mice were subcutaneously injected with CNO or vehicle 30 min before testing. a Experimental procedures and representative picture showing mCherry-ir neurons (red). Scale bar, 500 μm. b Number (N) of mCherry-ir neurons in the MPOA. c Quantification of behaviors (numbers of occurrences per min) observed after somatic isolation for 30 min. d Time course analysis of the biting responses. e Total numbers of biting responses during 45 min (n = 6 mice per group). Asterisks indicate significant differences between two groups (Mann-Whitney U test, *P < 0.05). fk The somatic isolation-induced biting behavior was decreased in Amylin knockout female mice. f Quantification of behaviors (number of occurrences per min) seen after somatic isolation during 30 min. (g) Time course analysis of the biting behavior. h Number of biting responses observed after somatic isolation during 45 min. i Time course analysis of social contacts. (j) Percentage of social contacts (total number of occurrences divided by total number of observations) during 30 min. k Quantification of behaviors (number of occurrences per min) observed after social reunion during 30 min at 15-s intervals (amylin + /+: n = 6 mice, amylin + /- and amylin-/-: n = 8). The letters in (fh) indicate significant differences (Kruskal-Wallis test with Dunn’s multiple comparison test, two-sided, p < 0.05). Graphs show mean ± SEM. See Supplementary Data for exact p values and details of statistical analyses.

Similar articles

Cited by

References

    1. House JS, Landis KR, Umberson D. Social relationships and health. Science. 1988;241:540–545. - PubMed
    1. Holt-Lunstad J, Smith TB, Layton JB. Social relationships and mortality risk: a meta-analytic review. PLoS Med. 2010;7:e1000316. - PMC - PubMed
    1. Poole, T. B. Social behaviour in mammals (Blackie; Distributed in the USA by Chapman and Hall, Glasgow, New York, 1985).
    1. Wilson, E. O. Sociobiology: the new synthesis (Belknap Press, 1975).
    1. Rubenstein, D. R. & Abbot, P. Comparative social evolution (Cambridge University Press, Cambridge, United Kingdom, 2017).

Publication types

Substances

LinkOut - more resources