. 2022 Feb 8;13(1):754.
doi: 10.1038/s41467-022-28377-7.

A Mediator-cohesin axis controls heterochromatin domain formation

Affiliations

A Mediator-cohesin axis controls heterochromatin domain formation

Judith H I Haarhuis et al. Nat Commun. .

Abstract

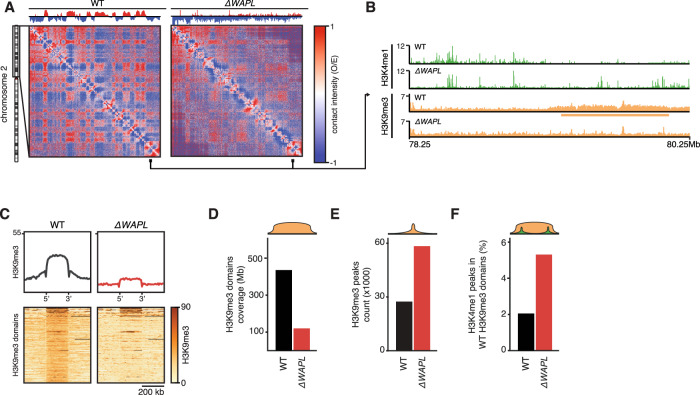
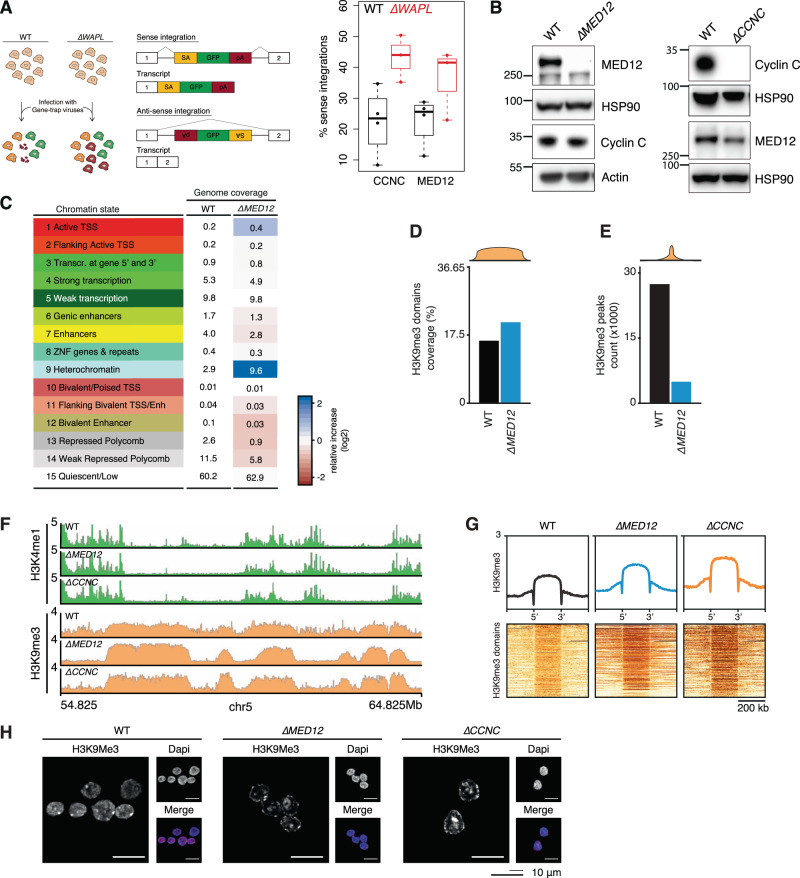
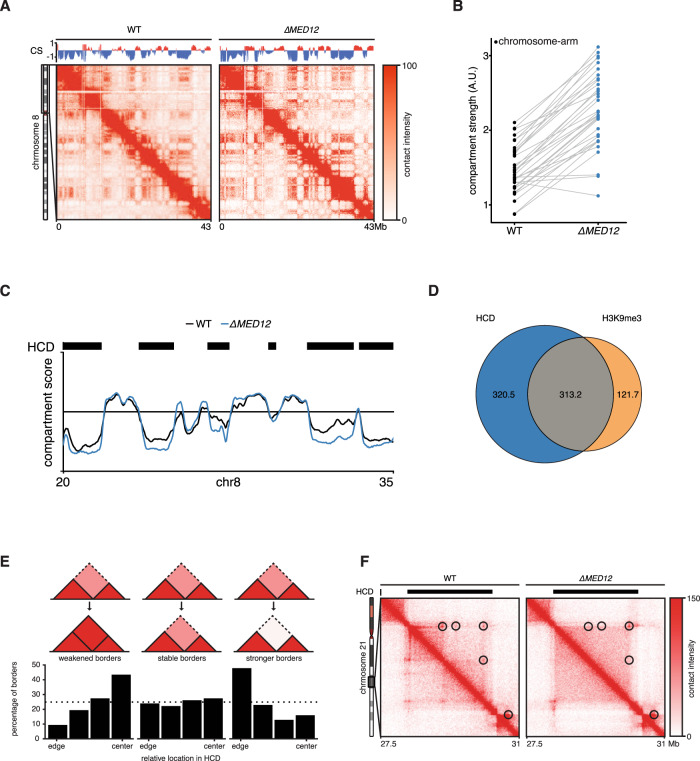
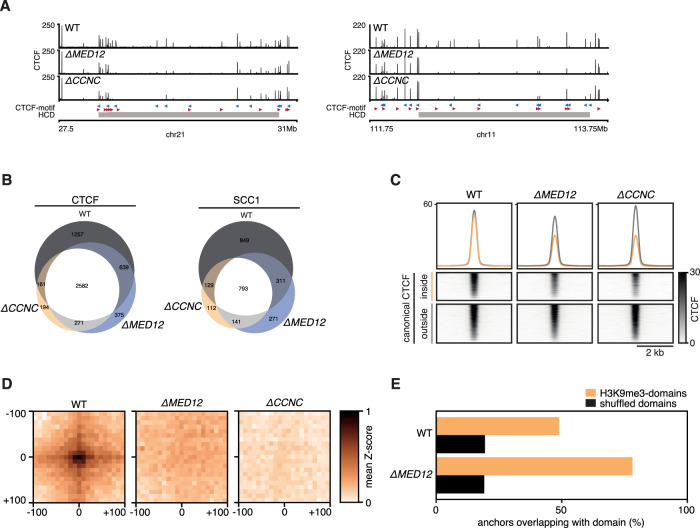
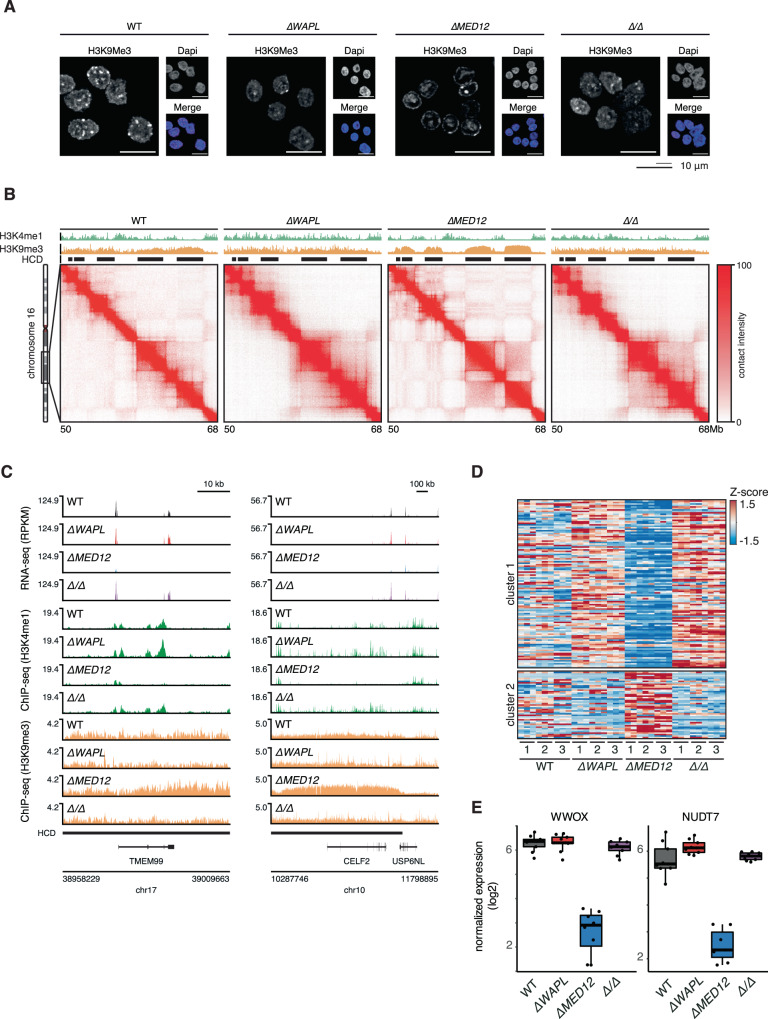
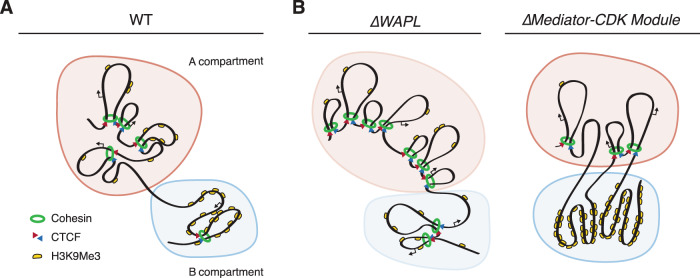
The genome consists of regions of transcriptionally active euchromatin and more silent heterochromatin. We reveal that the formation of heterochromatin domains requires cohesin turnover on DNA. Stabilization of cohesin on DNA through depletion of its release factor WAPL leads to a near-complete loss of heterochromatin domains. We observe the opposite phenotype in cells deficient for subunits of the Mediator-CDK module, with an almost binary partition of the genome into dense H3K9me3 domains, and regions devoid of H3K9me3 spanning the rest of the genome. We suggest that the Mediator-CDK module might contribute to gene expression by limiting the formation of dense heterochromatin domains. WAPL deficiency prevents the formation of heterochromatin domains, and allows for gene expression even in the absence of the Mediator-CDK subunit MED12. We propose that cohesin and Mediator affect heterochromatin in different ways to enable the correct distribution of epigenetic marks, and thus to ensure proper gene expression.


Conflict of interest statement

E.d.W. is a cofounder of Cergentis B.V., T.R.B. is cofounder and SAB member of Haplogen GmbH and cofounder and managing director of Scenic Biotech. The remaining authors declare no competing interests.

Figures

Fig. 1
Fig. 1. Stabilization of cohesin results in the loss of H3K9Me3 domains.
A Observed over expected (O/E) Hi-C matrixplots at 100 kb resolution show the contact frequencies for wild-type (WT) and ∆WAPL cells for the p-arm of chromosome 2. Contact matrices are visualized using GENOVA. Segregation of the genome into A and B compartments is quantified using the compartment score, shown above the matrix. B ChIPseq tracks for H3K4me1 and H3K9me3 in WT and ∆WAPL cells. Orange rectangle indicates the position of a H3K9me3 domain. C Alignment of H3K9me3 signal on H3K9me3 domains identified in WT H3K9me3 ChIPseq data. Average signal is shown on top, bottom shows heatmap of the raw signal. D Quantification of the genomic coverage of the H3K9me3 domains in WT and ∆WAPL cells. E Quantification of the total number of H3K9me3 peaks in WT and ∆WAPL cells. F Percentage of H3K4me1 peaks found in genomic regions that are identified as H3K9me3 peaks in WT cells.
Fig. 2
Fig. 2. Mediator-CDK subunits restrict heterochromatin.
A Left panel shows schematic explanation of the haploid genetic gene trap assay. Sense integrations with respect to a protein coding gene result in truncating deletion. Anti-sense integrations are largely inconsequential and serve as a control for accessibility of the gene. Right panel shows percentage of sense integrations (over a total of sense and anti-sense) shown for WT and ∆WAPL cells for the Mediator subunits Cyclin-C (CCNC) and MED12. Boxplot shows the result of n = 3 haploid genetic gene trap assays for WT and ∆WAPL cells. Boxes indicate the interquartile range (IQR) of the data (25–75%) and box center line indicates the median. Whiskers extend to the minimum or maximum value that lies no further than 1.5 times the IQR from the bottom or top of the box, respectively. B Western blot analysis confirming knock-out of MED12 and Cyclin-C. HSP90 and actin represent loading controls for MED12 and Cyclin-C panels directly above. Representative images are shown from experiments that have been performed twice. C ChromHMM analysis segmenting the genome in 15 chromatin states shown for WT and MED12 cells. Table shows the percentage of genome coverage. Red/blue color scale indicates the relative increase or decrease in ∆MED12 compared to the WT cells. D Barplot showing the coverage of H3K9me3 domains over the genome and (E) the absolute number of H3K9me3 peaks. F Example region showing the H3K4me1 (green) and H3K9me3 (orange) ChIPseq profiles in WT, ∆MED12 and ∆CCNC cells. G Aggregate plots showing the average H3K9me3 signal over all the H3K9me3 domains for WT and mutant cells. Heatmaps show the signal in and around individual domains. H Immunofluorescence analysis of H3K9me3 levels in WT, ∆MED12 and ∆CCNC cells. Representative images are shown from experiments that have been performed twice (see Supplementary Fig. 2e).
Fig. 3
Fig. 3. Loss of MED12 affects 3D genome organization.
A ICE normalized Hi-C contact matrices at 100 kb resolution for WT and ∆MED12 are shown for the p arm of chromosome 8. Above the matrices the compartment score is plotted. Contact matrices are visualized using GENOVA. B The compartment strength is calculated for all chromosome arms in WT and ∆MED12 cells. Lines connect scores for the same chromosome arm. C Compartment scores for a specific region on chromosome 8 for WT (black) and mutant (blue) cells. Black rectangles show hypercompartmentalized domains (HCDs) identified by a custom hidden markov model. D Venn diagram shows the overlap in genome-wide coverage between HCDs identified in ∆MED12 and H3K9me3 domains identified in WT cells. E TAD borders in HCDs were stratified into three categories depending on their difference in TAD separation (“weaker”, “unchanged”, “stronger”). The relative position within an HCD is plotted. F ICE normalized Hi-C contact matrix at 20 kb resolution for WT and ∆MED12 cells are shown for a region on chromosome 21. Contact matrices are visualized using GENOVA. Black rectangles indicate the position of HCD.
Fig. 4
Fig. 4. Mediator-CDK subunits control canonical CTCF-cohesin binding sites.
A Two example regions showing CTCF binding in WT, ∆MED12 and ∆CCNC cells. Gray rectangle indicates position of HCD B Venn diagram showing the overlap between CTCF and SCC1 peaks in WT, ∆MED12 and ∆CCNC cells. C Aggregate alignment of CTCF ChIPseq signal on canonical (i.e. CTCF/SCC1 co-bound sites) stratified for inside and outside a H3K9me3 domain. D Virtual loop anchorpoints were selected as intersection of CTCF and SCC1 sites that were in the top 10% with the strongest decrease in signal. Pairwise alignment of Hi-C signal (PE-SCAn) on virtual anchorpoints. E Relative enrichment of lost virtual anchorpoints inside H3K9Me3 domains versus expected based on circular permutation (shuffled).
Fig. 5
Fig. 5. MED12 maintains a transcription-permissible 3D genome organization.
A Immunofluorescence analysis of H3K9me3 levels in WT, ∆WAPL, ∆MED12 and ∆WAPL/∆MED12 (∆/∆) cells. Representative images are shown from experiments that have been performed twice (see Supplementary Fig. 5b). B ICE normalized Hi-C contact matrix at 20 kb resolution for WT, ∆MED12, ∆WAPL and ∆WAPL/∆MED12 cells are shown for a region on chromosome 16. Contact matrices are visualized using GENOVA. Black rectangles indicate the position of HCDs. C RNA-seq and ChIP-seq profiles of TMEM99 (left) and CELF2 (right) in WT, ∆MED12, ∆WAPL and ∆WAPL/∆MED12 cells. Triplicate datasets are overlayed per cell line. D RNAseq heatmap showing expression of genes in H3K9me3 domains. K-means clustering (k = 2) reveals a cluster of silenced genes in H3K9me3. E Boxplots show expression of two example genes on chromosome 16. Boxplots show the expression levels in the RNAseq experiments (n = 9) for all assayed genotypes. Boxes indicate the interquartile range (IQR) of the data (25–75%) and box center line indicates the median. Whiskers extend to the minimum or maximum value that lies no further than 1.5 times the IQR from the bottom or top of the box.
Fig. 6
Fig. 6. The Mediator CDK Module and cohesin play distinct and opposite roles in the genomic distribution of heterochromatin.
A Heterochromatin domains, marked by H3K9me3, cluster together in three-dimensional space, separating the genome in A- and B compartments. B Model for how cohesin and Mediator-CDK may play opposite roles in heterochromatin domain formation. Upon loss of the cohesin-release factor WAPL and stabilization of cohesin, loops increase in size, leading to a loss of compartmentalization. This perturbs the formation and spreading of heterochromatin domains. Loss of members of the Mediator-CDK-Module results in unconstrained heterochromatin-domain amplification and hyper-compartmentalization, impairing cohesin- and CTCF binding and a loss of associated loops.

References

    1. Rea S, et al. Regulation of chromatin structure by site-specific histone H3 methyltransferases. Nature. 2000;406:593–599. doi: 10.1038/35020506. - DOI - PubMed
    1. Elgin, S. C. R. & Reuter, G. Position-effect variegation, heterochromatin formation, and gene silencing in Drosophila. Cold Spring Harb. Perspect. Biol. 5, a017780 (2013). - PMC - PubMed
    1. Strom AR, et al. Phase separation drives heterochromatin domain formation. Nature. 2017;547:241–245. doi: 10.1038/nature22989. - DOI - PMC - PubMed
    1. Wang J, Jia ST, Jia S. New insights into the regulation of heterochromatin. Trends Genet. 2016;32:284–294. doi: 10.1016/j.tig.2016.02.005. - DOI - PMC - PubMed
    1. Ryba T, et al. Evolutionarily conserved replication timing profiles predict long-range chromatin interactions and distinguish closely related cell types. Genome Res. 2010;20:761–770. doi: 10.1101/gr.099655.109. - DOI - PMC - PubMed

Publication types

LinkOut - more resources