. 2022 Feb 8;13(1):751.
doi: 10.1038/s41467-021-27942-w.

Genomic epidemiology of SARS-CoV-2 in a UK university identifies dynamics of transmission

Collaborators, Affiliations

Genomic epidemiology of SARS-CoV-2 in a UK university identifies dynamics of transmission

Dinesh Aggarwal et al. Nat Commun. .

Abstract

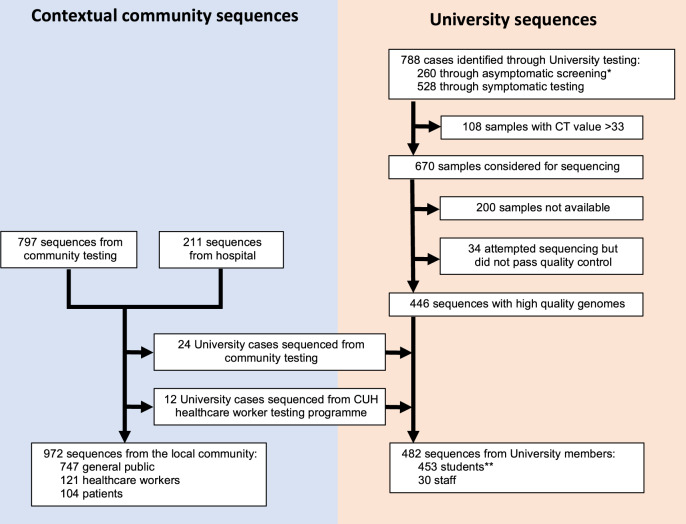
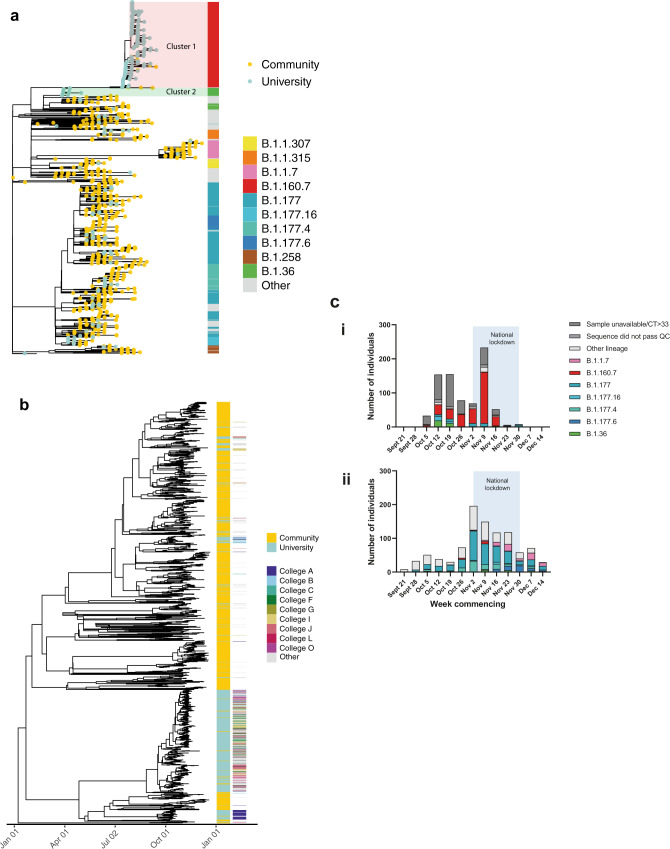
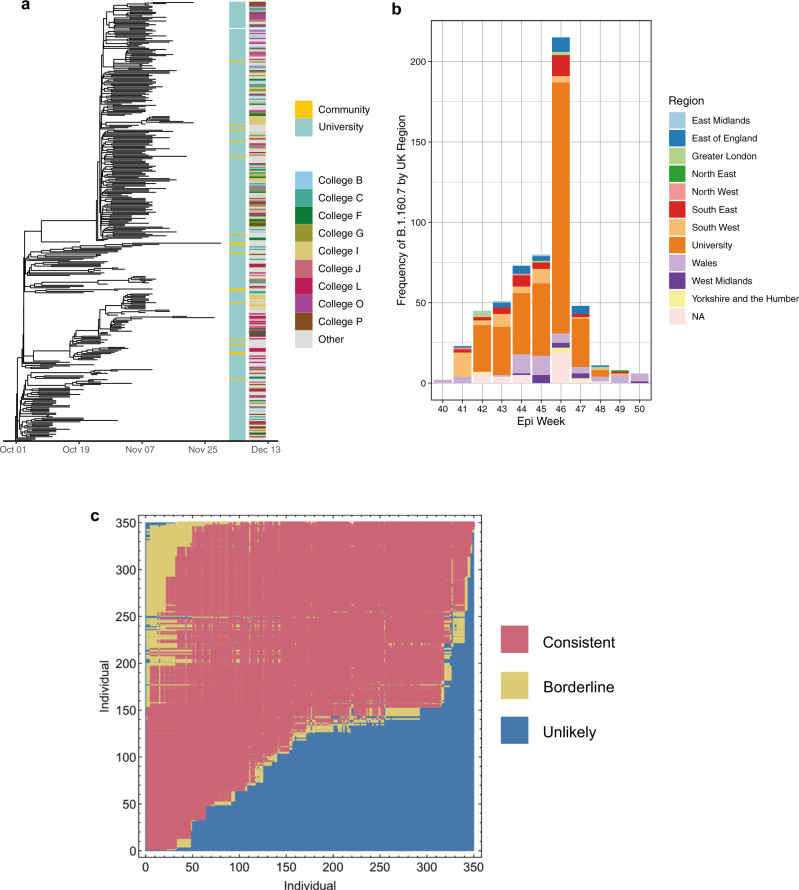
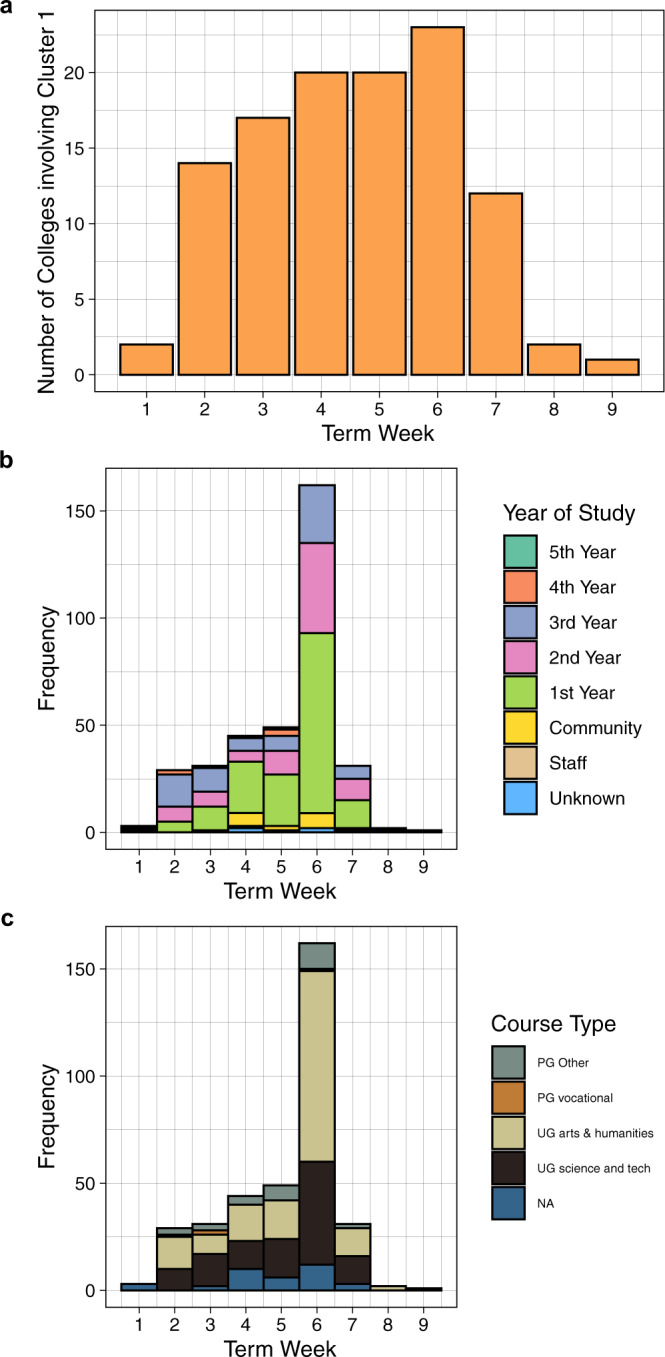
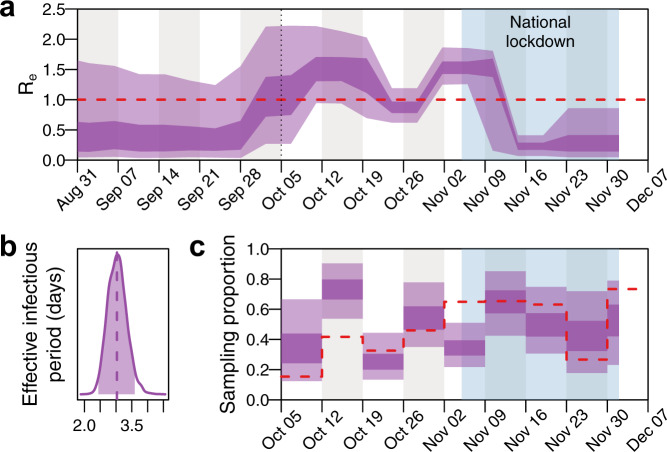
Understanding SARS-CoV-2 transmission in higher education settings is important to limit spread between students, and into at-risk populations. In this study, we sequenced 482 SARS-CoV-2 isolates from the University of Cambridge from 5 October to 6 December 2020. We perform a detailed phylogenetic comparison with 972 isolates from the surrounding community, complemented with epidemiological and contact tracing data, to determine transmission dynamics. We observe limited viral introductions into the university; the majority of student cases were linked to a single genetic cluster, likely following social gatherings at a venue outside the university. We identify considerable onward transmission associated with student accommodation and courses; this was effectively contained using local infection control measures and following a national lockdown. Transmission clusters were largely segregated within the university or the community. Our study highlights key determinants of SARS-CoV-2 transmission and effective interventions in a higher education setting that will inform public health policy during pandemics.


Conflict of interest statement

R.H. is an employee of AstraZeneca AB. The remaining authors declare no competing interests.

Figures

Fig. 1
Fig. 1. Study cohort and available genome sequences.
*Includes 14 students identified through ad hoc asymptomatic screening conducted as part of an outbreak investigation by the University of Cambridge in conjunction with local public health authorities, responding to increased rates of infection in a block of student accommodation (described in further detail in cluster 2 below). **Includes two students associated with a single sequenced pooled sample (see supplementary methods). CUH Cambridge University Hospitals.
Fig. 2
Fig. 2. Genomic diversity of SARS-CoV-2 in the university and community.
a Maximum likelihood tree showing that the majority of lineages from university isolates were distinct from community isolates. The node leaves (branch tips) show case location and global PANGO lineage is illustrated in the vertical bar. b Time-scaled coalescent tree including university members and local community isolates from study period with visible segregation between the two groups. College affiliation is shown for university members in the second set of vertical columns, highlighting the ‘top nine’ colleges by cluster 1 prevalence. c Epidemic curves demonstrating a steeper decline in SARS-CoV-2 cases in the University of Cambridge (i) compared to the local community (ii), with associated lineages. Only cases with available genomes are included. University term ran from the week commencing October 5 to the week commencing November 30. The light blue shaded area reflects a 4-week national lockdown in the UK, which was associated with a large fall in COVID-19 cases in University students. Specific lineages highlighted are the four largest lineages within the University (minimum 20 cases over the study period) and the community (minimum 50 cases over the study period). For (i), weekly individual case ascertainment for staff and students testing positive for SARS-CoV-2 through both symptomatic and asymptomatic testing pathways provided at the University of Cambridge is indicated. For (ii), weekly cases with genomes available from the local community are shown. Source data are provided as a Source Data file.
Fig. 3
Fig. 3. Emergence and transmission of SARS-CoV-2 in a large university cluster.
a Time-scaled phylogenetic tree of largest university cluster (cluster 1) derived from the BDSKY model implemented in BEAST 2.6 (Fig. 5). The left-sided heatmap is coloured by case location, and the right-sided heatmap is coloured by student college affiliation, highlighting the top nine colleges by cluster 1 prevalence. Cluster 1 was widely dispersed across the university with limited transmission into the community. b Frequency of Lineage B.1.160.7 (to which cluster 1 belongs) in each region of the UK and the University of Cambridge. Regions are defined as ‘Nomenclature of territorial units for statistics’ (NUTS) regions, where the UK has 9 regions. It is visible that the lineage B.1.160.7 was first sequenced in Wales, and then in the neighbouring South West of England, before becoming prevalent within the University of Cambridge. The lineage remained infrequently detected in the community populating the wider surrounding region (Cambridgeshire, East Anglia, Bedfordshire and Hertfordshire, and Essex, making up East of England) throughout the university term. c A continuous transmission chain of SARS-CoV-2 infections in cluster 1 commenced with a single introduction. Relationships between individuals in cluster 1 were calculated within A2B-COVID. Colours denote potential transmission events from the donor (vertical axis) to the recipient (horizontal axis) that are consistent with transmission or which are borderline possibilities (yellow). The plot shows that the data are consistent with a continuous transmission chain of SARS-CoV-2 infections in cluster 1 occurring via a single introduction; there are multiple potential networks of transmission events between these individuals for which each event would be consistent with a statistical model of direct transmission. We note that individuals in this plot are ordered by the date of the first positive COVID test. Source data are provided as a Source Data file.
Fig. 4
Fig. 4. Demographics of Cluster 1 across the first university term.
a Cumulative number of colleges involved in the cluster. Cases included in this cluster were between a number of colleges early during the university term. b Frequency of cases involved in the cluster by year of study. c Frequency of cases involved in the cluster by course type. Source data are provided as a Source Data file.
Fig. 5
Fig. 5. Effective reproduction number and infectious period of SARS-CoV-2 from a dominant university cluster.
A 20-epoch birth-death skyline model shows the effect of local infection control measures and the national lockdown on the effective reproduction number (Re), and estimates of the mean effective infectious period as 3.03 (95% HPD = 2.44-3.59) days. a Re posterior estimates (dark shading = 50% HPD; light shading = 95% HPD). The dotted line indicates the start of term and the light blue shaded area the 4-week national lockdown in the UK, which was associated with a large fall in COVID-19 cases in University students. The red dashed line indicates Re= 1. b Effective infectious period posterior estimates (shaded region = 95% HPD; dashed line = median). c Weekly sampling proportion posterior estimates (dark shading = 50% HPD; light shading = 95% HPD). The red dashed line indicates the empirical sampling proportion estimates for each week in term (number of sequenced genomes from all University clusters divided by the number of positive tests among University staff and students). Source data are provided as a Source Data file.

Similar articles

Cited by

References

    1. Zhou F, et al. Clinical course and risk factors for mortality of adult inpatients with COVID-19 in Wuhan, China: a retrospective cohort study. Lancet. 2020;395:1054–1062. doi: 10.1016/S0140-6736(20)30566-3. - DOI - PMC - PubMed
    1. Yang J, et al. Prevalence of comorbidities and its effects in patients infected with SARS-CoV-2: a systematic review and meta-analysis. Int J. Infect. Dis. 2020;94:91–95. doi: 10.1016/j.ijid.2020.03.017. - DOI - PMC - PubMed
    1. Amoolya Vusirikala, H. W. et al. Gayatri Amirthalingam. Seroprevalence of SARS-CoV-2 Antibodies in University Students: cross-sectional study, December 2020, England. (2021). - PMC - PubMed
    1. Yamey G, Walensky RP. Covid-19: re-opening universities is high risk. BMJ. 2020;370:m3365. doi: 10.1136/bmj.m3365. - DOI - PubMed
    1. Group, C.s.T.F. Risks associated with the reopening of education settings in September. 2021 (2020).

Publication types