

Machine learning outperforms clinical experts in classification of hip fractures
- PMID: 35136091
- PMCID: PMC8825848
- DOI: 10.1038/s41598-022-06018-9
Machine learning outperforms clinical experts in classification of hip fractures
Abstract
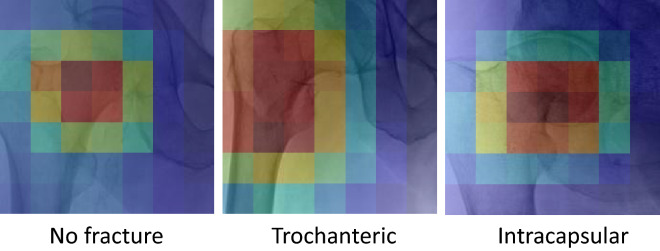
Hip fractures are a major cause of morbidity and mortality in the elderly, and incur high health and social care costs. Given projected population ageing, the number of incident hip fractures is predicted to increase globally. As fracture classification strongly determines the chosen surgical treatment, differences in fracture classification influence patient outcomes and treatment costs. We aimed to create a machine learning method for identifying and classifying hip fractures, and to compare its performance to experienced human observers. We used 3659 hip radiographs, classified by at least two expert clinicians. The machine learning method was able to classify hip fractures with 19% greater accuracy than humans, achieving overall accuracy of 92%.
© 2022. The Author(s).
Conflict of interest statement
The authors declare no competing interests.
Figures
References
-
- Judge, A. et al. in Models of Care for the Delivery of Secondary Fracture Prevention After Hip Fracture: A Health Service Cost, Clinical Outcomes and Cost-Effectiveness Study Within a Region of England Health Services and Delivery Research (2016). - PubMed
-
- National Hip Fracture Database. NHFD—Chart & Reports, https://www.nhfd.co.uk/20/NHFDCharts.nsf/vwCharts/OverallPerformance (2020).
-
- Hernlund E, et al. Osteoporosis in the European Union: medical management, epidemiology and economic burden. A report prepared in collaboration with the International Osteoporosis Foundation (IOF) and the European Federation of Pharmaceutical Industry Associations (EFPIA) Arch. Osteoporos. 2013;8:136. doi: 10.1007/s11657-013-0136-1. - DOI - PMC - PubMed
Publication types
MeSH terms
LinkOut - more resources
Full Text Sources
Medical
Research Materials
