

Irreversible alteration of extracellular vesicle and cell-free messenger RNA profiles in human plasma associated with blood processing and storage
- PMID: 35136102
- PMCID: PMC8827089
- DOI: 10.1038/s41598-022-06088-9
Irreversible alteration of extracellular vesicle and cell-free messenger RNA profiles in human plasma associated with blood processing and storage
Abstract
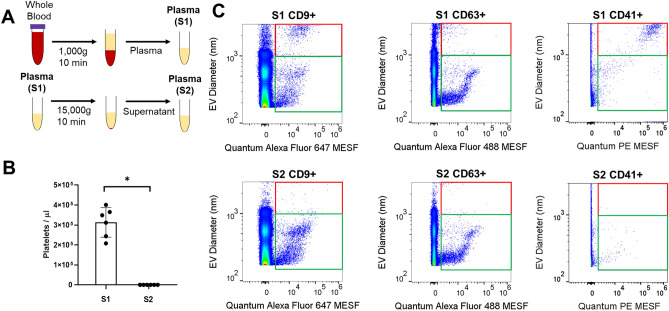
The discovery and utility of clinically relevant circulating biomarkers depend on standardized methods that minimize preanalytical errors. Despite growing interest in studying extracellular vesicles (EVs) and cell-free messenger RNA (cf-mRNA) as potential biomarkers, how blood processing and freeze/thaw impacts the profiles of these analytes in plasma was not thoroughly understood. We utilized flow cytometric analysis to examine the effect of differential centrifugation and a freeze/thaw cycle on EV profiles. Utilizing flow cytometry postacquisition analysis software (FCMpass) to calibrate light scattering and fluorescence, we revealed how differential centrifugation and post-freeze/thaw processing removes and retains EV subpopulations. Additionally, cf-mRNA levels measured by RT-qPCR profiles from a panel of housekeeping, platelet, and tissue-specific genes were preferentially affected by differential centrifugation and post-freeze/thaw processing. Critically, freezing plasma containing residual platelets yielded irreversible ex vivo generation of EV subpopulations and cf-mRNA transcripts, which were not removable by additional processing after freeze/thaw. Our findings suggest the importance of minimizing confounding variation attributed to plasma processing and platelet contamination.
© 2022. The Author(s).
Conflict of interest statement
The authors declare no competing interests.
Figures


Similar articles
-
Platelets confound the measurement of extracellular miRNA in archived plasma.Sci Rep. 2016 Sep 13;6:32651. doi: 10.1038/srep32651. Sci Rep. 2016. PMID: 27623086 Free PMC article.
-
Flow cytometric analysis of extracellular vesicle subsets in plasma: impact of swarm by particles of non-interest.J Thromb Haemost. 2018 Jul;16(7):1423-1436. doi: 10.1111/jth.14154. Epub 2018 Jun 15. J Thromb Haemost. 2018. PMID: 29781099
-
Handling and storage of human body fluids for analysis of extracellular vesicles.J Extracell Vesicles. 2015 Nov 11;4:29260. doi: 10.3402/jev.v4.29260. eCollection 2015. J Extracell Vesicles. 2015. PMID: 26563735 Free PMC article.
-
Application of Extracellular Vesicles Proteomics to Cardiovascular Disease: Guidelines, Data Analysis, and Future Perspectives.Proteomics. 2019 Jan;19(1-2):e1800247. doi: 10.1002/pmic.201800247. Epub 2019 Jan 7. Proteomics. 2019. PMID: 30467982 Review.
-
Comparison of serum and plasma as a source of blood extracellular vesicles: Increased levels of platelet-derived particles in serum extracellular vesicle fractions alter content profiles from plasma extracellular vesicle fractions.PLoS One. 2022 Jun 24;17(6):e0270634. doi: 10.1371/journal.pone.0270634. eCollection 2022. PLoS One. 2022. PMID: 35749554 Free PMC article. Review.
Cited by
-
MIBlood-EV: Minimal information to enhance the quality and reproducibility of blood extracellular vesicle research.J Extracell Vesicles. 2023 Dec;12(12):e12385. doi: 10.1002/jev2.12385. J Extracell Vesicles. 2023. PMID: 38063210 Free PMC article.
-
Selective enrichment of plasma cell-free messenger RNA in cancer-associated extracellular vesicles.Commun Biol. 2023 Aug 29;6(1):885. doi: 10.1038/s42003-023-05232-z. Commun Biol. 2023. PMID: 37644220 Free PMC article.
-
Extracellular vesicles in systemic juvenile idiopathic arthritis.J Leukoc Biol. 2023 Oct 26;114(5):387-403. doi: 10.1093/jleuko/qiad059. J Leukoc Biol. 2023. PMID: 37201912 Free PMC article.
-
Choice of blood collection methods influences extracellular vesicles counts and miRNA profiling.J Extracell Biol. 2024 Oct 22;3(10):e70008. doi: 10.1002/jex2.70008. eCollection 2024 Oct. J Extracell Biol. 2024. PMID: 39440167 Free PMC article.
-
Circulating extracellular vesicles in healthy and pathological pregnancies: A scoping review of methodology, rigour and results.J Extracell Vesicles. 2023 Nov;12(11):e12377. doi: 10.1002/jev2.12377. J Extracell Vesicles. 2023. PMID: 37974377 Free PMC article.
References
Publication types
MeSH terms
Substances
Grants and funding
LinkOut - more resources
Full Text Sources
Medical
Miscellaneous
