. 2022 Feb 8;12(1):2116.
doi: 10.1038/s41598-022-06260-1.

Effectiveness of alternative semester break schedules on reducing COVID-19 incidence on college campuses

Affiliations

Effectiveness of alternative semester break schedules on reducing COVID-19 incidence on college campuses

Chris L Lehnig et al. Sci Rep. .

Abstract

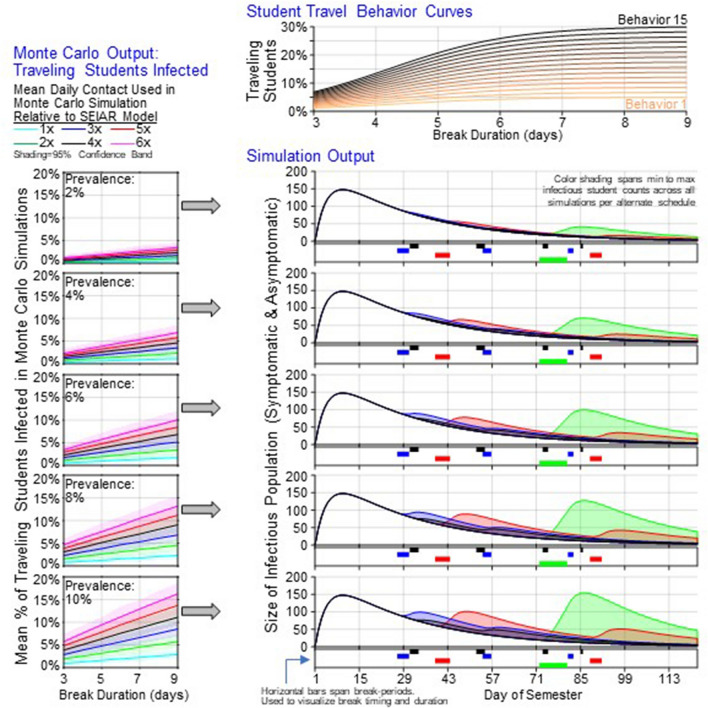
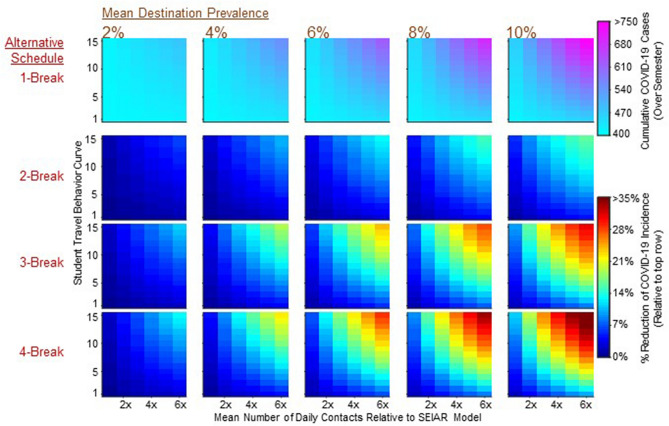
Despite COVID-19 vaccination programs, the threat of new SARS-CoV-2 strains and continuing pockets of transmission persists. While many U.S. universities replaced their traditional nine-day spring 2021 break with multiple breaks of shorter duration, the effects these schedules have on reducing COVID-19 incidence remains unclear. The main objective of this study is to quantify the impact of alternative break schedules on cumulative COVID-19 incidence on university campuses. Using student mobility data and Monte Carlo simulations of returning infectious student size, we developed a compartmental susceptible-exposed-infectious-asymptomatic-recovered (SEIAR) model to simulate transmission dynamics among university students. As a case study, four alternative spring break schedules were derived from a sample of universities and evaluated. Across alternative multi-break schedules, the median percent reduction of total semester COVID-19 incidence, relative to a traditional nine-day break, ranged from 2 to 4% (for 2% travel destination prevalence) and 8-16% (for 10% travel destination prevalence). The maximum percent reduction from an alternate break schedule was estimated to be 37.6%. Simulation results show that adjusting academic calendars to limit student travel can reduce disease burden. Insights gleaned from our simulations could inform policies regarding appropriate planning of schedules for upcoming semesters upon returning to in-person teaching modalities.


Conflict of interest statement

The authors declare no competing interests.

Figures

Figure 1
Figure 1
Break-period dependent information fed into SEIAR simulation and resulting range of infectious population size over time across all scenarios. The Monte Carlo Output panels show results of MC simulations. The prevalence rate in each panel provides the rate used in the simulation. Lines are colored by mean daily contact rate used in simulation. Plotted data are mean percent of infectious students. Colored bands show the 95% range of means across 500 simulations. Student Travel Behavior Curves show the relationship between break-duration and percent of students that travel used in simulations. Simulation Output shows the range of infectious student population sizes per alternative schedule (green: one-break, red: two-break, blue: three-break. black: four-break), across all combinations of student travel behavior curves and mean daily contacts while traveling parameters.
Figure 2
Figure 2
Sensitivity of the reduction of total cases for each break schedule (1800 simulations). The top row shows total COVID-19 incidence from the one-break schedule among on-campus students over the course of the semester. Remaining rows show the percent reduction in total incidence, relative to the one-break schedule, resulting from implementing two-, three- and four-break schedules. Within each panel, Y axis ticks correspond to the student travel behavior curve (how many students travel) and X axis ticks correspond to the mean daily contract rate used in the MC simulation (how many traveling students were infected). Each column corresponds to a mean travel destination prevalence rate. Each cell, within each panel, corresponds to one simulation.
Figure 3
Figure 3
Computational model workflow. During regular-period, transmission dynamics at universities were simulated by a susceptible-exposed-infectious-asymptomatic-recovered model (Regular SEIAR). Student behavior scenarios determined how many students traveled (p%) given a specific number of days off. At the beginning of a break, traveling students left the Regular SEIAR compartments and followed the Break S*E*I*A*R* model, where Monte Carlo simulations determined the number of traveling students infected under a mean destination prevalence and mean daily contact scenario. During break-period, students [(1 − p)%] who did not travel followed SEIAR model (Reduced SEIAR). At the end of the break, traveling students return to the Regular SEIAR compartments until the next scheduled break or the end of the semester.

Similar articles

Cited by

References

    1. Leidner AJ, et al. Opening of large institutions of higher education and county-level COVID-19 incidence—United States, July 6–September 17, 2020. MMWR Morb. Mortal. Wkly. Rep. 2021;70:14–19. doi: 10.15585/mmwr.mm7001a4. - DOI - PMC - PubMed
    1. Montgomery D, Fernandez M. 44 Texas Students have Coronavirus After Spring Break Trip. The New York Times; 2020.
    1. Li R, et al. Substantial undocumented infection facilitates the rapid dissemination of novel coronavirus (SARS-CoV-2) Science. 2020;368:489–493. doi: 10.1126/science.abb3221. - DOI - PMC - PubMed
    1. Fan C, Li M, Li X, Zhu M, Fu P. Who got infected with COVID-19? A study of college students in Wuhan (China) Int. J. Environ. Res. Public Health. 2021 doi: 10.3390/ijerph18052420. - DOI - PMC - PubMed
    1. Chang S, et al. Mobility network models of COVID-19 explain inequities and inform reopening. Nature. 2021;589:82–87. doi: 10.1038/s41586-020-2923-3. - DOI - PubMed

Publication types