. 2022 Jan 11;31(4):809-829.
doi: 10.1055/s-0041-1741100. eCollection 2021 Oct.

Spinal Dysraphisms: A New Anatomical-Clinicoradiological Classification

Affiliations

Spinal Dysraphisms: A New Anatomical-Clinicoradiological Classification

Amarnath Chellathurai et al. Indian J Radiol Imaging. .

Abstract

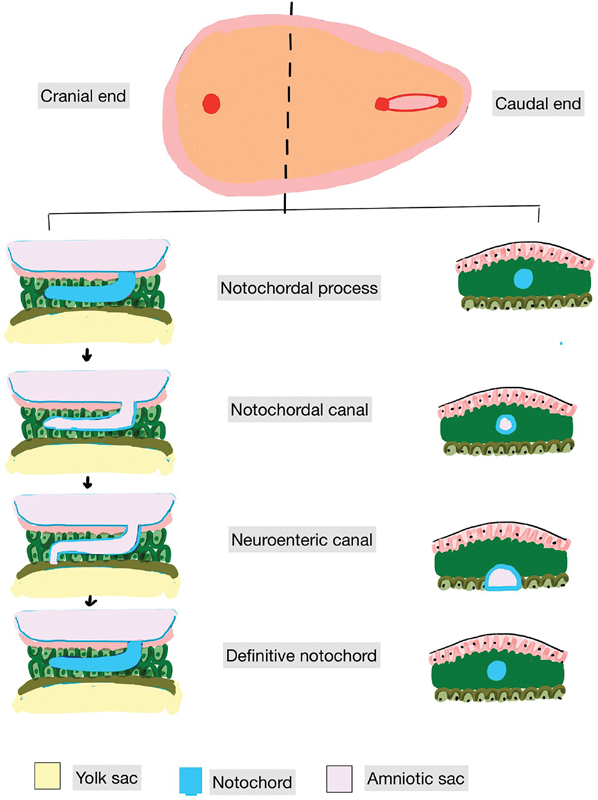
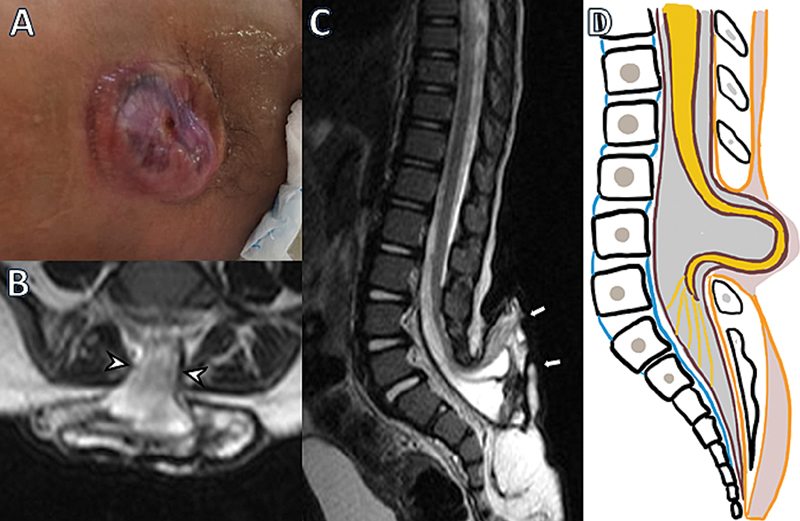
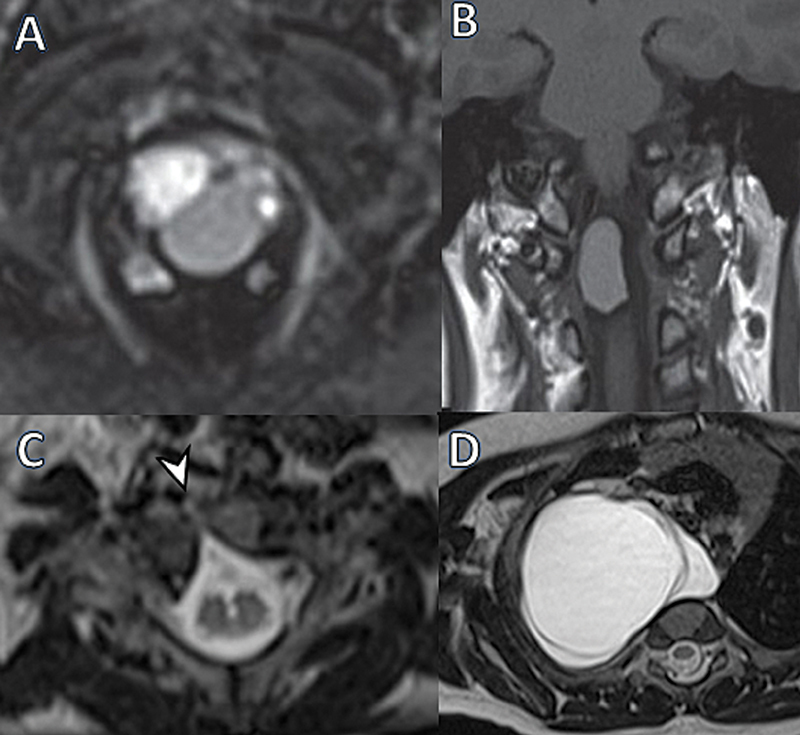
Background Spinal dysraphisms refer to the congenital abnormalities of the spine and spinal cord due to aberrations in the processes of gastrulation, primary neurulation, and secondary neurulation. Embryology of many complex spinal dysraphisms are yet poorly understood and there is no agreeable anatomical-clinicoradiological classification with inclusion of recently documented and complex spinal dysraphisms. Aims and Objectives The main objective of this study was to review the imaging features of spinal dysraphisms with a better understanding of embryological abnormalities and propose a new classification inclusive of all complex and unusual dysraphisms based on anatomical and clinicoradiological correlation. Materials and Methods This was a retrospective single institutional observational study of 391 cases of spinal dysraphism for 10 years in our institution. Of 391 cases included in the study, 204 were males and 187 were females. Also, 123 cases belonged to the 0-6 months age group, 38 cases belonged to the 7-12 months age group, 156 belonged to the 1-5 years age group, 39 cases belonged to the 6-10 years age group, and 35 cases belonged to 10-20 years age group. Results An anatomical-clinicoradiological analysis of cases yielded a high proportion of cases of spinal lipomas, including lipomyeloceles and lipomyelomeningoceles (31.3%) and posterior myelomeningocele (14.2%). Anterior myelocoele (0.2%), sacral chordoma(0.2%), and intrasacral meningocele (0.2%) formed the least proportion of cases. A new classification was proposed based on the analysis of acquired data. Conclusion A structured approach in imaging spinal dysraphism is necessary for imaging evaluation in recent years. The proposed new classification based on clinicoradiological correlation and anatomic location is inclusive of unusual and complex dysraphisms.

Keywords: closed spinal dysraphism; embryology; magnetic resonance imaging; open spinal dysraphism; spinal dysraphism.


Figures

Fig. 1
Fig. 1
Bilaminar Disc. ( A ) Bilaminar disc with the development of the amniotic cavity and the primary yolk sac followed by formation of the primitive streak in ( B ) and ( C ).
Fig. 2
Fig. 2
Formation of the primitive streak ( A ) showing the formation of the extra embryonic mesoderm and ( B ) and ( C ) showing the development of the prochordal plate from the hypoblast, cranially and the primitive streak from the cells of the epiblast, caudally. The formation of the Hensen's node at one end of the primitive streak establishes it to be the cranial end of the primitive streak.
Fig. 3
Fig. 3
( A ) Surface view showing mesodermal proliferation and coronal view ( B ) showing the formation of the trilaminar disc with ectoderm, endoderm, and mesoderm.
Fig. 4
Fig. 4
Formation of the definitive notochord.
Fig. 5
Fig. 5
Formation of the neural plate from the ectoderm overlying the notochord.
Fig. 6
Fig. 6
Primary neurulation. ( A, B, and C ) Furrowing and in-folding of the neural groove overlying the notochord with subsequent formation of the neural tube in ( D ) and zipper-like closure ( E ).
Fig. 7
Fig. 7
Neural tube closure with neural crest cells on either side beginning to form root ganglia and leptomeninges.
Fig. 8
Fig. 8
Stages of secondary neurulation beginning just as the posterior neuropore closes. ( A ) Formation of caudal cell mass, ( B ) vacuolization, ( C ) canalization and ( D ) retrogressive differentiation resulting in the formation of the lower 1/10th of the spinal cord.
Fig. 9
Fig. 9
Posterior myelomeningocele. ( A ) Image shows neural tissue and CSF directly exposed to the environment in the lumbar region. ( BD ) T2 axial, sagittal images, and illustration show the spinal cord herniating in a CSF-filled sac (arrows) through a defect in the posterior vertebral elements (arrowheads).
Fig. 10
Fig. 10
Posterior meningocele. ( A ) Clinical image showing the skin covered swelling in the lumbar region. ( B ) Myelogram, ( C ) T2 sagittal, and ( D ) T2 axial images, and ( E ) illustration shows CSF-filled sac herniating through a defect in the posterior vertebral elements. There is no neural tissue within the herniated sac.
Fig. 11
Fig. 11
Anterior thoracic myelocystocele. ( A ) T2 axial and ( D ) T2 coronal images with ( C ) myelogram and ( B ) axial CT section showing an anterior vertebral defect with the herniation of a hydromelic dilated cord into a CSF-filled sac anterolaterally.
Fig. 12
Fig. 12
Anterior herniation of the cord (anterior myelomeningocele). ( A ) Myelogram, ( B ) T2 sagittal and ( C ) T2 coronal images showing an anterior vertebral defect with herniation of the cord and a CSF-filled sac anteriorly into the prevertebral space. There is also a neurenteric cyst noted in the myelogram ( A ).
Fig. 13
Fig. 13
Posterior myelocystocele. ( A ) Image shows skin-covered swelling in the lumbar region. ( B ) Myelogram, ( C ) T2 axial, ( D ) and T1 sagittal images and ( E ) illustration shows the cord with a dilated central canal (syrinx, arrowheads) within the CSF-containing sac (arrows), which has herniated posteriorly through a vertebral defect.
Fig. 14
Fig. 14
Lipoma, Types I and II. ( A ) T2 sagittal image showing an intraspinal lipoma attached to the dorsal cord above the conus medullaris: this is type I. Illustrations show type ( B ) IA, ( C ) IB, and ( C ) IC variants. ( E ) T1 sagittal image shows a lipoma attached to the cauda equina: Type II. Illustrations show type ( F ) IIA, ( G ) IIB, and ( H ) IIC.
Fig. 15
Fig. 15
Conal (Type III) and filar (Type IV) lipomas. ( A ) T1 sagittal image showing a tethered cord with a lipoma attached to the conus of the cord: conal lipoma. Illustrations show type ( B ) IIIA, ( C ) IIIB, and ( D ) IIIC variants. ( E ) The location of dorsal (arrow), transitional (star, dotted lines indicate chaotic variant), and conal (arrowhead) lipomas. ( F ) T1 sagittal image shows a lipoma attached to the apex of the cord and filum terminale: apical filar lipoma. ( G ) T2 sagittal image shows a hydromelic low-lying cord with a lipoma attached to the tip of the filum terminale: terminal lipoma. ( H ) Type IVA: apical filar lipoma, ( I ) Type IVB: mid filar lipoma, ( J ) Type IVC: filar tip lipoma.
Fig. 16
Fig. 16
Variability in the ending of the cord. ( A ) Normal termination of the cord, with a thin filum. ( B ) Thick filum terminale. ( C ) Cyst of the filum terminale. ( D ) Lipoma of the filum terminale.
Fig. 17
Fig. 17
Posterior lipomyelocele. ( A ) Image showing a skin-covered swelling in the lumbar region. ( B ) T2 axial and ( C ) T1 sagittal images and illustration ( D ) showing an intraspinal lipoma herniating into the subcutaneous fat through a posterior spina bifida.
Fig. 18
Fig. 18
Intramedullary lipoma and dural lipomatosis ( A ) T2 sagittal image showing an intramedullary lipoma expanding the cord: Type VI. ( B ) T1 sagittal image showing an intramedullary lipoma noted within a low-lying cord. These are illustrated in ( C ). ( D ) T1 sagittal images showing proliferation of fat within the dural space, displacing and compressing the cord anteriorly.
Fig. 19
Fig. 19
Lipomyelomeningocele. ( A ) Myelogram, ( B ) T2 sagittal, and ( C ) T2 and ( D ) T1 axial images shows the herniation of the cord through the posterior spinal defect. A lipoma is noted in ( D ) with the lipoma placode interface located outside the spinal canal (arrowhead). This is a lipomyelomeningocele, as illustrated in ( E ).
Fig. 20
Fig. 20
Spinal lipomas: a summary.
Fig. 21
Fig. 21
Retained medullary cord. ( A ) T2 sagittal image showing a low-lying cord attached to a terminal lipoma by a thick, robust filum terminale. ( B ) T1 sagittal image showing a low-ending cord herniating into a CSF-filled sac. This is a cystomyelocele with possible RMC. ( C ) T2 sagittal image showing split cord malformation with a ventriculus terminalis cyst. ( D ) T2 sagittal image showing a low-lying cord with thick, robust filum terminale attaching to the cul-de-sac and altered conus shape.
Fig. 22
Fig. 22
Retained medullary cord ( A ) Thickened, abnormally low termination of cord without a clearly demarcated conus. ( B ) With apical lipoma. ( C ) With ventriculus terminalis cyst ( D ) Hour glass configuration of thickened conus. ( E ) Myelocystocele with herniation of the cord. ( F ) Partial herniation of the cord into the myelocystocele sac.
Fig. 23
Fig. 23
Dorsal dermal sinus. ( A ) Patient presented with a midline opening above the gluteal cleft. ( B ) T1 axial MinIP, ( C ) T2 sagittal images showing a hypointense tract extending from the skin opening into the spinal canal. ( D ) Different patient shows thickened T2 hypointense thickened tract with an ill-defined T2 hyperintensity within the spinal canal. ( E ) On contrast, there is thick peripheral enhancement. This is a dorsal dermal sinus with intraspinal abscess, due to infection.
Fig. 24
Fig. 24
Flat LDM vs. dorsal dermal sinus. ( A ) Illustration shows an epithelium lined tract communicating from the skin to the spinal canal. An external opening is noted at the skin. Associated epidermoid cyst and complications such as intraspinal abscess are shown. ( B ) Illustration shows a flat LDM, where a fibroneural stalk attaches from the skin to the spinal cord, causing tenting of the cord at its junction.
Fig. 25
Fig. 25
Saccular LDM vs. cystomyelocele. ( A ) Illustration showing a thin fibroneural stalk attaching to the dome of a subcutaneous CSF-filled sac: dome stalk variant of saccular LDM. In ( B ), CSF fills and distends the canal of the fibroneural stalk, leading to a segmental myelocystocele variant of saccular LDM. ( C ) Illustration representing a myelocystocele, a different entity where the cord along with a dilated central canal herniates through a posterior defect.
Fig. 26
Fig. 26
Limited dorsal myeloschisis. ( A ) T2 sagittal image shows a linear fibroneural track extending from a flat subcutaneous component to the cervical spinal canal, with tenting at the junction. ( B ) T2 sagittal image showing similar lesion in the lumbar region: these are flat (non-saccular) LDM. ( C ) T2 sagittal image showing a linear fibroneural track extending from the spinal canal to the dome of the dilated sac in the subcutaneous plane. This is the dome stalk variant of saccular LDM. (D, E) T2 sagittal images of a different patient show a sacular LDM with cystomyelocele, with the CSF tracking into the dilated central canal of the fibroneural track (black arrowheads) surrounded by a CSF filled sac (small white arrows). Tenting of the cord without extension of the cord itself is seen in ( D ) (large white arrows). ( F ) Figure shows a fibroneural tract passing anteriorly into a CSF-filled sac: possibly an anterior LDM.
Fig. 27
Fig. 27
Low-lying cord: the spectrum. ( A ) Normal cord termination with normal filum terminale. ( B ) Low-lying cord with a normal filum terminale. ( C ) Normal cord termination with a thick filum terminale. ( D ) Low-lying cord tight filum terminale.
Fig. 28
Fig. 28
Spectrum of neuroenteric remnants. ( A ) Dorsal enteric diverticulum. ( B ) Dorsal enteric fistula ( C ) Postvertebral neuroenteric cyst. ( D ) Intraspinal neuroenteric cyst. ( E ) Prevertebral neuroenteric cyst. ( F ) Dorsal enteric sinus.
Fig. 29
Fig. 29
Dorsoenteric fistula. ( A ) Patient presented with a large swelling over the back. ( B ) Ultrasonogram showing multiple dilated bowel loops within the swelling. ( C ) CT VRT image showing the split vertebral column with duplication of the vertebral bodies with posterior vertebral defect. ( D ) Myelogram, ( E ) T2 sagittal, ( F ) T2 coronal images showing herniation of bowel loops through the split cord. ( G ) Intraoperative image showing multiple herniated loops.
Fig. 30
Fig. 30
Neuroenteric cyst. ( A ) T1 coronal image and ( B ) T2 axial image showing neuroenteric cyst appearing iso-to-hyperintense to CSF on both T1- and T2-weighted images. (C, D) T2 axial images showing an anterior mediastinal cystic lesion, communicating with the spinal canal through a vertebral cleft (arrowhead).
Fig. 31
Fig. 31
Intraspinal dysraphism: epidermoid. ( A ) T2 sagittal image showing a heterogenous, T2 hyperintense mass lesion within the dural space compressing the cord anteriorly. This is an epidermoid cyst. Dermoids and epidermoids are differential diagnoses and to be considered for a neurenteric cyst.
Fig. 32
Fig. 32
Diastematomyelia. ( A ) Image shows hypertrichosis (fawn's tail) over the lumbar region. ( B ) T2 axial image showing diastematomyelia with a common dural sac: type 1. ( C ) T2 axial image showing diastematomyelia with a bony bar separating the hemicords: type 2. ( D ) T2 axial image showing type 1 diastematomyelia at the cervical level, a rare entity. ( E ) T2 axial image showing the cord cleft without splitting of the hemicords. ( F ) T1 coronal and ( G ) CT images showing duplication of the vertebral column. ( H ) There is a lipoma attached to the left hemicord, with the herniation of the lipoma and hemicord posteriorly through the spinal defect.
Fig. 33
Fig. 33
Segmental spinal dysgenesis. T2 sagittal image showing focal dysgenesis of the spinal cord, with a rounded termination of the upper segment (arrowhead) and an abnormal sacral segment (arrow)
Fig. 34
Fig. 34
Anterior lipomyelocele and an absent right hemisacrum. ( A ) T2 axial and ( B ) T1 sagittal images showing a lipoma with the lipoma: placode interface lying within the spinal canal. The lipoma herniates anteriorly and to the right through an absent right hemisacrum. The triad of sacral defect, anorectal malformation, and anterior spinal mass is Currarino's triad.
Fig. 35
Fig. 35
Caudal regression syndrome. ( A ) T2 sagittal image showing the high position of a bulbous conus medullaris with abnormal termination and partial sacral agenesis. This is Type 1 caudal regression syndrome. ( B ) T2 sagittal image showing a low-lying cord tethered by a thick filum terminale, with partial sacral agenesis. This is type 2 caudal regression syndrome.

References

    1. Patel S, Barkovich A J. Analysis and classification of cerebellar malformations. Am J Neuroradiol. 2002;23(07):1074–1087. - PMC - PubMed
    1. Tortori-Donati P, Rossi A, Cama A. Spinal dysraphism: a review of neuroradiological features with embryological correlations and proposal for a new classification. Neuroradiology. 2000;42(07):471–491. - PubMed
    1. Sadler T W. Embryology of neural tube development. Am J Med Genet C Semin Med Genet. 2005;135C(01):2–8. - PubMed
    1. Moore K. Philadelphia, PA: Elsevier Saunders; 2013. Congenital Abnormalities of the Spine; pp. 449–60.
    1. NTD Collaborative Group . Melvin E C, George T M, Worley G et al.Genetic studies in neural tube defects. Pediatr Neurosurg. 2000;32(01):1–9. - PubMed