

Physiological functional traits explain morphological variation of Ulva prolifera during the drifting of green tides
- PMID: 35136557
- PMCID: PMC8809434
- DOI: 10.1002/ece3.8504
Physiological functional traits explain morphological variation of Ulva prolifera during the drifting of green tides
Abstract
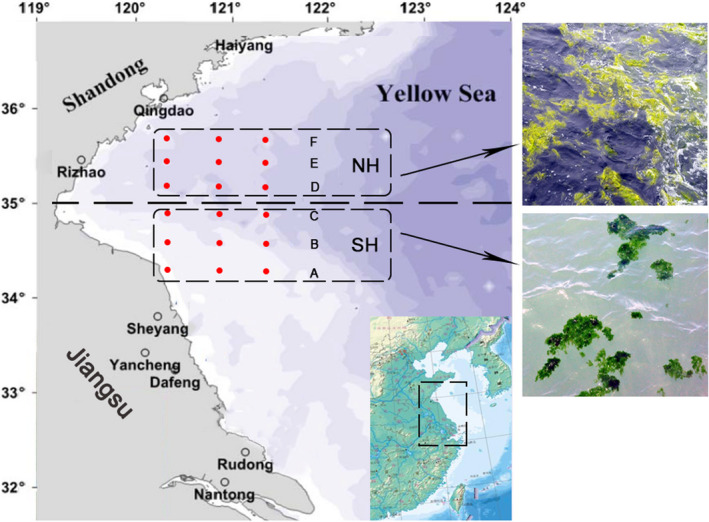
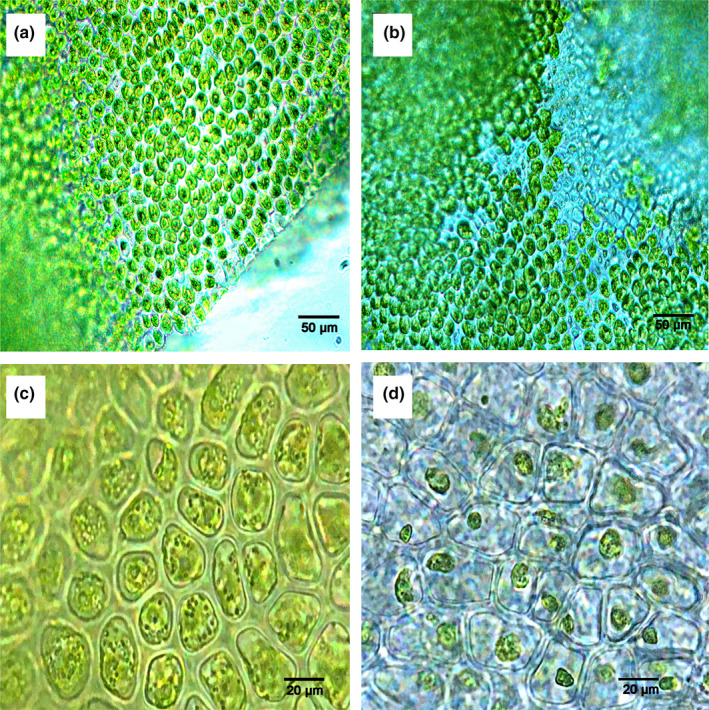
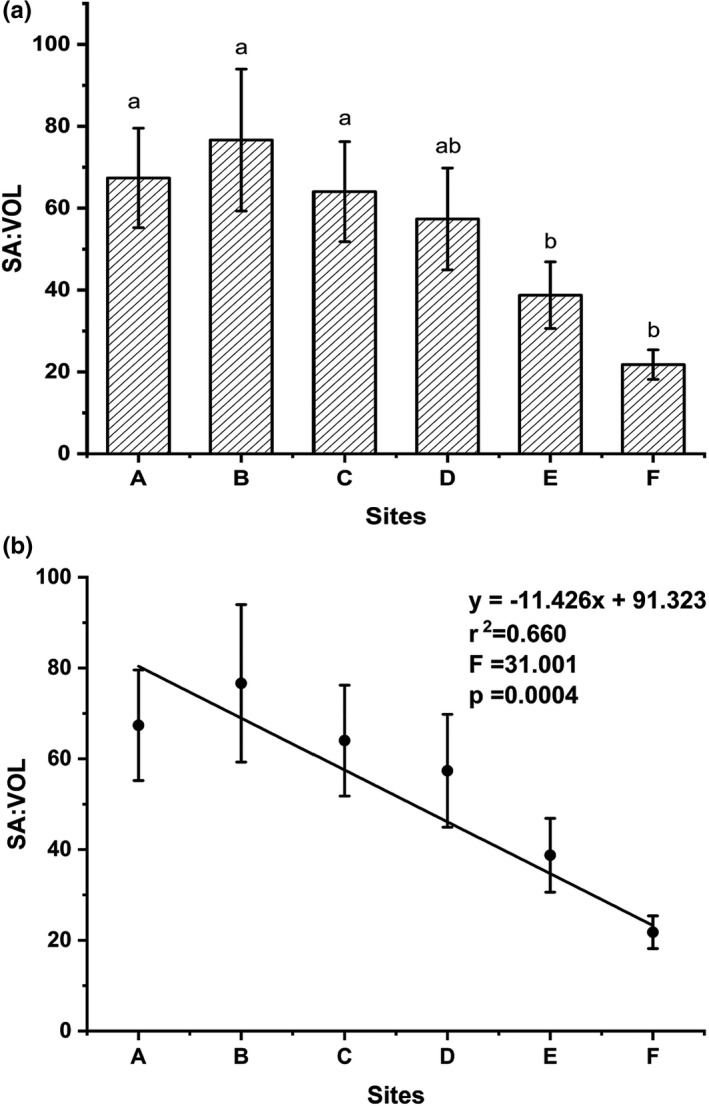
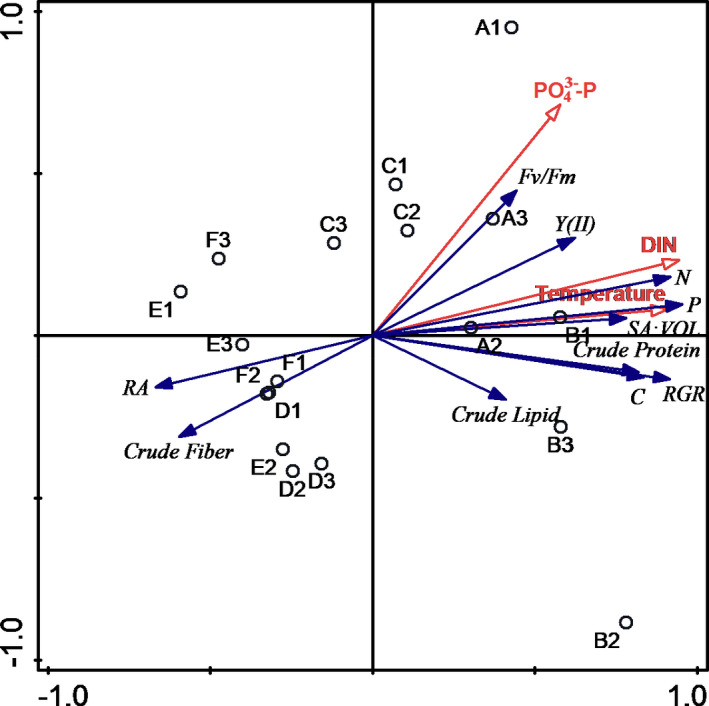
Ulva prolifera green tides, one of the greatest marine ecological disasters, originate in the southern Yellow Sea of China and obtain the highest biomass in Haizhou Bay (latitude around 35° N) during northward drift. U. prolifera shows different morphologies from southern Haizhou Bay (SH) to northern Haizhou Bay (NH). Owing to the distinct nutrient environments between SH and NH, we hypothesized that thalli in NH with poor nutrients increased the surface area to volume ratio (SA:VOL) to better absorb nutrients. Here, we tested this hypothesis by comparing the SA:VOL of thalli in SH and NH. The results showed that the thalli in NH had a lower SA:VOL than those in SH, and SA:VOL had positive relationships with temperature and nutrients, contrary to the general hypothesis. The novel results suggested that morphological differences of U. prolifera were the result of developmental state rather than environmental acclimation. Indicators of reproduction (reproductive allocation ratio) were negatively related to variation in tissue contents of C, N, P, and crude protein, whereas indicators of growth (tissue contents of C, N, P, and crude protein) showed significant positive influences on SA:VOL. The results indicated that a trade-off relationship between reproduction and growth existed in the northward drift. All the results suggested that physiological functional traits affected morphological variation of U. prolifera in different environmental conditions during the drifting of green tides. This study presents new insights into the opportunist species nature of U. prolifera through morphological variation and associated functional consequences.
Keywords: Ulva prolifera; morphological variation; photosynthetic system; reproductive allocation; surface area to volume ratio.
© 2022 The Authors. Ecology and Evolution published by John Wiley & Sons Ltd.
Conflict of interest statement
There are no conflicts of interest for all the authors including the implementation of research experiments and writing this article.
Figures


Similar articles
-
Contributions of temperature and development state to the morphological variation of Ulva prolifera highlight the source management for green tides.J Environ Sci (China). 2025 Dec;158:351-360. doi: 10.1016/j.jes.2024.04.006. Epub 2024 Apr 13. J Environ Sci (China). 2025. PMID: 40841016
-
Changes in morphological plasticity of Ulva prolifera under different environmental conditions: A laboratory experiment.Harmful Algae. 2016 Nov;59:51-58. doi: 10.1016/j.hal.2016.09.004. Epub 2016 Oct 1. Harmful Algae. 2016. PMID: 28073506
-
Characterization of the development stages and roles of nutrients and other environmental factors in green tides in the Southern Yellow Sea, China.Harmful Algae. 2020 Sep;98:101893. doi: 10.1016/j.hal.2020.101893. Epub 2020 Aug 24. Harmful Algae. 2020. PMID: 33129451
-
Genetic evidence in tracking the origin of Ulva prolifera blooms in the Yellow Sea, China.Harmful Algae. 2018 Sep;78:86-94. doi: 10.1016/j.hal.2018.08.002. Epub 2018 Aug 15. Harmful Algae. 2018. PMID: 30196928 Review.
-
A review of physical, chemical, and biological green tide prevention methods in the Southern Yellow Sea.Mar Pollut Bull. 2022 Jul;180:113772. doi: 10.1016/j.marpolbul.2022.113772. Epub 2022 May 24. Mar Pollut Bull. 2022. PMID: 35623218 Review.
Cited by
-
Responses of the Macroalga Ulva prolifera Müller to Ocean Acidification Revealed by Complementary NMR- and MS-Based Omics Approaches.Mar Drugs. 2022 Nov 26;20(12):743. doi: 10.3390/md20120743. Mar Drugs. 2022. PMID: 36547890 Free PMC article.
References
-
- Anderson, D. M. , Glibert, P. M. , & Burkholder, J. M. (2002). Harmful algal blooms and eutrophication: Nutrient sources, composition, and consequences. Estuaries, 25(4), 704–726. 10.1007/bf02804901 - DOI
-
- Bäck, S. , Lehvo, A. , & Blomster, J. (2000). Mass occurrence of unattached Enteromorpha intestinalis on the Finnish Baltic Sea coast. Annales Botanici Fennici, 37(3), 155–161.
-
- Bao, M. , Guan, W. , Yang, Y. , Cao, Z. , & Chen, Q. (2015). Drifting trajectories of green algae in the western Yellow Sea during the spring and summer of 2012. Estuarine, Coastal and Shelf Science, 163, 9–16. 10.1016/j.ecss.2015.02.009 - DOI
-
- Blain, C. O. , Rees, T. A. V. , Christine Hansen, S. , & Shears, N. T. (2020). Morphology and photosynthetic response of the kelpEcklonia radiataacross a turbidity gradient. Limnology and Oceanography, 65(3), 529–544. 10.1002/lno.11321 - DOI
Associated data
LinkOut - more resources
Full Text Sources
