Review
. 2022;11(1):3.
doi: 10.1186/s13750-021-00254-8. Epub 2022 Feb 4.

How do changes in flow magnitude due to hydropower operations affect fish abundance and biomass in temperate regions? A systematic review

Affiliations
Review

How do changes in flow magnitude due to hydropower operations affect fish abundance and biomass in temperate regions? A systematic review

Meagan Harper et al. Environ Evid. 2022.

Abstract

Background: Altering the natural flow regime, an essential component of healthy fluvial systems, through hydropower operations has the potential to negatively impact freshwater fish populations. Establishing improved management of flow regimes requires better understanding of how fish respond to altered flow components, such as flow magnitude. Based on the results of a recent systematic map on the impacts of flow regime changes on direct outcomes of freshwater or estuarine fish productivity, evidence clusters on fish abundance and biomass responses were identified for full systematic review. The primary goal of this systematic review is to address one of those evidence clusters, with the following research question: how do changes in flow magnitude due to hydropower operations affect fish abundance and biomass?

Methods: This review follows the guidelines of the Collaboration for Environmental Evidence. It examined commercially published and grey literature originally identified during the systematic map process and a systematic search update. All articles were screened using an a priori eligibility criteria at two stages (title and abstract, and full-text) and consistency checks were performed at all stages. All eligible articles were assessed for study validity and specifically designed data extraction and study validity tools were used. A narrative synthesis included all available evidence and meta-analysis using the standardized mean difference (Hedges' g) was conducted where appropriate.

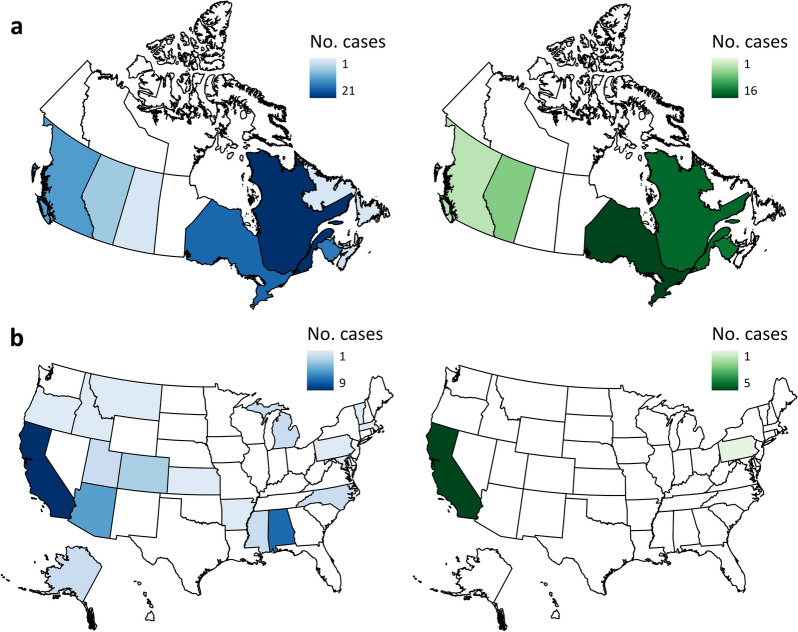
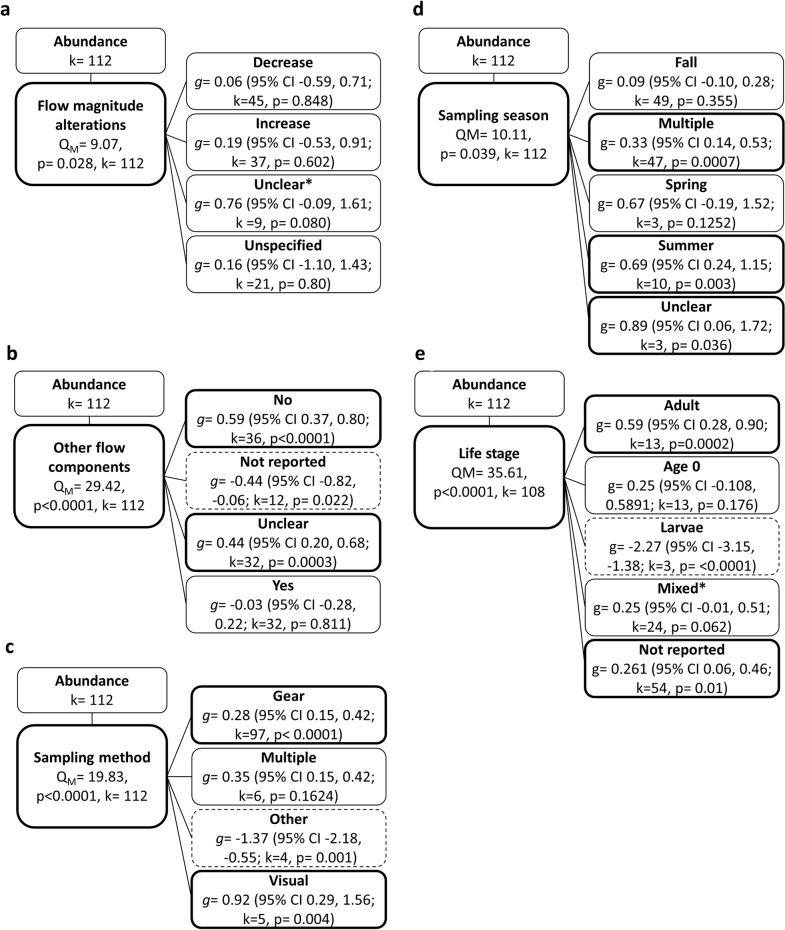
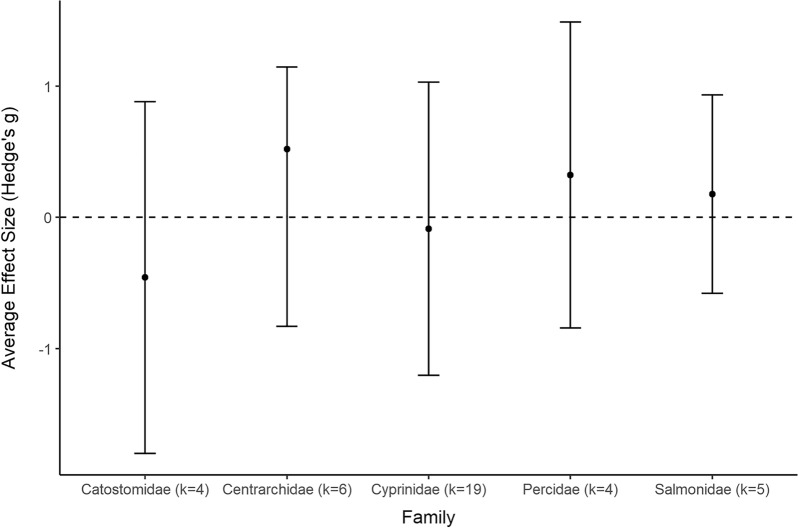
Review findings: A total of 133 studies from 103 articles were included in this systematic review for data extraction and critical appraisal. Most studies were from North America (60%) and were conducted at 146 different hydropower dams/facilities. Meta-analysis included 268 datasets from 58 studies, separated into three analyses based on replication type [temporal (within or between year replication) or spatial]. Fish abundance (226 datasets) and biomass (30 datasets) had variable responses to changes in flow magnitude with estimated overall mean effect sizes ranging from positive to negative and varying by study design and taxa. In studies with temporal replication, we found a detectable effect of alterations to the direction of flow magnitude, the presence of other flow components, sampling methods, season, and fish life stage. However, we found no detectable effect of these moderators for studies with spatial replication. Taxonomic analyses indicated variable responses to changes in flow magnitude and a bias towards salmonid species.

Conclusions: This synthesis did not find consistent patterns in fish abundance or biomass responses to alterations or changes in flow magnitude. Fish responses to flow magnitude alterations or changes were highly variable and context dependent. Our synthesis suggests that biotic responses may not be generalizable across systems impacted by hydroelectric power production and operations, where specific features of the system may be highly influential. Site-specific and adaptive management may be necessary. To improve study validity and interpretability, studies with long-term continuous monitoring, and both temporal and spatial replication are needed. When this gold standard is unfeasible, studies should strive, at minimum, to maximize replication within both intervention and comparator groups for either temporal or spatial designs. To further address knowledge gaps, studies are needed that focus on non-salmonids, multiple seasons, and systems outside of North America.

Supplementary information: The online version contains supplementary material available at 10.1186/s13750-021-00254-8.

Keywords: Anthropogenic impacts; Dam; Discharge; Evidence synthesis; Fish density; Flow modification; Hydroelectric power.


Conflict of interest statement

Competing interestsThe authors declare that they have no competing interests.

Figures

Fig. 1
Fig. 1
ROSES flow diagram [35] showing results of the literature search and study selection process showing the final number of studies included in the systematic review. Blue indicates articles/studies proceeded to next stage of review; red dashed lines indicate articles/studies were removed from consideration at that stage
Fig. 2
Fig. 2
Study validity of 185 projects in relation to the decade of publication, reported as a percentage of all projects for that decade. Projects from 1960 to 1979 were not present in the database
Fig. 3
Fig. 3
Frequency of grey and commercially published literature considering abundance and biomass and included for data extraction and critical appraisal in each decade. Articles from 1960 to1979 were not present in the database
Fig. 4
Fig. 4
Number of studies considering fish abundance and/or biomass metrics per country
Fig. 5
Fig. 5
Number of cases considering fish abundance (blue) and biomass (green) metrics per state/province in (a) Canada and (b) the United States. Note the different colour ranges in each map
Fig. 6
Fig. 6
The number of studies per family and genus of the top 10 most studied families, and their associated top five studied genera. The number of genera per family is reported in parentheses adjacent to family name. The number of studies shown exceeds the number of included studies because many studies considered multiple genera
Fig. 7
Fig. 7
Number of cases of hydroelectric power production facility operations (peaking, storage, run-of-river) in relation to dam head height: high; low; and very low head height. Unclear regime: type of hydropower production facility operation was not clearly enough described to be classed with other operational regimes; Not reported: no information on type of operational regime included
Fig. 8
Fig. 8
Number of studies with alterations to the four flow magnitude (and their combinations) elements and the direction of alteration (refer to Table 3 for definitions). Multiple indicates that more than one flow element was changed. Flow magnitude elements could be increased or decreased. In cases where multiple changes occurred, individual elements could increase and/or decrease separately (i.e., increase/decrease). Unclear indicates descriptions were provided by authors but were insufficient, while not specified indicates that no descriptions of flow magnitude element or direction of change were provided
Fig. 9
Fig. 9
Number of cases by study design and comparator. Study design codes: BA: Before/After; CI: Control/Impact; BACI: Before/After/Control/Impact; DEF_BA: deficient Before/After, INCOM-BACI: incomplete Before/After/Control/Impact; RCA: Reference Conditional Approach; ALT-CI: alternative Control/Impact. Temporal comparator codes: Existing_Hydro_alt flow: existing HPP where one flow magnitude Before is compared to a new level After intervention; Existing_Hydro_base flow: existing HPP where one base flow magnitude Before is compared to a new base flow level After intervention; New_Hydro: flow prior to the installation of a new HPP. Spatial comparator: No_Hydro: a different nearby waterbody with no HPP; Upstream: upstream conditions in unmodified sections of the study waterbody; Up + Downstream: both up and downstream unmodified sections of the study waterbody; ALT_Hydro: a different nearby waterbody with HPP operating at a different but unmodified flow magnitude. Three studies reported more than one study design; therefore, the number of cases exceeds the number of studies
Fig. 10
Fig. 10
Frequency of reported fish outcomes and life stage. Note: several studies reported more than one outcome and life stage separately. Mixed life stages include any combination of other life stages. CPUE: catch per unit effort
Fig. 11
Fig. 11
Comparison of overall average effect size for within-year BA studies one (k = 19), two (k = 5), three (k = 4) and four (k = 3) years post-intervention and when After years 1–4 were aggregated (year 1–4). Error bars indicate 95% confidence intervals. Models were developed for each of the first four years after a change in flow magnitude [i.e., comparing the most recent or only Before year with After year-1 only, After year-2 only, After year-3 only, and After year-4 only, as well as the average of years 1–4 after a change in flow magnitude. 95% confidence intervals that do not overlap with the dashed line indicate a significant effect (at the p < 0.05 level). k: number of effect sizes
Fig. 12
Fig. 12
Summary flow chart of univariate mixed models and resulting significant moderators: (a) direction of flow magnitude alterations; (b) presence of alterations to other flow components; (c) sampling method; (d) sampling season; (e) life stage. *Indicates moderately significant effect (p < 0.1). Dashed boxes indicate statistically significant negative effects, thick solid line boxes indicate statistically significant positive effects (i.e., fish abundance is greater in the After period than the Before period). k: number of datasets (i.e., effect sizes); g: Hedges’ g mean effect size; CI: 95% confidence interval
Fig. 13
Fig. 13
Average effect size by fish family for Control/Impact studies and abundance. Value in parentheses (k) is the number of effect sizes. Error bars indicate 95% confidence intervals. A positive mean value (above the dashed zero line) indicates that the abundance was higher in intervention than in comparator sites (no intervention). 95% confidence intervals that do not overlap with the dashed line indicate a significant effect (at the p < 0.05 level)
Fig. 14
Fig. 14
Average effect size by fish family for interannual Before/After studies and abundance. Value in parentheses (k) is the number of effect sizes. Error bars indicate 95% confidence intervals. A positive mean value (right of the dashed zero line) indicates that the abundance was higher in the After period (intervention) than in the Before period (no intervention). 95% confidence intervals that do not overlap with the dashed line indicate a significant effect (at the p < 0.05 level)

References

    1. Vitousek PM, Mooney HA, Lubchenco J, Melillo JM. Human domination of earth’s ecosystems. Science. 1997;277:494–9.
    1. Nilsson C, Reidy CA, Dynesius M, Revenga C. Fragmentation and flow regulation of the world’s large river systems. Science. 2005;308:405–8. - PubMed
    1. Winemiller KO, McIntyre PB, Castello L, Fluet-Chouinard E, Giarrizzo T, Nam S, et al. Balancing hydropower and biodiversity in the Amazon, Congo, and Mekong. Science. 2016;351:128–9. - PubMed
    1. Zarfl C, Lumsdon AE, Berlekamp J, Tydecks L, Tockner K. A global boom in hydropower dam construction. Aquat Sci. 2015;77:161–70.
    1. Grill G, Lehner B, Thieme M, Geenen B, Tickner D, Antonelli F, et al. Mapping the world’s free-flowing rivers. Nature. 2019;569:215–21. - PubMed

LinkOut - more resources