

Characterizing the effective reproduction number during the COVID-19 pandemic: Insights from Qatar's experience
- PMID: 35136602
- PMCID: PMC8819337
- DOI: 10.7189/jogh.12.05004
Characterizing the effective reproduction number during the COVID-19 pandemic: Insights from Qatar's experience
Abstract
Background: The effective reproduction number, Rt , is a tool to track and understand pandemic dynamics. This investigation of Rt estimations was conducted to guide the national COVID-19 response in Qatar, from the onset of the pandemic until August 18, 2021.
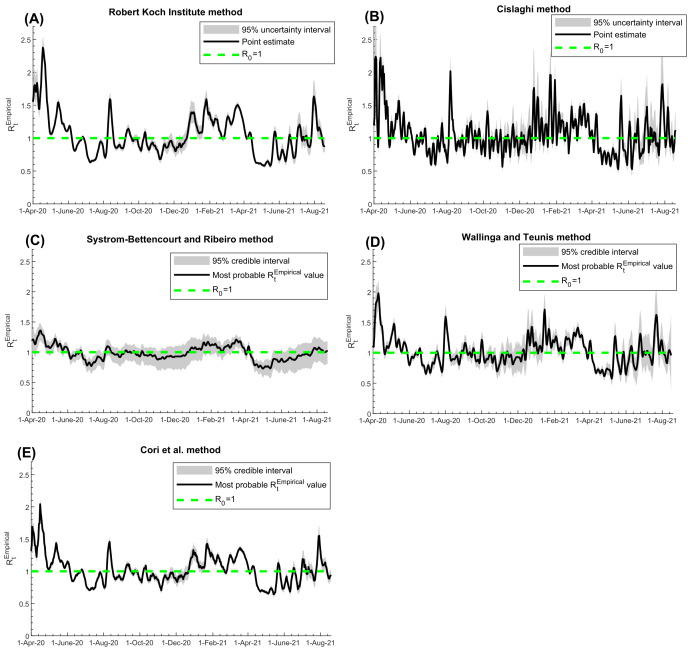
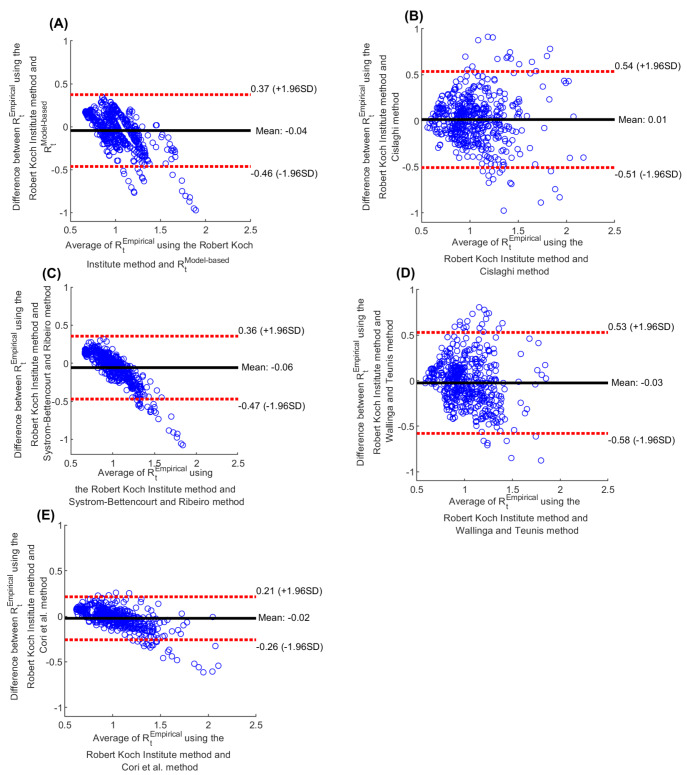
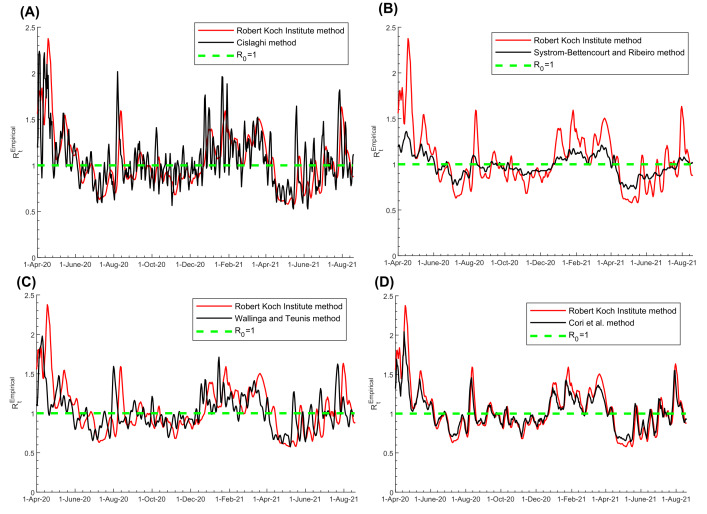
Methods: Real-time "empirical" Rt Empirical was estimated using five methods, including the Robert Koch Institute, Cislaghi, Systrom-Bettencourt and Ribeiro, Wallinga and Teunis, and Cori et al. methods. Rt was also estimated using a transmission dynamics model (Rt Model-based ). Uncertainty and sensitivity analyses were conducted. Correlations between different Rt estimates were assessed by calculating correlation coefficients, and agreements between these estimates were assessed through Bland-Altman plots.
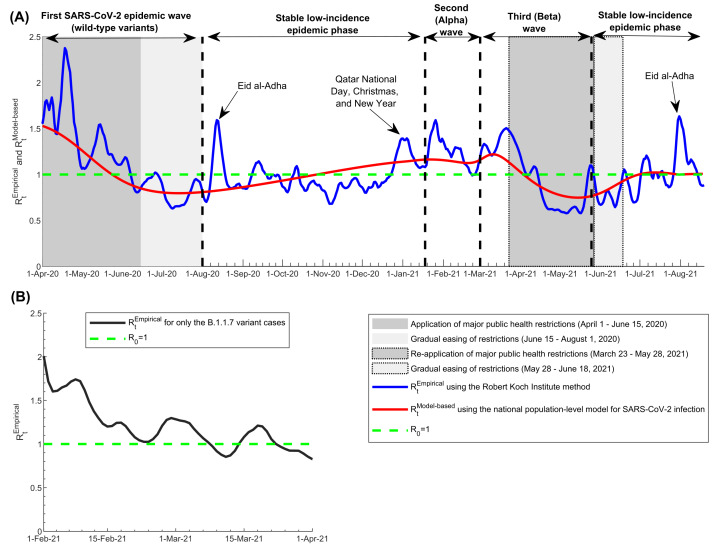
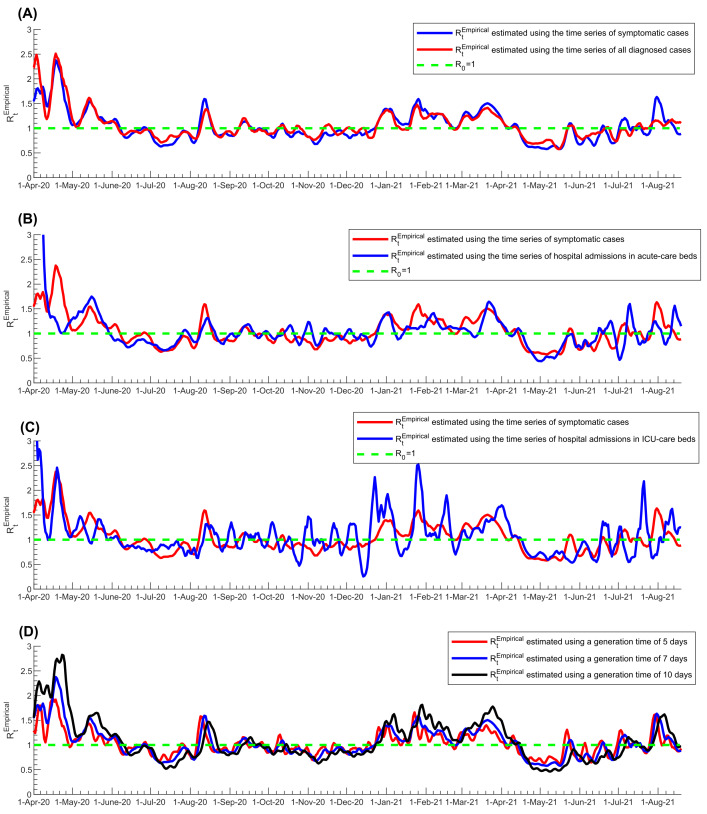
Results: Rt Empirical captured the evolution of the pandemic through three waves, public health response landmarks, effects of major social events, transient fluctuations coinciding with significant clusters of infection, and introduction and expansion of the Alpha (B.1.1.7) variant. The various estimation methods produced consistent and overall comparable Rt Empirical estimates with generally large correlation coefficients. The Wallinga and Teunis method was the fastest at detecting changes in pandemic dynamics. Rt Empirical estimates were consistent whether using time series of symptomatic PCR-confirmed cases, all PCR-confirmed cases, acute-care hospital admissions, or ICU-care hospital admissions, to proxy trends in true infection incidence. Rt Model-based correlated strongly with Rt Empirical and provided an average Rt Empirical .
Conclusions: Rt estimations were robust and generated consistent results regardless of the data source or the method of estimation. Findings affirmed an influential role for Rt estimations in guiding national responses to the COVID-19 pandemic, even in resource-limited settings.
Copyright © 2022 by the Journal of Global Health. All rights reserved.
Conflict of interest statement
Competing interests: Dr Butt has received institutional grant funding from Gilead Sciences unrelated to the work presented in this paper. The authors have completed the ICMJE Declaration of Interest Form (available upon request from the corresponding author), and declare no further conflicts of interest.
Figures
References
-
- COVID-19 Outbreak Live Update Available from: https://www.worldometers.info/coronavirus/. Accessed on March 27, 2020. 2020.
-
- United Nations. Shared responsibility, global solidarity: Responding to the socio-economic impacts of COVID-19. 2020. Available: https://www.un.org/sites/un2.un.org/files/sg_report_socio-economic_impac.... Accessed on: 16 April 2020.
-
- Kaplan J, Frias L, McFall-Johnsen M. A third of the global population is on coronavirus lockdown. Available from: https://www.businessinsider.com.au/countries-on-lockdown-coronavirus-ita... Accessd on: April 25, 2020. Business Insider Australia. 2020.
MeSH terms
Supplementary concepts
LinkOut - more resources
Full Text Sources
Medical
