

Creating Surveillance Data Infrastructure Using Laboratory Analytics: Leveraging Visiun and Epic Systems to Support COVID-19 Pandemic Response
- PMID: 35136670
- PMCID: PMC8794025
- DOI: 10.4103/jpi.jpi_54_21
Creating Surveillance Data Infrastructure Using Laboratory Analytics: Leveraging Visiun and Epic Systems to Support COVID-19 Pandemic Response
Abstract
Background: Pandemics are unpredictable and can rapidly spread. Proper planning and preparation for managing the impact of outbreaks is only achievable through continuous and systematic collection and analysis of health-related data. We describe our experience on how to comply with required reporting and develop a robust platform for surveillance data during an outbreak.
Materials and methods: At Mount Sinai Health System, New York City, we applied Visiun, a laboratory analytics dashboard, to support main response activities. Epic System Inc.'s SlicerDicer application was used to develop clinical and research reports. We followed World Health Organization (WHO); federal and state guidelines; departmental policies; and expert consultation to create the framework.
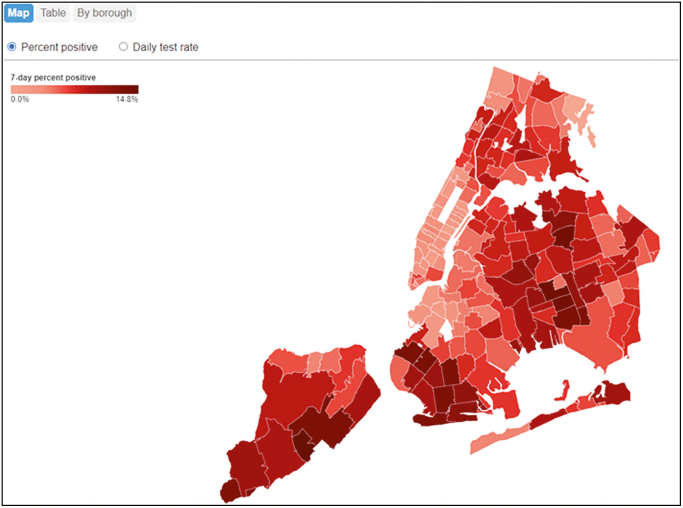
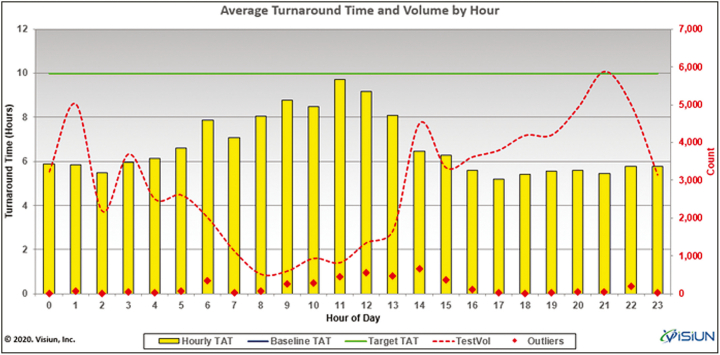
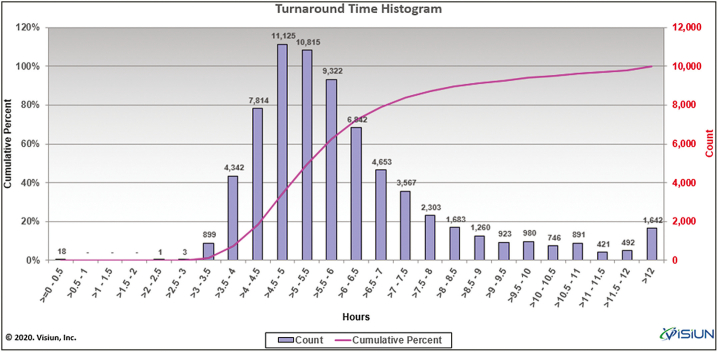
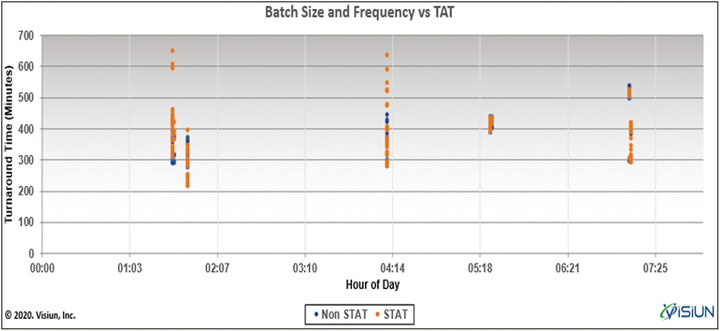
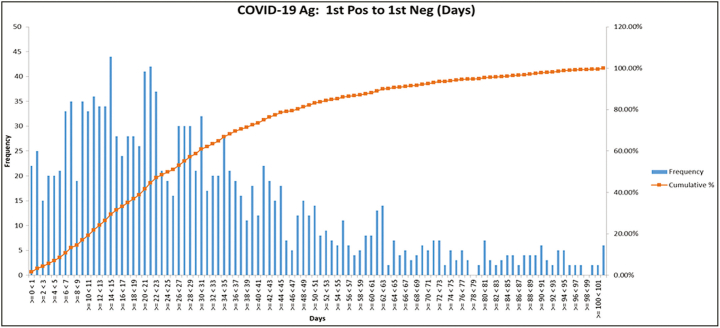
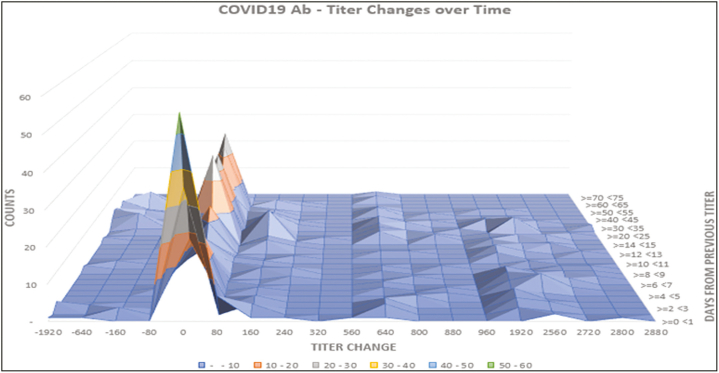
Results: The developed dashboard integrated data from scattered sources are used to seamlessly distribute reports to key stakeholders. The main report categories included federal, state, laboratory, clinical, and research. The first two groups were created to meet government and state reporting requirements. The laboratory group was the most comprehensive category and included operational reports such as performance metrics, technician performance assessment, and analyzer metrics. The close monitoring of testing volumes and lab operational efficiency was essential to manage increasing demands and provide timely and accurate results. The clinical data reports were valuable for proper managing of medical surge requirements, such as healthcare workforce and medical supplies. The reports included in the research category were highly variable and depended on healthcare setting, research priorities, and available funding. We share a few examples of queries that were included in the designed framework for research projects.
Conclusion: We reviewed here the key components of a conceptual surveillance framework required for a robust response to COVID-19 pandemics. We demonstrated leveraging a lab analytics dashboard, Visiun, combined with Epic reporting tools to function as a surveillance system. The framework could be used as a generic template for possible future outbreak events.
Keywords: COVID-19; lab analytics; pandemic; surveillance; visiun.
Copyright: © 2022 Journal of Pathology Informatics.
Conflict of interest statement
There are no conflicts of interest.
Figures
Similar articles
-
Critical Care Network in the State of Qatar.Qatar Med J. 2019 Nov 7;2019(2):2. doi: 10.5339/qmj.2019.qccc.2. eCollection 2019. Qatar Med J. 2019. PMID: 31763205 Free PMC article.
-
Modeling and tracking Covid-19 cases using Big Data analytics on HPCC system platformm.J Big Data. 2021;8(1):33. doi: 10.1186/s40537-021-00423-z. Epub 2021 Feb 15. J Big Data. 2021. PMID: 33614394 Free PMC article.
-
The future of Cochrane Neonatal.Early Hum Dev. 2020 Nov;150:105191. doi: 10.1016/j.earlhumdev.2020.105191. Epub 2020 Sep 12. Early Hum Dev. 2020. PMID: 33036834
-
A conceptual framework for Emergency department design in a pandemic.Scand J Trauma Resusc Emerg Med. 2020 Dec 17;28(1):118. doi: 10.1186/s13049-020-00809-7. Scand J Trauma Resusc Emerg Med. 2020. PMID: 33334364 Free PMC article. Review.
-
Surge capacity logistics: care of the critically ill and injured during pandemics and disasters: CHEST consensus statement.Chest. 2014 Oct;146(4 Suppl):e17S-43S. doi: 10.1378/chest.14-0734. Chest. 2014. PMID: 25144407 Review.
References
-
- Archived: WHO Timeline—COVID-19 [Internet].(2022) World Health Organization [published June 29, 2020]. Available from: https://www.who.int/news/item/29-06-2020-covidtimeline. [Last accessed on Feb 2, 2021].
-
- WHO Director-General’s Opening Remarks at the Media Briefing on COVID-19 [Internet]. (2022) World Health Organization [published March 11, 2020]. Available from: https://www.who.int/director-general/speeches/detail/who-director-genera... [Last accessed on Jan 20, 2021].
-
- White House Asks All Hospitals to Report Data on COVID-19 Testing [Internet] Miliard, Mike. Healthcare ITNews. www.healthcareitnews.com/news/white-house-asks-all-hospitals-report-data... [published March 30, 2020]. Available from. [Last accessed on May 2, 2020]
LinkOut - more resources
Full Text Sources
Miscellaneous
