

An Expandable Informatics Framework for Enhancing Central Cancer Registries with Digital Pathology Specimens, Computational Imaging Tools, and Advanced Mining Capabilities
- PMID: 35136672
- PMCID: PMC8794027
- DOI: 10.4103/jpi.jpi_31_21
An Expandable Informatics Framework for Enhancing Central Cancer Registries with Digital Pathology Specimens, Computational Imaging Tools, and Advanced Mining Capabilities
Abstract
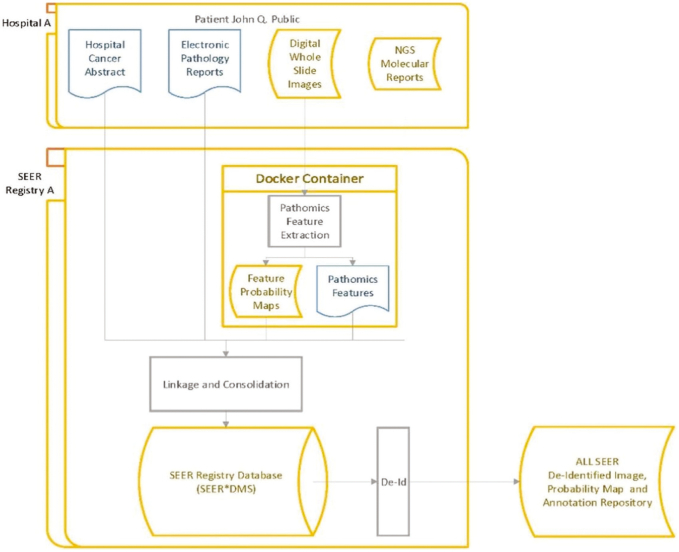
Background: Population-based state cancer registries are an authoritative source for cancer statistics in the United States. They routinely collect a variety of data, including patient demographics, primary tumor site, stage at diagnosis, first course of treatment, and survival, on every cancer case that is reported across all U.S. states and territories. The goal of our project is to enrich NCI's Surveillance, Epidemiology, and End Results (SEER) registry data with high-quality population-based biospecimen data in the form of digital pathology, machine-learning-based classifications, and quantitative histopathology imaging feature sets (referred to here as Pathomics features).
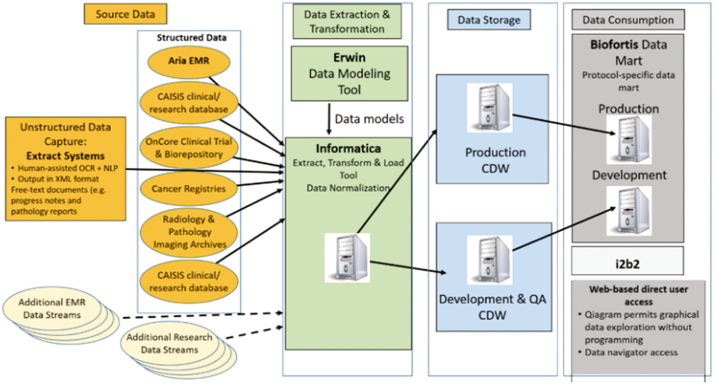
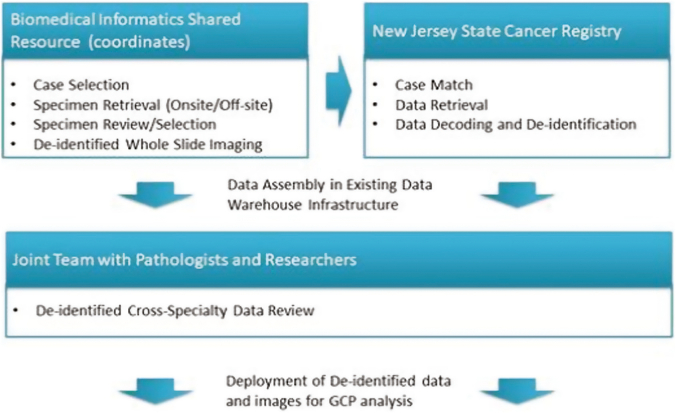
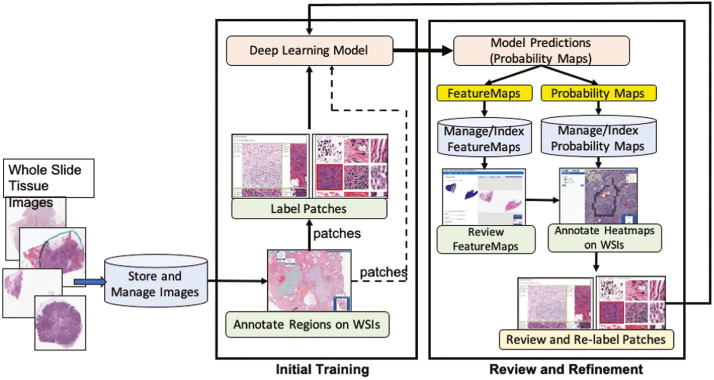
Materials and methods: As part of the project, the underlying informatics infrastructure was designed, tested, and implemented through close collaboration with several participating SEER registries to ensure consistency with registry processes, computational scalability, and ability to support creation of population cohorts that span multiple sites. Utilizing computational imaging algorithms and methods to both generate indices and search for matches makes it possible to reduce inter- and intra-observer inconsistencies and to improve the objectivity with which large image repositories are interrogated.
Results: Our team has created and continues to expand a well-curated repository of high-quality digitized pathology images corresponding to subjects whose data are routinely collected by the collaborating registries. Our team has systematically deployed and tested key, visual analytic methods to facilitate automated creation of population cohorts for epidemiological studies and tools to support visualization of feature clusters and evaluation of whole-slide images. As part of these efforts, we are developing and optimizing advanced search and matching algorithms to facilitate automated, content-based retrieval of digitized specimens based on their underlying image features and staining characteristics.
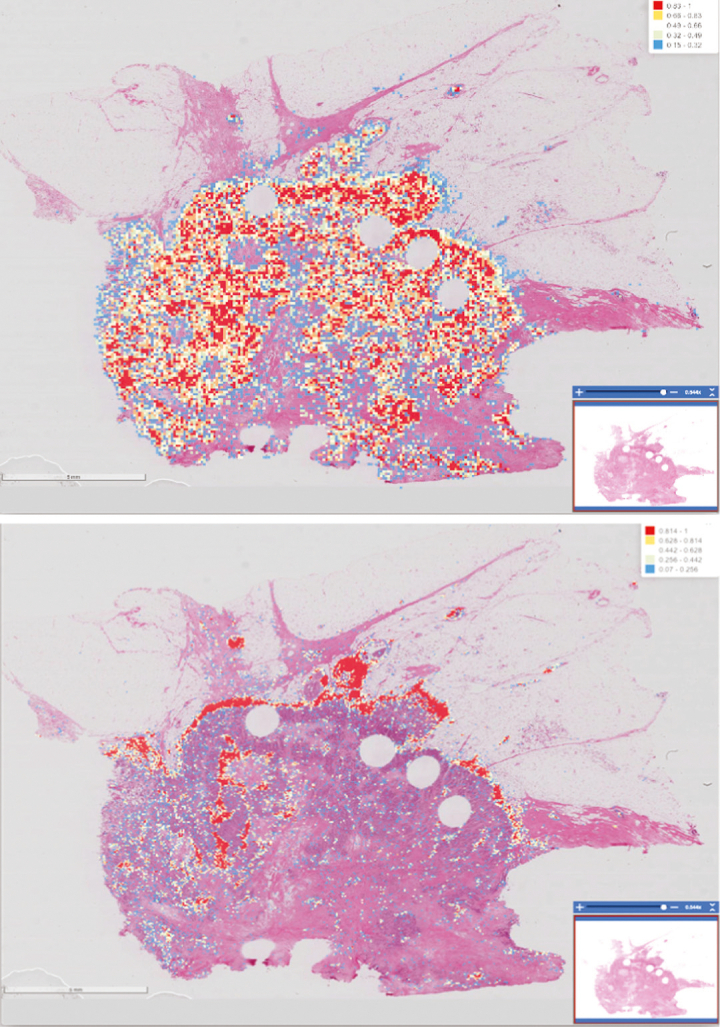
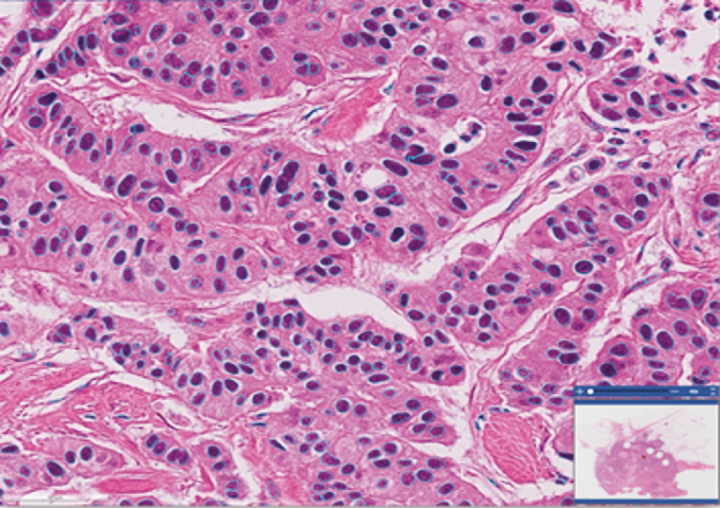
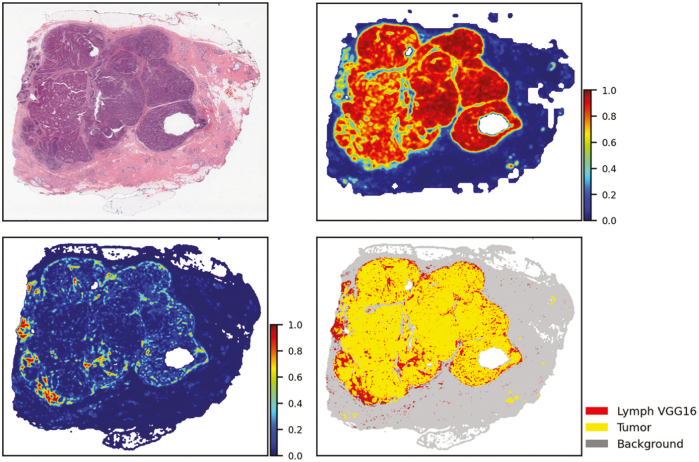
Conclusion: To meet the challenges of this project, we established the analytic pipelines, methods, and workflows to support the expansion and management of a growing repository of high-quality digitized pathology and information-rich, population cohorts containing objective imaging and clinical attributes to facilitate studies that seek to discriminate among different subtypes of disease, stratify patient populations, and perform comparisons of tumor characteristics within and across patient cohorts. We have also successfully developed a suite of tools based on a deep-learning method to perform quantitative characterizations of tumor regions, assess infiltrating lymphocyte distributions, and generate objective nuclear feature measurements. As part of these efforts, our team has implemented reliable methods that enable investigators to systematically search through large repositories to automatically retrieve digitized pathology specimens and correlated clinical data based on their computational signatures.
Keywords: Cancer registries; computational imaging; deep-learning; digital pathology.
Copyright: © 2022 Journal of Pathology Informatics.
Conflict of interest statement
There are no conflicts of interest.
Figures
Similar articles
-
An Intelligent Search & Retrieval System (IRIS) and Clinical and Research Repository for Decision Support Based on Machine Learning and Joint Kernel-based Supervised Hashing.Cancer Inform. 2024 Feb 4;23:11769351231223806. doi: 10.1177/11769351231223806. eCollection 2024. Cancer Inform. 2024. PMID: 38322427 Free PMC article.
-
A data model and database for high-resolution pathology analytical image informatics.J Pathol Inform. 2011;2:32. doi: 10.4103/2153-3539.83192. Epub 2011 Jul 26. J Pathol Inform. 2011. PMID: 21845230 Free PMC article.
-
Image analysis and machine learning in digital pathology: Challenges and opportunities.Med Image Anal. 2016 Oct;33:170-175. doi: 10.1016/j.media.2016.06.037. Epub 2016 Jul 4. Med Image Anal. 2016. PMID: 27423409 Free PMC article. Review.
-
Content-based histopathology image retrieval using CometCloud.BMC Bioinformatics. 2014 Aug 26;15(1):287. doi: 10.1186/1471-2105-15-287. BMC Bioinformatics. 2014. PMID: 25155691 Free PMC article.
-
Pathology imaging informatics for quantitative analysis of whole-slide images.J Am Med Inform Assoc. 2013 Nov-Dec;20(6):1099-108. doi: 10.1136/amiajnl-2012-001540. Epub 2013 Aug 19. J Am Med Inform Assoc. 2013. PMID: 23959844 Free PMC article. Review.
Cited by
-
An Intelligent Search & Retrieval System (IRIS) and Clinical and Research Repository for Decision Support Based on Machine Learning and Joint Kernel-based Supervised Hashing.Cancer Inform. 2024 Feb 4;23:11769351231223806. doi: 10.1177/11769351231223806. eCollection 2024. Cancer Inform. 2024. PMID: 38322427 Free PMC article.
-
Biobanking in the digital pathology era.Oncol Res. 2022 Aug 31;29(4):229-233. doi: 10.32604/or.2022.024892. eCollection 2021. Oncol Res. 2022. PMID: 37303941 Free PMC article.
References
-
- Allsbrook W.C., Jr., Mangold K.A., Johnson M.H., Lane R.B., Lane C.G., Epstein J.I. Interobserver reproducibility of Gleason grading of prostatic carcinoma: General pathologist. Hum Pathol. 2001;32:81–88. - PubMed
-
- Berney D.M., Algaba F., Camparo P., et al. The reasons behind variation in Gleason grading of prostatic biopsies: Areas of agreement and misconception among 266 European pathologists. Histopathology. 2014;64:405–411. - PubMed
-
- Bueno-de-Mesquita J.M., Nuyten D.S., Wesseling J., van Tinteren H., Linn S.C., van de Vijver M.J. The impact of inter-observer variation in pathological assessment of node-negative breast cancer on clinical risk assessment and patient selection for adjuvant systemic treatment. Ann Oncol. 2010;21:40–47. - PubMed
-
- Grilley-Olson J.E., Hayes D.N., Moore D.T., et al. Validation of interobserver agreement in lung cancer assessment: Hematoxylin-eosin diagnostic reproducibility for non-small cell lung cancer: The 2004 World Health Organization classification and therapeutically relevant subsets. Arch Pathol Lab Med. 2013;137:32–40. - PMC - PubMed
-
- Matasar M.J., Shi W., Silberstien J., et al. Expert second-opinion pathology review of lymphoma in the era of the World Health Organization classification. Ann Oncol. 2012;23:159–166. - PubMed
Grants and funding
LinkOut - more resources
Full Text Sources
Research Materials
