

A doubling of atmospheric CO2 mitigates the effects of severe drought on maize through the preservation of soil water
- PMID: 35136917
- PMCID: PMC9007090
- DOI: 10.1093/aob/mcac015
A doubling of atmospheric CO2 mitigates the effects of severe drought on maize through the preservation of soil water
Abstract
Background and aims: Drought limits maize production in many regions of the world, and this is likely to intensify in future. Elevated atmospheric CO2 (eCO2) can mitigate this by reducing stomatal conductance and water loss without reducing yield. The magnitude of this effect depends on the interaction of eCO2 and drought severity, but scarce data collected under severe drought conditions limit predictions of future maize production.
Methods: We compared the severe drought × eCO2 responses of six maize genotypes from semi-arid and sub-humid growing regions.
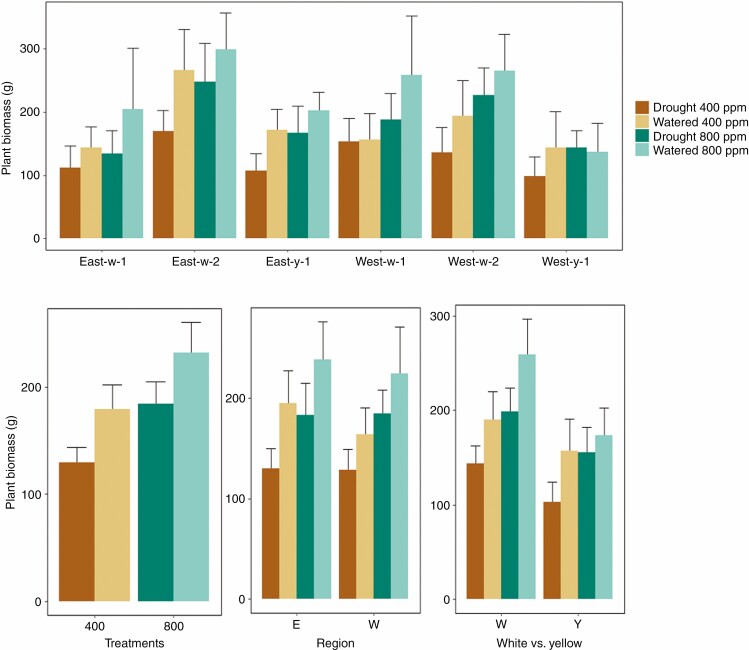
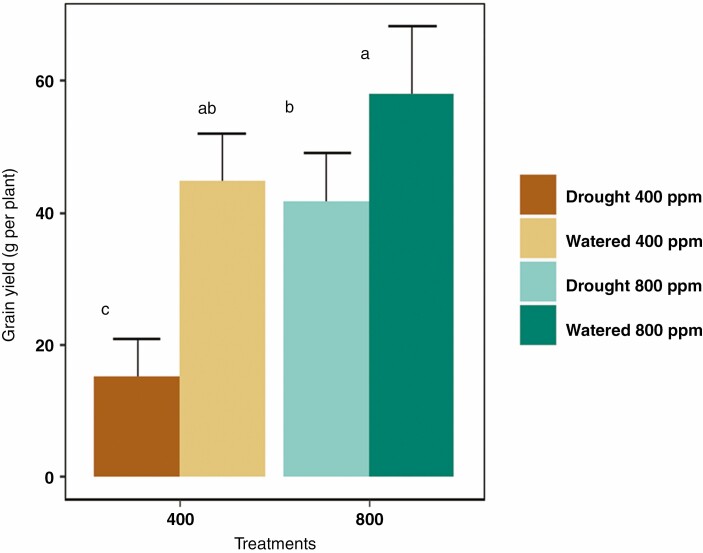
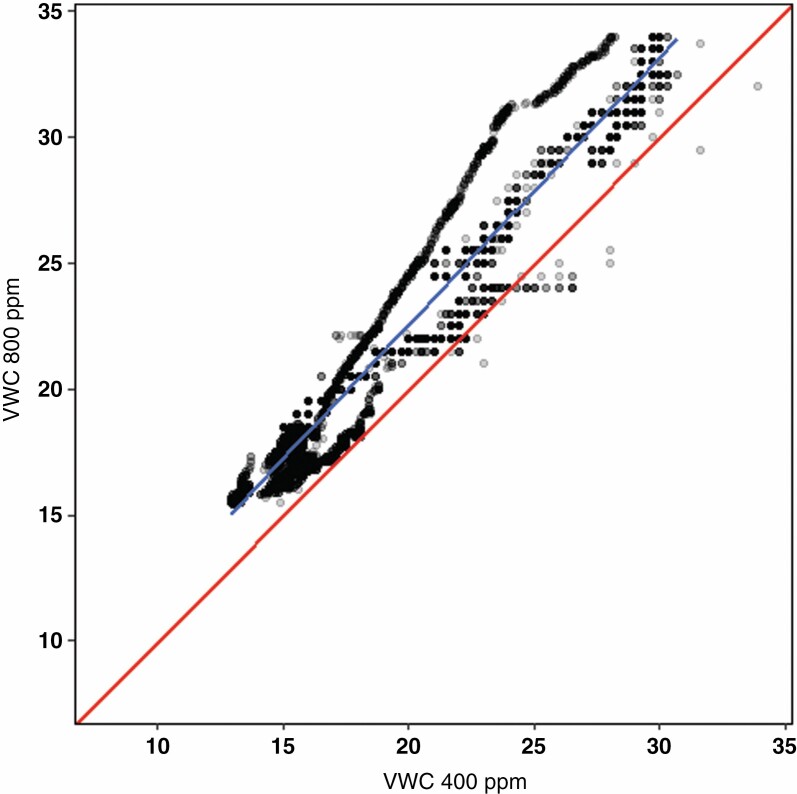
Key results: Genotypic differences were apparent in growth, gas exchange, water relations, grain quality, and biomass at maturity, but the response to eCO2 was consistent. Plants under drought and eCO2 had similar biomass and yield to irrigated plants at ambient CO2. Reduced stomatal conductance and water loss preserved soil moisture equivalent to 35 mm of rainfall and allowed sustained photosynthesis at higher rates for a longer period after watering stopped. Under irrigation, eCO2 improved maize growth but not grain yield.
Conclusions: The results suggest that eCO2 may extend the future land area available to rainfed maize cultivation, but cannot circumvent the absence of seasonal rainfall that restricts maize growth. Elevated CO2 will reduce water requirements of irrigated maize when atmospheric conditions drive high evapotranspiration.
Keywords: C4 photosynthesis; Climate change; crop production; elevated CO2; grain quality; maize genotypes; severe drought; yield.
© The Author(s) 2022. Published by Oxford University Press on behalf of the Annals of Botany Company. All rights reserved. For permissions, please e-mail: journals.permissions@oup.com.
Figures


Similar articles
-
Response of maize biomass and soil water fluxes on elevated CO2 and drought-From field experiments to process-based simulations.Glob Chang Biol. 2019 Sep;25(9):2947-2957. doi: 10.1111/gcb.14723. Epub 2019 Jul 4. Glob Chang Biol. 2019. PMID: 31166058
-
Phosphorus application and elevated CO2 enhance drought tolerance in field pea grown in a phosphorus-deficient vertisol.Ann Bot. 2015 Nov;116(6):975-85. doi: 10.1093/aob/mcu209. Epub 2014 Nov 26. Ann Bot. 2015. PMID: 25429008 Free PMC article.
-
Elevated CO2 increases water use efficiency by sustaining photosynthesis of water-limited maize and sorghum.J Plant Physiol. 2011 Nov 1;168(16):1909-18. doi: 10.1016/j.jplph.2011.05.005. Epub 2011 Jun 14. J Plant Physiol. 2011. PMID: 21676489
-
Effects of water deficit stress on agronomic and physiological responses of rice and greenhouse gas emission from rice soil under elevated atmospheric CO2.Sci Total Environ. 2019 Feb 10;650(Pt 2):2032-2050. doi: 10.1016/j.scitotenv.2018.09.332. Epub 2018 Sep 29. Sci Total Environ. 2019. PMID: 30290346 Review.
-
Genetically modified maize hybrids and delayed sowing reduced drought effects across a rainfall gradient in temperate Argentina.J Exp Bot. 2021 Jul 10;72(14):5180-5188. doi: 10.1093/jxb/erab139. J Exp Bot. 2021. PMID: 33770157 Review.
Cited by
-
Elevated CO2 ameliorates the high temperature stress effects on physio-biochemical, growth, yield traits of maize hybrids.Sci Rep. 2024 Feb 5;14(1):2928. doi: 10.1038/s41598-024-53343-2. Sci Rep. 2024. PMID: 38316909 Free PMC article.
-
Cell wall modulation by drought and elevated CO2 in sugarcane leaves.Front Plant Sci. 2025 Apr 30;16:1567201. doi: 10.3389/fpls.2025.1567201. eCollection 2025. Front Plant Sci. 2025. PMID: 40370365 Free PMC article.
References
-
- Abebe A, Pathak S, Singh S, Bhatia A. 2016. Growth, yield and quality of maize with elevated atmospheric carbon dioxide and temperature in north-west India. Agriculture Ecosystems & Environment 218: 66–72.
-
- Adisa OM, Botai JO, Adeola AM, et al. . 2019. Analysis of drought conditions over major maize producing provinces of South Africa. Journal of Agricultural Meteorology 75: 173–182.
-
- Ainsworth EA, Rogers A. 2007. The response of photosynthesis and stomatal conductance to rising [CO2]: mechanisms and environmental interactions. Plant, Cell & Environment 30: 258–270. - PubMed
-
- Allen LLH, Kakani VG, Vu JCV, Boote KJ. 2011. Elevated CO2 increases water use efficiency by sustaining photosynthesis of water-limited maize and sorghum. Journal of Plant Physiology 168: 1909–1918. - PubMed
-
- Archer E, Landman W, Tadross M, Malherbe J, Weepener H, Maluleke P, Marumbwa F. 2017. Understanding the evolution of the 2014–2016 summer rainfall seasons in southern Africa: key lessons. Climate Risk Management 16: 22–28.
Publication types
MeSH terms
Substances
LinkOut - more resources
Full Text Sources
Miscellaneous
