. 2023 Jan 5;146(1):91-108.
doi: 10.1093/brain/awac051.

Optimization of closed-loop electrical stimulation enables robust cerebellar-directed seizure control

Affiliations

Optimization of closed-loop electrical stimulation enables robust cerebellar-directed seizure control

Bethany J Stieve et al. Brain. .

Abstract

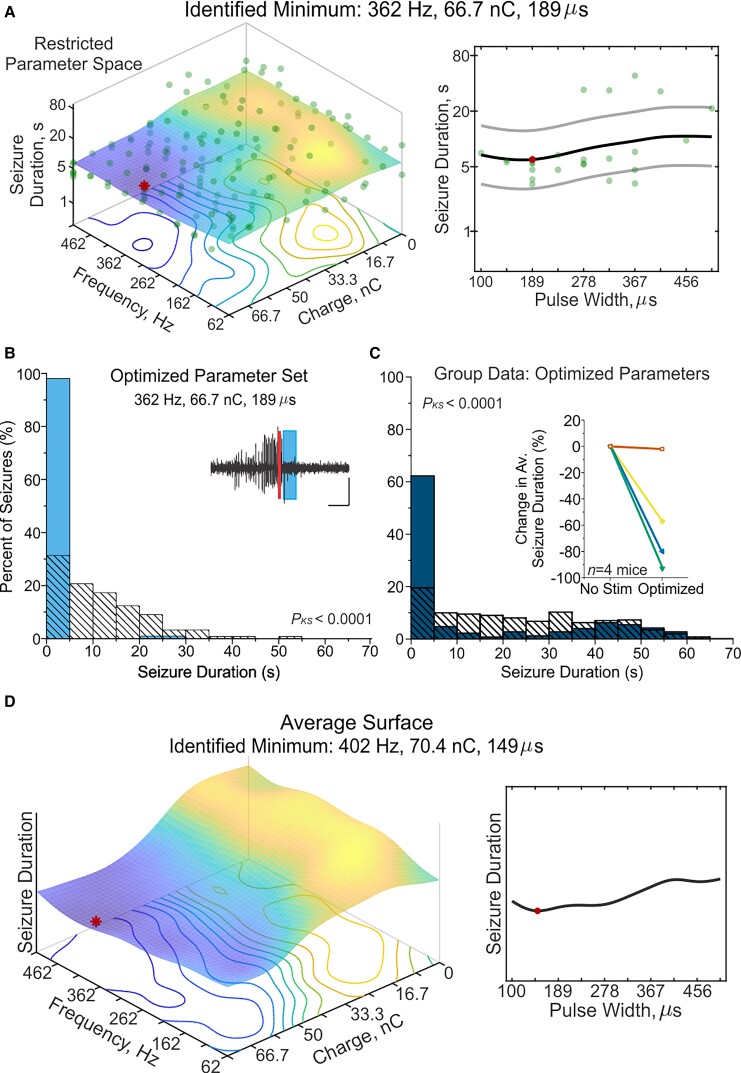
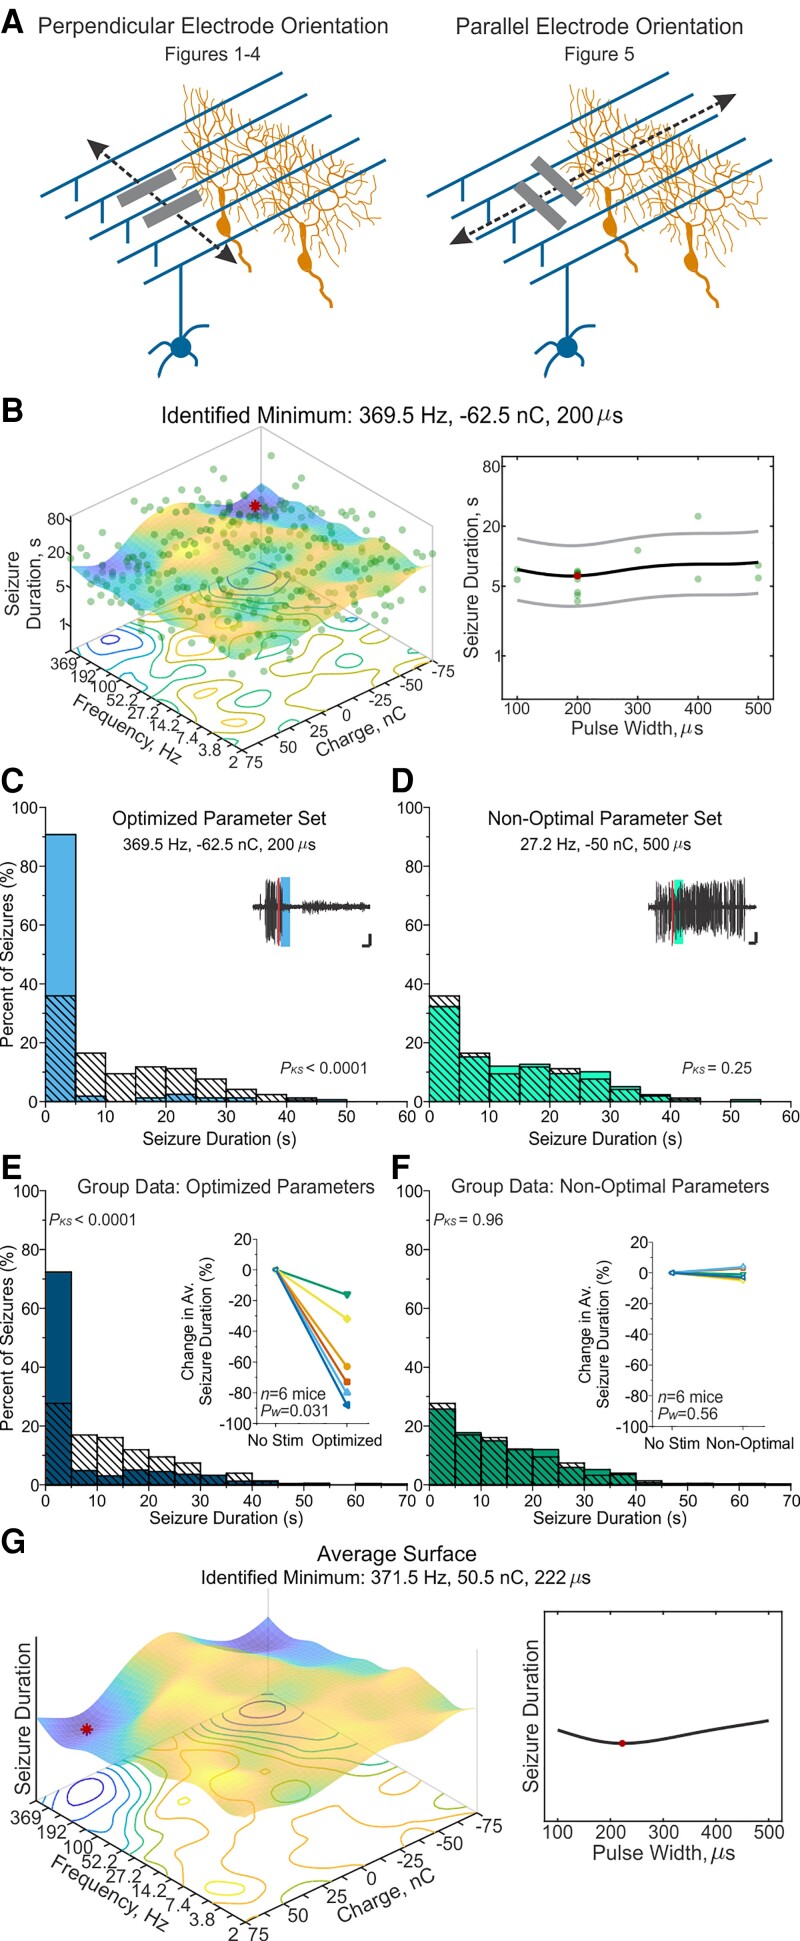
Additional treatment options for temporal lobe epilepsy are needed, and potential interventions targeting the cerebellum are of interest. Previous animal work has shown strong inhibition of hippocampal seizures through on-demand optogenetic manipulation of the cerebellum. However, decades of work examining electrical stimulation-a more immediately translatable approach-targeting the cerebellum has produced very mixed results. We were therefore interested in exploring the impact that stimulation parameters may have on seizure outcomes. Using a mouse model of temporal lobe epilepsy, we conducted on-demand electrical stimulation of the cerebellar cortex, and varied stimulation charge, frequency and pulse width, resulting in over 1000 different potential combinations of settings. To explore this parameter space in an efficient, data-driven, manner, we utilized Bayesian optimization with Gaussian process regression, implemented in MATLAB with an Expected Improvement Plus acquisition function. We examined three different fitting conditions and two different electrode orientations. Following the optimization process, we conducted additional on-demand experiments to test the effectiveness of selected settings. Regardless of experimental setup, we found that Bayesian optimization allowed identification of effective intervention settings. Additionally, generally similar optimal settings were identified across animals, suggesting that personalized optimization may not always be necessary. While optimal settings were effective, stimulation with settings predicted from the Gaussian process regression to be ineffective failed to provide seizure control. Taken together, our results provide a blueprint for exploration of a large parameter space for seizure control and illustrate that robust inhibition of seizures can be achieved with electrical stimulation of the cerebellum, but only if the correct stimulation parameters are used.

Keywords: DBS; neuromodulation; personalized medicine; responsive neurostimulation; search algorithm.


Conflict of interest statement

T.N. holds equity in, and serves as Chief Scientific Officer of StimSherpa, which has licensed METHOD FOR ADAPTIVE CONTROL OF A MEDICAL DEVICE USING BAYESIAN OPTIMIZATION from the University of Minnesota. The University of Minnesota holds equity and is entitled to royalty and other payments under a license agreement with StimSherpa. These interests have been reviewed and managed by the University of Minnesota in accordance with its Conflict of Interest policies. The authors report no other competing interests.

Figures

Figure 1
Figure 1
On-demand Bayesian optimization of cerebellar-directed seizure-intervention. (A) Online hippocampal seizure detection triggers electrical stimulation of the cerebellar cortex (on-demand loop). Seizure duration is recorded in real-time and Gaussian process regression is used to build a response-surface (Bayesian optimization loop). The response-surface is updated with each event, and the next set of parameters to test is determined via Bayesian optimization. Note that only frequency and charge are illustrated here, but optimization occurred over frequency, charge, and pulse width. (B) An example final response-surface where cooler and warmer colours represent shorter and longer event durations, respectively. The larger (red) dot indicates the identified minimum, representing the optimal parameter. Due to the high dimensionality of the data, three planes are shown. In the top row, the interaction of frequency versus charge for combinations with 300 µs pulse width is shown on the left, while the impact of pulse width, at 369.5 Hz and 62.5 nC, is shown on the right. The next rows follow the same pattern, highlighting the interaction of frequency and pulse width, and the impact of charge (middle row), and the interaction of pulse width and charge, and the impact of frequency (bottom row). Note that in subsequent figures, only one plane for a given response-surface is illustrated, through the identified minimum. (C) A parameter walk from the same example animal as in B, demonstrating that the optimizer selects a range of parameters (green dots), and updates the estimate of the best set of parameters (blue line) with each event. In this example, the optimizer settles on 369.5 Hz, 62.5 nC and 300 µs, but continues to test several other combinations of settings. Note that tick marks on the y-axis indicate the discrete steps tested for each parameter. Related data can be found in Supplementary Figs 1 and 2 and Supplementary Table 1.
Figure 2
Figure 2
Electrical stimulation of the cerebellum with optimized parameters provides seizure-control. (A) Example seizure events from the same animal shown in Fig. 1. Events were detected online (thin red bar) and received, in a random, interleaved fashion, no stimulation (top), stimulation with optimal parameters (middle, blue bar) or stimulation with non-optimal parameters (bottom, green bar). Stimulation was delivered for 3 s, with frequency, charge, and pulse width determined by the final response-surface (Fig. 1B). Scale bar = 5 s, 0.5 mV. (B and C) Post-stimulation-onset seizure duration distributions for the example animal shown in A. (B) Seizure duration distributions when stimulation was applied with the optimized parameter set of 369.5 Hz frequency, 62.5 nC charge, and 300 µs pulse width (filled light blue bars) versus no-stimulation (hashed bars). In this example animal, an 87% reduction in seizure duration occurred (P < 0.0001, Kolmogorov–Smirnov test). (C) Seizure duration distributions for the non-optimal parameter set (filled light green bars; in this animal: 138.9 Hz, −25 nC, and 400 µs pulse width), or for comparison, no-stimulation (hashed bars). In this animal, a non-significant 4% increase in seizure duration was noted with non-optimal stimulation (P = 0.43, Kolmogorov–Smirnov test). Note that the same no-stimulation seizure duration distribution is overlaid in B and C. (D and E) Post-stimulation-onset seizure duration distributions across animals (n = 7 mice), using 100 randomly chosen seizure events per condition per animal, and with the same no-stimulation dataset illustrated for comparison (hashed bars) in both D and E. (D) Filled dark blue bars: Events receiving each animal’s optimized stimulation; hashed bars: no-stimulation control. Stimulation with optimized parameters provides significant and consistent seizure-reduction [inset: significant at the individual level in seven of seven animals tested; average 70.7 ± 8.2% reduction in seizure duration, P = 0.016, Wilcoxon test (W)]. (E) Filled dark green bars: Events with non-optimal parameters; hashed bars: no stimulation control. Inset: No significant change in seizure duration with non-optimal parameters (insignificant change in 7/7 animals; on average a 0.7 ± 2.7% reduction in seizure duration, P = 0.84, Wilcoxon test). (F) Average response-surface, based on the final response-surfaces of the seven mice. Red dot marks the minimum of the surface at 460.1 Hz, 59.7 nC, and 149 µs pulse width. (G) Group-level post-stimulation-onset seizure duration distributions; 100 random seizure events per condition per animal. Left: Filled dark blue bars: Seizure duration when stimulation was applied with each animal’s individualized optimized parameter set. Middle: Filled purple bars: Seizure duration with stimulation settings based on the most commonly identified optimal parameters (group mode parameters; 266.7 Hz, −62.5 nC, 400 µs pulse width; Table 1). Right: Filled red bars: Seizure duration with stimulation settings based on the minimum of the average surface (460.1 Hz, 59.7 nC, 149 μs pulse width, see F). Hashed bars = no stimulation control. (H) Stimulation with optimized parameters significantly reduces seizure duration whether parameters are derived from individualized optimization (left, average 52.1 ± 10.3% reduction, P = 0.016 Wilcoxon test), or group-derived settings based on the mode (middle, average 42.7 ± 10.0% reduction; P = 0.016 Wilcoxon test) or the minimum of the average surface (right, 47.4 ± 11.4% reduction, P = 0.016 Wilcoxon test). At the group level, there was no significant difference in seizure-reduction between any of the three optimized stimulation conditions (P > 0.375 for each comparison, Wilcoxon test). Note that each colour/symbol represents a different animal, with colour coding consistent throughout the panel. Open symbols: Insignificant change at the individual animal level (P > 0.05). Closed symbols: Significant change (P < 0.01) for Kolmogorov–Smirnov and Mann–Whitney tests at the individual animal level. Related data can be found in Supplementary Figs  3–6 and 11 and Supplementary Tables 1–3. KS = two-sample Kolmogorov-Smirnov statistical test.
Figure 3
Figure 3
Bayesian optimization identifies effective parameters also under less flexible conditions. (A) Example animal’s final response-surface from optimization within the second parameter space, where the number of divisions was reduced from 18 to nine and 13 to seven across the frequency and charge dimensions, respectively. Total number of non-zero stimulation combinations was reduced from 1080 to 270. Additionally, the effective length-scales were increased, causing the surface to be less flexible, or more generalized. (This animal’s more flexible surface optimization can be seen in Supplementary Fig. 3). (B and C) Post-stimulation-onset seizure duration distributions for the example animal shown in A. Left filled light blue bars: Events receiving optimized stimulation; right light green bars: events receiving non-optimal stimulation; hashed bars: no-stimulation internal control for comparison. (B) A 96% reduction in seizure duration was observed in this animal when the optimized parameter set of 512 Hz, 75 nC, and 100 µs pulse width was applied (P < 0.0001 Kolmogorov–Smirnov test). Inset: Example seizure event receiving the optimized stimulation (thick blue bar) following detection (thin red line). Scale = 5 s, 0.5 mV. (C) This example animal showed a non-significant 6% increase in seizure duration (P = 0.98 Kolmogorov–Smirnov test) when stimulation was applied with the non-optimal parameter set of 4 Hz, −50 nC, and 400 µs pulse width. Inset: Example seizure event receiving non-optimal stimulation (thick green bar) following detection (thin red line). Scale = 5 s, 0.5 mV. (D and E) Post-stimulation-onset seizure duration distributions at the group level (100 random seizure events per condition per animal). Left filled dark blue bars: Events receiving optimized stimulation; right filled dark green bars: events with non-optimal parameters; hashed bars: no stimulation control. (D) Seizure duration when stimulation was applied with each animal’s individualized optimized parameter set (P < 0.0001 two-sample Kolmogorov–Smirnov test, n = 6 mice). Inset: Stimulation with individualized optimized parameters provides consistent, significant, seizure-reduction (78.7 ± 4.4% reduction in seizure duration, P = 0.031 Wilcoxon test (W), significant at the individual animal level in 6/6 mice). (E) Seizure duration with a non-optimal parameter set unique to each animal (P = 0.12 two-sample Kolmogorov–Smirnov test, n = 6 mice). Inset: Non-optimal parameters do not change seizure duration (9.8 ± 3.5% reduction in seizure duration, P = 0.063 Wilcoxon test, not-significant in 5/6 mice). Note that each colour/symbol represents a different animal, with colour coding consistent in D and E. Open symbols: Insignificant change at the individual animal level (P > 0.05). Closed symbols: Significant change for Kolmogorov–Smirnov and Mann–Whitney test (P < 0.01) at the individual animal level. (F) Average response-surface, based on the final response-surfaces of the six mice. Red dot marks the minimum of the surface at 125.2 Hz, 71.9 nC, and 149 µs pulse width. Related data can be found in Supplementary Figs 4, 7 and 11 and Supplementary Tables 4 and 5. KS = two-sample Kolmogorov-Smirnov statistical test.
Figure 4
Figure 4
Optimization in a restricted parameter space. Optimization was conducted using a third parameter space, where the range of the frequency and charge dimensions was restricted compared the two previous parameter spaces. Additionally, all parameters were explored with 10 linearly spaced step sizes; 62–512 Hz (frequency), 0–75 nC (charge), 0–500 μs (pulse width). (A) A final response-surface from the same example animal in Figs 1 and 2. (B) Post-stimulation-onset seizure duration distributions for the example animal shown in A. Filled light blue bars: Events receiving optimized stimulation; hashed bars: no-stimulation internal control for comparison. A 93% reduction in seizure duration was observed in this animal when the optimized parameter set of 362 Hz, 66.7 nC, and 189 µs pulse width was applied (P < 0.0001 Kolmogorov–Smirnov test). Note that optimized parameters were strikingly similar identified from the original and restricted parameter spaces in the same example animal (cf. Fig. 1B with Fig. 4A). Inset: Example seizure event receiving the optimized stimulation (thick blue bar) following detection (thin red line). Scale = 5 s, 0.5 mV. (C) Post-stimulation-onset seizure duration distributions at the group level (100 random seizure events per condition per animal). Filled dark blue bars: Events receiving optimized stimulation; hashed bars: no stimulation control. Seizure duration when stimulation was applied with each animal’s individualized optimized parameter set (P < 0.0001 two-sample Kolmogorov–Smirnov test, data from n = 4 mice). Inset: Stimulation with individualized optimized parameters provides significant seizure-reduction. Note that each colour/symbol represents a different animal, with the inverted green triangle corresponding to the same animal in Figs 1–3, but the other symbols representing new animals. (F) Average response-surface, based on the final response-surfaces of the four mice. Red dot marks the minimum of the surface at 402 Hz, 70.4 nC, and 149 µs pulse width. Related data can be found in Supplementary Figs 8 and 9 and Supplementary Table 6. KS = two-sample Kolmogorov-Smirnov statistical test.
Figure 5
Figure 5
Rotated electrode orientation still permits effective optimization and seizure-control. (A) Mice were initially implanted with electrode feet perpendicular to the midline (left). As varying the electrode orientation influences the direction of current flow relative to the stereotyped cytoarchitecture of the cerebellum—where parallel fibres of granule cells (blue) run perpendicular to the midline and perpendicular to the nearly-2D dendritic arbors of Purkinje cells (orange)—we also tested electrical stimulation of the cerebellar cortex with electrode feet positioned parallel to the midline (right). (B) Final response-surface from an example animal with a parallel electrode orientation. The minimum of 369.5 Hz, −62.5 nC, and 200 µs pulse width was identified from 1080 non-zero combinations. (C and D) Post-stimulation-onset seizure duration distributions for the example animal shown in B. Left filled light blue bars: Events receiving optimized stimulation; right filled light green bars: events receiving non-optimal stimulation; hashed bars: no-stimulation internal control. (C) When stimulation was applied with the optimized parameter set of 369.5 Hz, −62.5 nC charge and 200 µs pulse width, an 80% reduction in seizure duration was observed (P < 0.0001, Kolmogorov–Smirnov test). Inset: Example seizure event receiving the optimized stimulation (thick blue bar) following detection (thin red line). Scale = 3 s, 0.33 mV. (D) Seizure duration when stimulation was applied with the non-optimal parameter set of 4 Hz, −50 nC, and 400 µs pulse width produced a non-significant 4% increase in seizure duration in this animal (P = 0.25 two-sample Kolmogorov–Smirnov test). Inset: Example seizure event receiving non-optimal stimulation (thick green bar) following detection (thin red line). Scale = 3 s, 0.33 mV. (E and F) Post-stimulation-onset seizure duration distributions across animals (100 random seizure events per condition per animal). Left filled dark blue bars: Events receiving optimized stimulation; hashed bars: no-stimulation control; right filled dark green bars: events receiving non-optimal intervention. Inset: Individual animal data. Note that each colour/symbol represents a different animal, with colour coding consistent for E and F. Open symbols: Insignificant change at the individual animal level (P > 0.05). Closed symbols: Significant change for Kolmogorov–Smirnov and Mann–Whitney tests (P < 0.01) at the individual animal level. (E) Seizure duration when stimulation was applied with each animal’s individualized optimized parameter set on average reduced seizure duration by 58.7 ± 11.6% (P = 0.031 Wilcoxon test, significant in 6/6 mice). (F) Seizure duration with non-optimal parameter sets did not significantly change seizure duration (average 1 ± 1.5% reduction in seizure duration, P = 0.56 Wilcoxon test, not significant in 6/6 mice). (G) Average response-surface, based on the final response-surfaces of six mice. Red dot marks the minimum of the surface at 371.5 Hz, 50.5 nC, and 222 µs pulse width. Related data can be found in Supplementary Figs 4, 10 and 11 and Supplementary Tables 7 and 8. KS = two-sample Kolmogorov-Smirnov statistical test.

Similar articles

Cited by

References

    1. England MJ, Liverman CT, Schultz AM, Strawbridge LM. Epilepsy across the spectrum: promoting health and understanding. A summary of the Institute of Medicine report. Epilepsy Behav. 2012;25(2):266–276. - PMC - PubMed
    1. Asadi-Pooya AA, Rostamihosseinkhani M, Farazdaghi M. Seizure and social outcomes in patients with non-surgically treated temporal lobe epilepsy. Epilepsy Behav. 2021;122:108227. - PubMed
    1. Asadi-Pooya AA, Stewart GR, Abrams DJ, Sharan A. Prevalence and incidence of drug-resistant mesial temporal lobe epilepsy in the United States. World Neurosurg. 2017;99:662–666. - PubMed
    1. Brodie MJ, Barry SJE, Bamagous GA, Norrie JD, Kwan P. Patterns of treatment response in newly diagnosed epilepsy. Neurology. 2012;78(20):1548–1554. - PMC - PubMed
    1. Tian N, Boring M, Kobau R, Zack MM, Croft JB. Active epilepsy and seizure control in adults—United States, 2013 and 2015. MMWR Morb Mortal Wkly Rep. 2018;67(15):437–442. - PMC - PubMed

Publication types