. 2022 Mar 4;12(3):jkac023.
doi: 10.1093/g3journal/jkac023.

Chlamydomonas CHT7 is involved in repressing DNA replication and mitotic genes during synchronous growth

Affiliations

Chlamydomonas CHT7 is involved in repressing DNA replication and mitotic genes during synchronous growth

Yang-Tsung Lin et al. G3 (Bethesda). .

Abstract

In the green alga Chlamydomonas reinhardtii, regulation of the cell cycle in response to external cues is critical for survival in a changing environment. The loss of the nuclear COMPROMISED HYDROLYSIS OF TRIACYLGLYCEROLS 7 (CHT7) protein affects the expression of many genes especially in response to nitrogen availability. Cells lacking CHT7 exhibit abnormal cell morphology following nitrogen deprivation and fail to resume normal cell division after N resupply. To investigate the function of CHT7 in the regulation of cell cycle-related pathways, cells were synchronized, and RNA-seq analysis was performed during various stages of the cell cycle. In the cht7 mutant following nitrogen deprivation, the cells were not dividing, but a subset of cell cycle genes involved in DNA replication and mitosis were found to be derepressed, suggesting that the CHT7 protein plays a role in cell cycle regulation that is opposite to that of the mitotic cyclin-dependent kinases. Furthermore, genes for cell wall synthesis and remodeling were found to be abnormally induced in nondividing cht7 cells; this misregulation may deplete cellular resources and thus contribute to cell death following nitrogen deprivation. Lastly, 43 minimally characterized kinases were found to be highly misregulated in cht7. Further analysis suggested that some of these CHT7-regulated kinases may be related to the MAP3K and Aurora-like kinases, while others are unique. Together, these results suggest a role of CHT7 in transcriptional regulation of the cell cycle and reveal several pathways and genes whose expression appears to be subject to a CHT7-mediated regulatory network.

Keywords: Chlamydomonas reinhardtii; DNA replication; algal cell wall; cell cycle; cell division; mitosis; quiescence.


Figures

Fig. 1.
Fig. 1.
Assessment of cell cycle progression under synchronizing conditions. a, b) Flow cytometry analysis of DNA-stained cell cultures grown under N+, ND, and NR conditions. Samples of cells grown under synchronizing conditions were fixed and stained with SYTOX Green prior to flow cytometry analysis. Summary of DNA content (a) of cells at non-S/M (ZT0-10, ZT24) and S/M phases (ZT12-16) of N+ condition as well as cells under ND (ND0, 6, 12, and 36) and NR (NR6 and 12) conditions. Y-axis: average population (%) of cells carrying single (green), ≥2 (orange), or undetermined (gray) copies of chromosomes. n = 2 for each sample. Example plot (b) showing particle size (FSC-A; Forward scatter) vs DNA content (FITC-A) for samples at ZT6. Each dot represents noncell particle (black) or a cell carrying a single (green), 2 (orange), >2 (blue), or undetermined (brown and cyan) copies of the genome. One of the 2 replicates (n = 2) for each sample is presented. See also Supplementary Fig. 1. c, d) Cell morphology of wild type, CHT7-HA::cht7, and cht7 cells at ZT6. Two biological replicates (r1 and r2) for each strain were observed under the microscope and summarized in (c). n: numbers of cells observed. Y-axis: population (%) of cells of type 1 (green), 2 (orange), 3 (gray), 4 (yellow), and 5 (blue). The representative graphs and definition of each cell type are shown in (d).
Fig. 2.
Fig. 2.
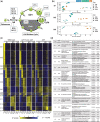
Transcriptome analysis of Chlamydomonas cell cultures under synchronizing conditions. a) Diagram of Chlamydomonas cell cycle and experimental design for RNA-sequencing analysis. Wild type, CHT7-HA::cht7, and cht7 cells were grown photoautotrophically in an environmental photobioreactor (ePBR) under turbidostatic control. ZT(n) samples represent cells at different stages of the cell division cycle under normal N+ conditions, where n = hours after the onset of light. Quiescence was triggered by nitrogen deprivation (ND) in continuous light. ND(n) samples were harvested, where n = hours after N deprivation. The exit from quiescence was induced by N resupply (NR). NR(n) samples were harvested after n hours of N refeeding. Three independent biological samples (n = 3) were analyzed. b) PCA of transcriptomes of all 81 samples. Samples are labeled with different colors and shapes as shown on the top and right of the graph to indicate combinations of different genotypes and timepoints, respectively. c) Z-score heatmap and d) GO enrichment analysis of 14 gene clusters across all conditions. In total, 14,456 transcripts with an average normalized read count >20 (n = 3) differentially expressed in any sample and timepoint were grouped into 14 gene clusters by hierarchical clustering based on their Z-scores. Each cluster represents a unique expression pattern across all conditions. Hits (x/y): number of the input genes (x) over total genes (y) within a GO term. See also Supplementary Fig. 1 and Table 1.
Fig. 3.
Fig. 3.
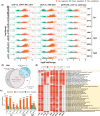
DE analysis of all 3 strains. a) Volcano plots showing the upregulated (orange; log2-fold change > 1, P-adj < 0.05), downregulated (green; log2-fold change < 1, P-adj < 0.05), and non (gray) DEGs in 3 groups of any 2 genotypes (e.g. cht7 vs wild type) across all timepoints. X-axis: log2-fold change. Y-axis: -log10 adjusted P-value (P-adj). n = number of DEGs. b) Venn diagram example showing the selection of cht7-specific DEGs from the ND6 samples. DEGs between the WT and CHT7HA::cht7 were excluded from DEGs between cht7 and WT and CHT7HA::cht7, respectively. c) Numbers of up- (orange) and down- (green) regulated cht7-DEGs across all timepoints. d) GO enrichment analysis of upregulated cht7-DEGs across all timepoints. Twenty-three GO terms of biological processes related to the S/M phase are highlighted in light yellow. Number of upregulated DEGs are labeled in the boxes. Number of total annotated genes are indicated after GO terms. See also Supplementary Fig. 2.
Fig. 4.
Fig. 4.
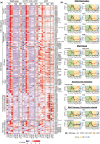
Derepressed DNA replication in the cht7 mutant. a) Z-score heatmap of S-phase genes across all conditions. Genes that were differentially expressed (log2-fold change > 1, P-adj < 0.05) in cht7 at ≥1 timepoints are presented. pre-RC, prereplicative complex; pre-IC, preinitiation complex; HR repair, homologous recombination repair; ICL, interstrand crosslink. Expression of representative S-phase genes (b) and DNA damage checkpoint-related genes (c) in cht7 (orange), WT (black), and CHT7-HA::cht7 (gray) across all timepoints. Y-axis: normalized read count. ORC1, origin recognition complex 1; Cdt1, Cdc10-dependent transcript 1; CDC45, cell division cycle 45; RFA1, replication factor A1; POLA2, DNA polymerase α2; TOP2, topoisomerase II; MCM8, minichromosome maintenance 8; CTIP, CtBP (C-terminal binding protein) interacting protein; BRCA2, breast cancer gene 2. MND1, meiotic nuclear divisions 1; SMC5B, structural maintenance of chromosomes 5; ASF1, anti-silencing factor 1; HTV1, histone H3 variant 1; HLM8, histone-lysine N-methyltransferase 8; ATR, Ataxia Telangiectasia mutated (ATM) and Rad3-related.
Fig. 5.
Fig. 5.
Derepressed mitotic genes in the cht7 mutant. a) Z-score heatmap of mitotic genes. Genes that were differentially expressed (log2-fold change > 1, P-adj < 0.05) in cht7 at ≥1 timepoints are presented. (SAC) Spindle assembly checkpoint (b) Expression of representative mitotic genes in cht7 (orange), WT (black), and CHT7-HA::cht7 (gray) across all timepoints. Y-axis: normalized read count. SMC4, structural maintenance of chromosomes 4; CAPD2, chromosome-associated protein D2; SPC25, spindle pole component 25; NUF2, nuclear filament-containing protein 2; AUG1, AUGMIN subunit 1; BUB1, budding uninhibited by benzimidazole 1; GCP4, γ-tubulin complex protein 4; KIN14A-1, kinesin-like protein 14A-1; ARC6-like, accumulation and replication of chloroplasts 6-like; MIND1, minicell mutant D1. See also Supplementary Table 3.
Fig. 6.
Fig. 6.
Impact of CHT7 on cell cycle regulation of Chlamydomonas. a) Regulatory network of the cell cycle of Chlamydomonas and proposed model of CHT7-mediated cell cycle regulation. Refer to text for details. b–e) Expression of the genes encoding cell cycle regulators in cht7 (orange), WT (black), and CHT7-HA::cht7 (gray) across all timepoints. Y-axis: normalized read count. RB, retinoblastoma protein; E2F, E2 factor; DP1, dimerization partner 1; CYC, cyclin; CDK, cyclin-dependent kinase; APC, anaphase-promoting complex; CDC20, cell division cycle protein 20; CDH1, Cdc20 homolog-1. See also Supplementary Table 3.
Fig. 7.
Fig. 7.
Misregulated cell wall-associated genes in the cht7 mutant. a) Z-score heatmap of cell wall remodeling and biosynthetic genes. Genes that were differentially expressed (log2-fold change > 1, P-adj < 0.05) in cht7 at ≥3 timepoints are presented. (SRCR) Scavenger receptor cysteine-rich. b, c) Expression of representative genes in cht7 (orange), WT (black), and CHT7-HA::cht7 (gray) across all timepoints. Y-axis: normalized read count. PHC, pherophorin; MMP, matrix metalloprotease; SUB, subtilisin-like protease; SRR, scavenger receptor cysteine-rich; GSL1, Gibberellin Stimulated-Like protein 1 (Callose synthase); VLE1, vegetative lytic enzyme 1; GAS28, Gamete-specific 28. d) Working model of CHT7-meidated cell wall regulation in Chlamydomonas. See also Supplementary Table 3.
Fig. 8.
Fig. 8.
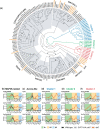
Analysis of protein kinase families misregulated in cht7. a) ML phylogeny of the kinase domain of 43 protein kinases encoded by genes that are differentially expressed (log2-fold change >1, P-adj < 0.05) in cht7 at ≥5 timepoints along with kinase domains retrieved from 122 known protein kinases. Confidence of branches was tested by aLRT branch support. Refer to Materials and methods for details. Cr, Chlamydomonas reinhardtii; At, Arabidopsis; Lt, Lotus japonicus; Mt, Medicago truncatula; Ps, Pisum sativum; Nt, Nicotiana tabacum; Ll, Lilium longiflorum; Os, Oryza sativa; Pp, Physcomitrella patience; CCaMK, Ca2+/CaM-dependent protein kinase; CIPK, CBL-interacting protein kinase; CDK and CPK, calcium-dependent protein kinases; CNK, Chlamydomonas NIMA-related kinase; NEK, NIMA-related Kinase; GSK3, glycogen synthase kinase 3. b–f) Expression of genes encoding MAPK3K-related kinases (b), ALKs (c), and cluster 1–3 potential protein kinases (d–f) in cht7 (orange), WT (black), and CHT7-HA::cht7 (gray) across all timepoints. Y-axis: normalized read count. See also Supplementary Data 1, Tables 3 and 4.

Similar articles

Cited by

  • The micromammals.
    Forsburg SL. Forsburg SL. G3 (Bethesda). 2024 Jun 5;14(6):jkae073. doi: 10.1093/g3journal/jkae073. G3 (Bethesda). 2024. PMID: 38837137 Free PMC article.

References

    1. Alexa A, Rahnenfuhrer J. topGO: Enrichment Analysis for Gene Ontology. R Package Version 2.42.0; 2020.
    1. Alexa A, Rahnenfuhrer J, Lengauer T.. Improved scoring of functional groups from gene expression data by decorrelating GO graph structure. Bioinformatics. 2006;22(13):1600–1607. - PubMed
    1. Anisimova M, Gascuel O.. Approximate likelihood-ratio test for branches: a fast, accurate, and powerful alternative. Syst Biol. 2006;55(4):539–552. - PubMed
    1. Atkins KC, Cross FR.. Interregulation of CDKA/CDK1 and the plant-specific cyclin-dependent kinase CDKB in control of the Chlamydomonas cell cycle. Plant Cell. 2018;30(2):429–446. - PMC - PubMed
    1. Beall EL, Manak JR, Zhou S, Bell M, Lipsick JS, Botchan MR.. Role for a Drosophila Myb-containing protein complex in site-specific DNA replication. Nature. 2002;420(6917):833–837. - PubMed

Publication types