. 2022 Jul 7;31(13):2262-2278.
doi: 10.1093/hmg/ddac033.

Multisystem involvement, defective lysosomes and impaired autophagy in a novel rat model of nephropathic cystinosis

Affiliations

Multisystem involvement, defective lysosomes and impaired autophagy in a novel rat model of nephropathic cystinosis

Patrick Krohn et al. Hum Mol Genet. .

Abstract

Recessive mutations in the CTNS gene encoding the lysosomal transporter cystinosin cause cystinosis, a lysosomal storage disease leading to kidney failure and multisystem manifestations. A Ctns knockout mouse model recapitulates features of cystinosis, but the delayed onset of kidney manifestations, phenotype variability and strain effects limit its use for mechanistic and drug development studies. To provide a better model for cystinosis, we generated a Ctns knockout rat model using CRISPR/Cas9 technology. The Ctns-/- rats display progressive cystine accumulation and crystal formation in multiple tissues including kidney, liver and thyroid. They show an early onset and progressive loss of urinary solutes, indicating generalized proximal tubule dysfunction, with development of typical swan-neck lesions, tubulointerstitial fibrosis and kidney failure, and decreased survival. The Ctns-/- rats also present crystals in the cornea, and bone and liver defects, as observed in patients. Mechanistically, the loss of cystinosin induces a phenotype switch associating abnormal proliferation and dedifferentiation, loss of apical receptors and transporters, and defective lysosomal activity and autophagy in the cells. Primary cultures of proximal tubule cells derived from the Ctns-/- rat kidneys confirmed the key changes caused by cystine overload, including reduced endocytic uptake, increased proliferation and defective lysosomal dynamics and autophagy. The novel Ctns-/- rat model and derived proximal tubule cell system provide invaluable tools to investigate the pathogenesis of cystinosis and to accelerate drug discovery.


Figures

Figure 1
Figure 1
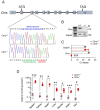
Generation and validation of the Ctns knockout rat model. (A) CRISPR/Cas9 induced a 12 bp deletion (blue), which was repaired by an 8 bp insertion (green), generating a frameshift of the open reading frame and resulting in a premature stop codon (TGA, red) in exon 3 of the Ctns gene. (B) Ctns genomic DNA analyzed by PCR and agarose gel electrophoresis isolated from kidney biopsies. (C) Ctns and Gapdh expression in kidney biopsies were analyzed by RT-qPCR (n = 5 rats per condition). (D) Cystine levels measured by HPLC in different tissues of 40-week-old Ctns rats (n = 5 Ctns+/+ and n = 6 Ctns−/− rats per condition). Plotted data represent mean ± SEM. Each dot represents one rat. Two-tailed unpaired Student’s t-test, *P < 0.05, **P < 0.01, ***P < 0.001 and #P < 0.0001 relative to Ctns+/+ rats. BDR: below detection range.
Figure 2
Figure 2
Deletion of Ctns leads to cystine accumulation in kidneys, growth retardation and renal Fanconi syndrome in rats. (A) Cystine levels measured by HPLC in kidney cortex from Ctns+/+ and Ctns−/− rats at 3, 6, 12, 20 and 40 weeks of age (n = 5 rats at 3, n = 4 rats at 6 and n = 6 rats at 12, 20 and 40 weeks per group). (B) Measurement of body weight over time in male and female rats (n = 10 rats per group). (C) Overnight urine excretion (milliliters of urine per 16 h normalized to body weight; n = 10 rats per group). (D) Urinary excretion of glucose (n = 10 rats per group). (E) Coomassie blue–stained SDS-PAGE analysis of urine at 6, 12, 20, 28 and 40 weeks of age and densitometry quantification of albumin (n = 8 rats per group). A total of 15 μg of BSA was loaded as a positive control (Mw ∼ 66.5 kDa). (F) Urinary excretion of the low-molecular-weight protein CC16 (n = 8 rats per condition). (G) Representative western blotting and densitometry quantification of transferrin (TF) and vitamin D–binding protein (VDBP) in urine derived from 20-week-old Ctns rats (n = 8 rats per group). Measurement of urinary (H) phosphate and (I) calcium (n = 10 rats per group). (J) Relative concentration of amino acids in urine derived from 28-week-old Ctns rats (n = 5 rats per group). Ala, alanine; Arg, arginine; Asn, asparagine; Asp, aspartate; Cys, cysteine; Gln, glutamine; Glu, glutamate; Gly, glycine; His, histidine; Hyp, hydroxyproline; Ile, isoleucine; Leu, leucine; Lys, lysine; Met, methionine; Orn, ornithine; Phe, phenylalanine; Pro, proline; Ser, serine; Thr, threonine; Trp, tryptophan; Tyr, tyrosine; Val, valine. All the urine parameters were normalized to urinary creatinine concentration. Plotted data represent mean ± SEM. Each dot represents one rat. Two-tailed unpaired Student’s t-test, *P < 0.05, **P < 0.01, ***P < 0.001 and #P < 0.0001 relative to Ctns+/+ or Ctns−/− rats. ns: not significant.
Figure 3
Figure 3
Inflammation, fibrosis and apoptosis in Ctns−/− rat kidneys. (A) Representative confocal micrographs and quantification of the number of CD3+ cells (red, top) in kidneys of 12-, 20- and 40-week-old Ctns rats (n = 67–95 areas pooled from three rats per group). (B) Representative micrographs of Picro-Sirius Red staining and quantification of fibrotic tissue in the cortex relative to tissue surface (bottom, n = 5 Ctns+/+ and n = 8 Ctns−/− rats per group). The black dotted line delineates the cortex from the medulla. Insets: high magnification of the corresponding section. (C) RT-qPCR analysis of inflammatory markers Cd3g, Ccl19, Lgals3, Tlr4 and fibrotic markers Col6a1, Col1a1, Fn1, Col3a1, Vim in kidneys of 20-week-old rats. Gene target expression normalized to Gapdh and relative to Ctns+/+ rats (black dotted line; n = 12 Ctns+/+ rats and n = 15 Ctns−/− per group). (D) Representative picture of swan-neck lesion (dotted line) and confocal micrographs of cleaved Caspase 3 (Casp 3, red). (E) RT-qPCR analysis of Lcn2, Havcr1, Cts3, Clu and Ccn1 expression in Ctns rat kidneys. Gene target expression normalized to Gapdh and relative to Ctns+/+ rats (black dotted line; n = 6 rats per group). (F and G) Biochemical analysis of (F) blood urea nitrogen (BUN) levels and (G) the enzymatic creatinine levels measured from Ctns rat plasma samples at different ages (n = 10 rats per group). (H) Percentage survival of male and female Ctns rats over time (at day 0: n = 17 male Ctns+/+, n = 19 male Ctns−/−, n = 19 female Ctns+/+ and n = 20 female Ctns−/− rats; at week 96: n = 7 male Ctns+/+, n = 0 male Ctns−/−, n = 8 female Ctns+/+ and n = 0 female Ctns−/− rats). Proximal tubules labeled by AQP1 (green) and nuclei counterstained with DAPI (gray) in (A and D). Scale bars: 20 μm in (A), 500 μm in (B) and 50 μm in (D). Plotted data represent mean ± SEM. Two-tailed unpaired Student’s t-test, *P < 0.05, **P < 0.01, ***P < 0.001 and #P < 0.0001 relative to Ctns+/+ rats. ns: not significant, G: glomerulus.
Figure 4
Figure 4
Defective receptor-mediated endocytosis and cell proliferation in Ctns−/− rats. (A) Workflow of the strategy used to investigate (1) receptor-mediated endocytosis (β-lactoglobulin) and (2) fluid-phase endocytosis (dextran). After 20 min from tail vein injection with either Cy5-β-lactoglobulin (0.4 mg kg−1) or Alexa 647-dextran (0.2 mg kg−1), kidneys were fixed, processed and analyzed by confocal microscopy. (B and C) Representative confocal micrographs and quantification of the mean fluorescence intensity of (B) Cy5-β-lactoglobulin (n = 229 Ctns+/+ and n = 304 Ctns−/− tubules, pooled from two rats per group) or (C) Alexa 647-dextran (n = 93 Ctns+/+ and n = 79 Ctns−/− tubules, pooled from two rats per group) in AQP1+ (green) proximal tubules of Ctns rat kidneys. Insets: high magnification of Alexa 647 dextran+ or Cy5-labeled β-lactoglobulin+ structures in AQP1+ PTs. (D) Immunoblotting and quantification of megalin protein levels in whole-kidney lysates from Ctns rats (n = 6 rats per group). β-Actin was used as a loading control. (E) Representative confocal micrographs and quantifications of the mean fluorescence intensity of megalin (red) in AQP1+ (green) proximal tubules of Ctns rat kidneys (n = 249 Ctns+/+ and n = 280 Ctns−/− tubules, pooled from four rats per group). Insets: high magnification of megalin+ structures in AQP1+ PTs. (F) RT-qPCR analysis of Cdk10, Ccna2, Ccnb2, Clcn5, Lrp2, Cubn, Slc5a2 and Slc34a1. Gene target expression normalized to Gapdh and relative to Ctns+/+ rats (black dotted line; n = 9 rats per group). (G) Representative confocal micrographs and quantification of the percentage of PCNA+ (red) nuclei in AQP1+ (green) proximal tubules of Ctns rat kidneys (n = 150 tubules, pooled from 3 rats per group). Nuclei counterstained with DAPI (gray) in (B, C, E and G). Scale bars: 40 μm in (B, C, E and G). Fluorescence intensity was normalized on tubule area in (B, C and E). Plotted data represent mean ± SEM. Two-tailed unpaired Student’s t-test, *P < 0.05, **P < 0.01, ***P < 0.001 and #P < 0.0001 relative to Ctns+/+ rats. G: glomerulus.
Figure 5
Figure 5
Cystine crystals and enlarged lysosomes in proximal tubules of cystinotic rats. (A) Representative electron micrographs of proximal tubules derived from 20-week-old Ctns rat kidneys. Arrowheads indicate the presence of needle-shaped crystals in dense bodies in Ctns−/− samples. (B) Representative confocal micrographs of Lamp1+ structures (red) in proximal tubules of 12- and 20-week-old Ctns rats. Quantification of the mean fluorescent intensity of Lamp1 (top, each dot represents the mean fluorescent intensity per tubule, n = 90 tubules per condition pooled from three rats per group) and total lysosomal area (bottom, each dot represents the average size of Lamp1+ vesicles in one tubule, n = 56 Ctns+/+n = 60 Ctns−/− tubules at 12 weeks, and n = 31 Ctns+/+n = 38 Ctns−/− tubules at 20 weeks, pooled from three rats per group). Fluorescence intensity and lysosomal area were normalized on tubule area. (C) Western blotting and densitometry analyses of lysosomal and autophagy protein levels in whole-kidney lysates from Ctns rats (n = 4 rats per group). (D) Workflow of the strategy used to investigate lysosomal degradative capacity. After 90 min from tail vein injection of Cy5-β-lactoglobulin (0.4 mg kg−1), the labeled protein is internalized and degraded by endolysosomes. The kidneys were then processed and analyzed by confocal microscopy. (E and F) Representative confocal micrographs and quantifications of the mean fluorescence intensity of (E) Cy5-β-lactoglobulin (red; n = 110 Ctns+/+ and n = 118 Ctns−/− tubules, pooled from two rats per group) or (F) p62 (red; n = 90 Ctns+/+ and n = 116 Ctns−/− tubules, pooled from two rats per group) in AQP1+ (green) proximal tubules of Ctns rat kidneys. Fluorescence intensity was normalized on tubule area. Nuclei counterstained with DAPI (gray or blue) in (B, E and F). Each dot represents fluorescence intensity in one tubule in (B, E and F) or one rat (C). β-actin or α-tubulin was used as loading control. Scale bars: 2 μm in (A), 20 μm in (B), 50 μm in (E) and 40 μm in (F). Plotted data represent mean ± SEM. Two-tailed unpaired Student’s t-test, *P < 0.05, **P < 0.01, ***P < 0.001 and #P < 0.0001 relative to Ctns+/+ rats. ns: not significant. G: glomerulus.
Figure 6
Figure 6
Proximal tubule cells derived from Ctns−/− rat kidneys recapitulate key features of cystinosis. (A) Workflow of the strategy used to develop primary proximal tubule cells derived from Ctns rat kidneys (rPTCs). (B) Immunoblotting of proximal tubule and lysosomal markers in rPTCs. (C) Ctns+/+ rPTCs were loaded with Cy5-β-lactoglobulin (red; at the indicated concentration) for 20 min at 37°C or loaded with Cy5-β-lactoglobulin (red, 100 μg ml−1) in the presence or absence of Dynasore (40 μm) for 20 min at 37°C and analyzed by confocal microscopy. Quantification of the number of Cy5-β-lactoglobulin+ structures (n = 163–193 cells pooled from two biologically independent experiments). Each dot represents the number of Cy5-β-lactoglobulin+ structures in one cell. (D) mRNA levels of Ctns, Clcn5, Lrp2 and Cubn in rPTC analyzed by RT-qPCR. Gene target expression normalized to Gapdh and relative to Ctns+/+ rPTC (black dotted line; n = 5 biologically independent experiments). (E) Ctns genomic DNA analyses by PCR and agarose gel electrophoresis isolated from rPTCs. (F) Intracellular cystine levels were measured by HPLC (n = 7 biologically independent experiments per group). (G) Ctns+/+ and Ctns−/− rPTCs were loaded with Cy5-β-lactoglobulin (red, 100 μg ml−1) for 20 min at 37°C and analyzed by confocal microscopy. Quantification of the number of Cy5-β-lactoglobulin+ structures (n = 208 Ctns+/+ and n = 228 Ctns−/− cells pooled from three biologically independent experiments). Each dot represents the number of Cy5-β-lactoglobulin+ structures in one cell. (H) Immunoblotting and quantification of megalin protein levels in rPTC lysates (n = 5 independent experiments). (I) Cells were loaded with bromodeoxyuridine (BrdU; 1.5 μg ml−1 for 16 h at 37°C), analyzed by confocal microscopy and quantified as percentage of BrdU+ cells per field (n = 77 Ctns+/+ and n = 79 Ctns−/− fields containing ~30 cells, pooled from two independent experiments). (J) Immunoblotting and quantification of Lamp1 protein levels in rPTC lysates (n = 4 independent experiments per group). (K) High-magnification representative 3D surface renderings of Ctns rPTCs labeled with anti-Lamp1 (red) antibody and quantification of lysosomal vesicle diameter (μm). Each dot represents the average size of Lamp1+ vesicles in one cell (n = 6 Ctns+/+ and n = 11 Ctns−/− fields). (L) Cells were loaded with Bodipy-FL-PepA (1 μm, green) for 1 h at 37°C, fixed, immunostained with anti-Lamp1 antibody (red) and analyzed by confocal microscopy. Quantification of PepA fluorescent signal as mean fluorescence intensity per cell (n = 84 Ctns+/+ and n = 88 Ctns−/− cells pooled from two independent experiments). (M) Cells were cultured under normal and growth factors/nutrient-depleted conditions (Starved) in the presence or absence of 250 nm Bafilomycin (BafA1) for 4 h. Immunoblotting and quantification of Lc3 protein levels in rPTC lysates (n = 3 independent experiments). One-way ANOVA followed by Dunnet’s post hoc test, **P < 0.01 relative to rPTCs treated with BafA1. β-Actin was used as loading control in (B, H, J and M). Nuclei counterstained with DAPI (blue) in (C, G, I, K and L). Scale bars: 20 μm in (C, G, I and L) and 7 μm in (K). Plotted data represent mean ± SEM. Two-tailed unpaired Student’s t-test. *P < 0.05, **P < 0.01, ***P < 0.001, and #P < 0.0001 relative to Ctns+/+ rPTCs. ns: not significant.
Figure 7
Figure 7
Ctns deletion causes corneal crystal formation and bone defects Ctns−/− rats. (A) Anterior eye OCT imaging of Ctns rat eyes at 12, 24 and 40 weeks of age. Insets: high magnification of indicated areas (yellow arrows: crystals). (B) Slit-lamp photography of Ctns rat eyes at 12, 24 and 40 weeks of age. (C) Representative electron micrographs of 20-week-old Ctns rat eyes (yellow arrows: crystals). (D) Parathyroid hormone (PTH), fibroblast growth factor 23 (FGF23), 1-a hydroxylation of vitamin D3 (1,25(OH)2 Vit D3), tartrate-resistant acid phosphatase (TRAcP 5b), C-terminal telopeptide of type I collagen (CTX I) and N-terminal propeptide of type I procollagen (P1NP) levels in plasma from 24- and 36-week-old Ctns rats. (E) Representative microCT images of femurs derived from Ctns rats at 56 weeks of age. Plotted data represent mean ± SEM. Scale bars: 200 μm in (A), 2 μm in (C). Two-tailed unpaired Student’s t-test. *P < 0.05, and **P < 0.01, relative to Ctns+/+ rPTCs. ns: not significant.

Similar articles

Cited by

References

    1. van der Wijst, J., Belge, H., Bindels, R.J.M. and Devuyst, O. (2019) Learning physiology from inherited kidney disorders. Physiol. Rev., 99, 1575–1653. - PubMed
    1. Town, M., Jean, G., Cherqui, S., Attard, M., Forestier, L., Whitmore, S.A., Callen, D.F., Gribouval, O., Broyer, M., Bates, G.P.et al. (1998) A novel gene encoding an integral membrane protein is mutated in nephropathic cystinosis. Nat. Genet., 18, 319–324. - PubMed
    1. Gahl, W.A., Thoene, J.G. and Schneider, J.A. (2002) Cystinosis. N. Engl. J. Med., 347, 111–121. - PubMed
    1. Nesterova, G. and Gahl, W. (2008) Nephropathic cystinosis: late complications of a multisystemic disease. Pediatr. Nephrol. (Berlin, Germany), 23, 863–878. - PubMed
    1. Brodin-Sartorius, A., Tête, M.-J., Niaudet, P., Antignac, C., Guest, G., Ottolenghi, C., Charbit, M., Moyse, D., Legendre, C., Lesavre, P.et al. (2012) Cysteamine therapy delays the progression of nephropathic cystinosis in late adolescents and adults. Kidney Int., 81, 179–189. - PubMed

Publication types

Substances