Integration of genomics, transcriptomics and metabolomics identifies candidate loci underlying fruit weight in loquat
- PMID: 35137085
- PMCID: PMC9071381
- DOI: 10.1093/hr/uhac037
Integration of genomics, transcriptomics and metabolomics identifies candidate loci underlying fruit weight in loquat
Abstract
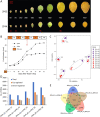
Fruit weight is an integral part of fruit-quality traits and directly influences commodity values and economic returns of fruit crops. Despite its importance, the molecular mechanisms underlying fruit weight remain understudied, especially for perennial fruit tree crops such as cultivated loquat (Eriobotrya japonica Lindl.). Auxin is known to regulate fruit development, whereas its role and metabolism in fruit development remain obscure in loquat. In this study, we applied a multi-omics approach, integrating whole-genome resequencing-based quantitative trait locus (QTL) mapping with an F1 population, population genomics analysis using germplasm accessions, transcriptome analysis, and metabolic profiling to identify the genomic regions potentially associated with fruit weight in loquat. We identified three major loci associated with fruit weight, supported by both QTL mapping and comparative genomic analysis between small- and big-fruited loquat cultivars. Comparison between two genotypes with contrasting fruit weight performance through transcriptomic and metabolic profiling revealed an important role of auxin in regulating fruit development, especially at the fruit enlarging stage. The multi-omics approach identified two homologs of ETHYLENE INSENSITIVE 4 (EjEIN4) and TORNADO 1 (EjTRN1) as promising candidates controlling fruit weight. Moreover, three single nucleotide polymorphism (SNP) markers were closely associated with fruit weight. Results from this study provided insights from multiple perspectives into the genetic and metabolic controls of fruit weight in loquat. The candidate genomic regions, genes, and sequence variants will facilitate understanding the molecular basis of fruit weight and lay a foundation for future breeding and manipulation of fruit weight in loquat.
© The Author(s) 2022. Published by Oxford University Press. All rights reserved.
Figures


Similar articles
-
Genome-Wide Analysis of SAUR Gene Family Identifies a Candidate Associated with Fruit Size in Loquat (Eriobotrya japonica Lindl.).Int J Mol Sci. 2022 Oct 31;23(21):13271. doi: 10.3390/ijms232113271. Int J Mol Sci. 2022. PMID: 36362065 Free PMC article.
-
Genome assembly of wild loquat (Eriobotrya japonica) and resequencing provide new insights into the genomic evolution and fruit domestication in loquat.Hortic Res. 2022 Dec 2;10(2):uhac265. doi: 10.1093/hr/uhac265. eCollection 2023 Feb. Hortic Res. 2022. PMID: 36778182 Free PMC article.
-
Footprints of domestication revealed by RAD-tag resequencing in loquat: SNP data reveals a non-significant domestication bottleneck and a single domestication event.BMC Genomics. 2017 May 6;18(1):354. doi: 10.1186/s12864-017-3738-y. BMC Genomics. 2017. PMID: 28477616 Free PMC article.
-
Biological Activities of Extracts from Loquat (Eriobotrya japonica Lindl.): A Review.Int J Mol Sci. 2016 Dec 6;17(12):1983. doi: 10.3390/ijms17121983. Int J Mol Sci. 2016. PMID: 27929430 Free PMC article. Review.
-
Postharvest physiology and technology of loquat (Eriobotrya japonica Lindl.) fruit.J Sci Food Agric. 2014 Jun;94(8):1495-1504. doi: 10.1002/jsfa.6560. J Sci Food Agric. 2014. PMID: 24395491 Review.
Cited by
-
Construction of the first high-density SNP genetic map and identification of QTLs for the natural rubber content in Taraxacum kok-saghyz Rodin.BMC Genomics. 2023 Jan 10;24(1):13. doi: 10.1186/s12864-022-09105-3. BMC Genomics. 2023. PMID: 36627555 Free PMC article.
-
Comparative Anatomical and Transcriptomics Reveal the Larger Cell Size as a Major Contributor to Larger Fruit Size in Apricot.Int J Mol Sci. 2023 May 14;24(10):8748. doi: 10.3390/ijms24108748. Int J Mol Sci. 2023. PMID: 37240096 Free PMC article.
-
Integrating QTL mapping and transcriptomics to decipher the genetic architecture of sterol metabolism in Brassica napus L.Hortic Res. 2024 Jul 24;11(9):uhae196. doi: 10.1093/hr/uhae196. eCollection 2024 Sep. Hortic Res. 2024. PMID: 39257541 Free PMC article.
-
Chloroplast genomes of Eriobotrya elliptica and an unknown wild loquat "YN-1".Sci Rep. 2024 Aug 13;14(1):18816. doi: 10.1038/s41598-024-69882-7. Sci Rep. 2024. PMID: 39138300 Free PMC article.
-
Occurrence of White Flesh Color and Refreshing Flavor Following Phytoene Synthase 2A Gene Variation in Loquat Fruit.J Agric Food Chem. 2025 Apr 30;73(17):10531-10544. doi: 10.1021/acs.jafc.4c11968. Epub 2025 Apr 15. J Agric Food Chem. 2025. PMID: 40233287 Free PMC article.
References
-
- Mauxion JP, Chevalier C, Gonzalez N. Complex cellular and molecular events determining fruit size. Trends Plant Sci. 2021;26:1023–38. - PubMed
-
- Li YH, Zhang Z, Sun GM. Changes in cell number and cell size during pineapple (Ananas comosus L.) fruit development and their relationship with fruit size. Aust J Bot. 2010;58:673–8.
-
- Ozga JA, Reinecke DM. Hormonal interactions in fruit development. J Plant Growth Regul. 2003;22:73–81.
-
- Zheng WW, Kim YJ, Oh SM, Chun IJ. Anatomical analysis of fruit development of different-sized ‘Hongro’and ‘Fuji’apple fruits. Hortic Environ Biotechnol. 2009;50:160–5.
LinkOut - more resources
Full Text Sources

